Introduction
Multimodal information is often required for diagnostic or research purposes as each imaging technique provides complementary data, for example about anatomy, physiology, or metabolism. Positron emission tomography (PET) measures the distribution and concentration of certain molecules in the body, magnetic resonance imaging (MRI) reflects proton density and tissue relaxation times, and computerized tomography (CT) maps the electron densities of tissues.
Imaging hardware has constantly evolved to adapt to ever-changing needs. Technological advances have led to faster acquisition, higher spatial resolution, and better image contrast. In parallel, efforts have been made to develop hybrid devices that acquire complementary information from two combined different imaging modalities in the same imaging session, to address their technical limitations, maximize patient convenience, and minimize spatial distortions between the two datasets.
Initially, the need for accurately aligning molecular and anatomical images led to the development of combined PET/CT scanners ( ). While hybrid PET/CT scanners have rapidly become well established clinically ( ), the development and adoption of hybrid PET/MRI has been considerably slower due to technological and methodological challenges ( ; ). Indeed, the possibility of combining PET and MRI was first mentioned in 1991 ( ), simultaneous data acquisition was first demonstrated in vivo in 1997 ( ), in humans a decade later ( ), and clinical systems became commercially available in 2010.
In this chapter, the state-of-the-art integrated PET/MRI scanners will first be described. Next, the traditional methods for addressing the most important methodological challenge, attenuation correction, will be presented. Additionally, opportunities enabled by the simultaneous acquisition such as MR-assisted PET motion correction and image enhancement will be discussed. Finally, the deep learning approaches, recently introduced to further enhance the traditional methods, will be presented.
Integrated PET/MRI systems
Several designs have been considered for integrating PET and MRI ( ; ). The first MR-compatible PET systems used photomultiplier tubes (PMTs) coupled to scintillator crystals to convert the annihilation photons into an electrical signal. However, as PMTs are very sensitive to magnetic fields, they had to reside outside the magnet and long optical fibers were used to couple them to the scintillator crystals placed inside the bore. A prototype small animal scanner using this concept was used to simultaneously acquire, for the first time, PET images and 31 P N spectra ( ). Although several improvements were subsequently proposed, the PMT-based approaches had limited performance and were exclusively used for proof-of-concept imaging studies in small animals ( ). In fact, the first PMT-based human whole-body PET/MRI scanner, the Philips TF Ingenuity (Philips Healthcare, Amsterdam, Netherlands), allowed only sequential imaging. For this purpose, separate minimally-modified PET and MRI scanners were placed in the same room and shared a revolving bed but maintained enough distance to minimize electromagnetic interference. Data acquired from each modality independently were fused using software. The first two Philips TF Ingenuity systems were installed at Mount Sinai Medical Center in New York, USA, and at Geneva University Hospital in Switzerland, in 2010 ( ).
The development of solid-state semiconductor-based photo sensors, called avalanche photodiodes (APDs), that preserve the light sensitivity of PMTs and are insensitive to magnetic fields ( ), allowed PET detectors to be positioned in the bore of the MRI scanner. This enabled simultaneous data acquisition using a practical approach that would eventually be scaled up to humans.
Several APD-based PET/MRI inserts for high-field small animal MRI systems were first developed ( ; ; ). In parallel with these advancements in the preclinical arena, and with the end goal of developing a fully integrated PET/MRI scanner, Siemens Healthineers (Erlangen, Germany) introduced a 3T MR-compatible PET insert for human brain imaging, called BrainPET ( ). The BrainPET prototype had an internal diameter of 36 cm and an axial field-of-view of ∼19 cm which allowed the imaging of the whole human brain in one bed position. Two MRI head radiofrequency coils (an outer birdcage transmit/receive coil and an inner 8-channel receive array) designed to minimally attenuate 511 keV photons were positioned inside the BrainPET. Only four BrainPET prototypes were installed around the world between 2007 and 2010 at University of Tübingen (Tübingen, Germany), Athinoula A. Martinos Center for Biomedical Imaging at Massachusetts General Hospital (Charlestown, MA. USA), Forschungszentrum Jülich (Jülich, Germany) and Emory University (Atlanta, GA, USA).
Siemens also introduced the first fully integrated whole-body PET/MRI system, called Biograph mMR. In this scanner, the APD-based PET detectors were positioned between the gradient and the radiofrequency coils and the data acquisition software was also fully integrated. The PET detector block consists of an 8 × 8 array of 4 × 4 × 20 mm 3 LSO crystals readout by an array of 3 × 3 APDs. These blocks are arranged in eight rings with 56 detectors each, providing a transverse field-of-view of 59.4 cm and an axial field-of-view of 25.8 cm. A water-based cooling system was also integrated to ensure optimal PET performance even while running the most demanding MRI sequences. The MRI system is based on the 70 cm diameter bore Siemens Magnetom 3T Verio MRI scanner. In terms of performance, the PET component of the mMR was similar to that of the PET/CT scanners commercially available at that time (e.g., Siemens mCT). Its average spatial resolution at 10 mm radius from the center of the field-of-view is 4.3 mm full width at half maximum (FWHM), peak noise-equivalent count rate is 184 kcps at 23.1 kBq/mL, scatter fraction is 37.9%, while its sensitivity is 15 cps/kBq at the center of the field-of-view ( ). The Siemens Biograph mMR system received the CE mark and FDA approval in 2011. The first system was installed at the Technical University Munich (Munich, Germany) in 2010 and the second at the Athinoula A. Martinos Center for Biomedical Imaging at Massachusetts General Hospital (Charlestown, MA, USA) in 2011.
Although APDs allowed fully integrated PET/MRI scanners for human imaging to be developed, their performance is inferior to that of PMTs, particularly in terms of timing resolution. Therefore, the Biograph mMR does not have time-of-flight (TOF) capability, which refers to the ability to measure the difference in the arrival times of the two photons very accurately (<1 ns) to estimate the position of the positron-electron annihilation along the line-of-response. Including the TOF information in the image reconstruction reduces the uncertainty in the localization of the site of annihilation from the whole line-of-response to a distribution around the true site with a Gaussian probability determined by the FWHM timing resolution. TOF imaging requires specialized reconstruction algorithms but offers improved signal-to-noise ratio in the resulting images.
Around the time the Biograph mMR was developed, a new type of photon detectors, called Geiger-mode APD (G-APD, also commonly known as silicon photomultipliers, SiPMs) were successfully tested for PET applications ( ; ). They have performance characteristics comparable to PMTs, including excellent timing performance and are not affected by magnetic fields. Similar to the early developments of PMT- and APD-based systems, several SiPM-based prototypes were initially developed for small animal imaging ( ). Eventually, General Electric Healthcare (Waukesha, WI, USA) introduced the Signa TOF PET/MRI, the first TOF whole-body integrated PET/MRI scanner. The PET detector gantry has transverse and axial fields-of-view of 60 and 25 cm, respectively. It was designed to fit between the body RF coil and the MRI gradient set of the GE Discovery 750w 3T MRI scanner and consists of five rings of 112 detector blocks (LYSO coupled to arrays of SiPMs). The PET component of the Signa TOF PET/MRI has radial, tangential, and axial spatial resolutions of 4.4, 4.1, and 5.3 mm FWHM, respectively, a peak noise-equivalent count rate of 218 kcps at 17.8 kBq/mL, scatter fraction is 43.6%, a sensitivity of 23.3 cps/kBq at the center of the field-of-view, while offering a timing resolution of <400 ps ( ). The GE Signa TOF PET/MRI system also received 510 K clearance and CE mark in 2014, with the first installations at Stanford University (Palo Alto, CA, USA), University of California at San Francisco (San Francisco, CA, USA), and University of Zurich (Zurich, Switzerland) in 2014.
Around 2017, United Imaging Healthcare (Shanghai, China) announced their combined uPMR 790 HD TOF PET/MRI system that integrates SiPM-based detectors with TOF capabilities into a 3T MR scanner. The PET detector gantry has transverse and axial fields-of-view of 60 and 32 cm, respectively. The PET detector system was designed to be installed between the gradient coil and radiofrequency body coil of the uMR 780 and the complete PET ring consists of 20 modules, each of them having 5 × 14 blocks with 14 blocks along the axial direction; individual blocks contain four SiPM detector channels coupled with a 7 × 8 array of 15.5 × 2.76 × 2.76 mm 3 LYSO crystals. The PET component of the uPMR 790 HD TOF PET/MRI has radial, tangential, and axial spatial resolutions of 2.72, 2.86, and 2.81 mm FWHM, respectively, a peak noise-equivalent count rate of 129.2 kcps at 14.7 kBq/mL, a scatter fraction of 37.9%, a sensitivity of 15.9 cps/kBq at the center of the field-of-view, and a timing resolution of 474 ps ( ). The uPMR 790 HD TOF PET/MRI scanner received FDA clearance in 2019.
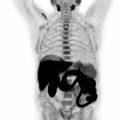
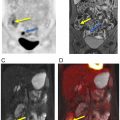
To summarize, Siemens, General Electric, and United Imaging are the three equipment manufacturers that currently offer fully integrated whole-body PET/MRI systems capable of acquiring data simultaneously ( Fig. 1.1 ). Table 1.1 summarizes the main technical and performance characteristics of these systems.
| Biograph mMR | Signa TOF PET/MR | uPMR 790 HD TOF PET/MR | |
|---|---|---|---|
| Vendor | Siemens healthineers | General electric healthcare | United imaging healthcare |
| Original MR scanner | Magnetom 3T Verio | Discovery MR750w 3T | uMR 780 3T |
| FDA clearance | 2011 | 2014 | 2019 |
| Spatial resolution (radial/tangential/axial @ FWHM) | 4.3/4.3/4.3 mm | 4.4/4.4/5.3 mm | 2.72/2.86/2.81 mm |
| Peak noise-equivalent count rate (NECR) | 184 kcps | 218 kcps | 129.2 kcps |
| Scatter fraction | 37.9% | 43.6% | 37.9% |
| Sensitivity | 15.0 cps/kBq | 23.3 cps/kBq | 15.9 cps/kBq |
| TOF capability | No | Yes | Yes |
| Timing resolution | 2.93 ns | <400 ps | 474 ps |
Traditional approaches to address challenges and enable opportunities
Attenuation correction
Annihilation photons have a high probability of interacting with the subject before reaching the PET detectors. Consequently, the number of detected photons is reduced or “attenuated” in a particular line-of-response. This leads to underestimation of the radiopharmaceutical concentration in structures located closer to the center of the body and to image artifacts. Relatedly, the annihilation photons can undergo Compton scattering but still reach the PET detectors. These scattered photons are assigned to different lines-of-response than the one passing through the point of positron annihilation, leading to loss of contrast ( ; ; ; ; ). Precise corrections for both physical phenomena are required to produce quantitative images that reflect the true distribution of the radiopharmaceutical and to reduce artifacts. The photon attenuation along each line-of-response can be estimated if the properties of the object are known ( ). However, this is challenging in integrated PET/MRI systems because no direct relation exists between tissue linear attenuation coefficients and MRI signal intensities ( ).
Head attenuation correction
Most of the early developments focused on solving this issue in the head and can be broadly classified in segmentation and atlas-based methods ( ; ). The former approaches were used to perform tissue estimation and classification into homogeneous classes ( ; ). The latter were used to generate detailed pseudo-CT maps (i.e., synthetic maps comparable to those obtained from CT). A variety of approaches have been proposed for this purpose such as image registration and pattern recognition techniques to match MRI and CT data ( ), atlas-based methods relying on nonrigid registration of a parametric atlas ( ), as well as enhanced methods based on nonrigid registration of a nonparametric multi-atlas followed by a label fusion step depending on patch similarity measures ( ; ; ).
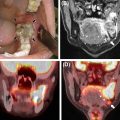
Eleven head attenuation map generation methods were evaluated in a multi-center setting using the data obtained from 337 brain PET/MRI and same day low dose CT studies. Globally, all the methods tested were on average within 5% of the CT-based reference, although there were differences in terms of robustness and presence of outliers. Four of the methods showed regional average errors in PET estimates within ±3% compared to those obtained using the reference method. The conclusion of the authors was that “the challenge of improving the accuracy of MR-[attenuation correction] in adult brains with normal anatomy has been solved to a quantitatively acceptable degree, which is smaller than the quantification reproducibility in PET imaging” ( Fig. 1.2 ) ( ).

Whole-body attenuation correction
Transitioning these approaches to other body regions was not straightforward. The greater intersubject variability (in terms of morphology, body mass index, pathology, sex, etc.) made it difficult to create a whole-body atlas that satisfactorily describes the entire population. Additionally, using atlases in the body entails a combination of rigid and nonrigid registration. Consequently, most of these approaches had inadequate performance when applied to whole-body attenuation correction ( ; ; ). Efforts have been made to tackle this challenge in specific regions of the body. For example, data obtained with multiple MRI sequences (Dixon and zero-echo-time, ZTE) were used to generate a pseudo-CT of the pelvis using a semiautomatic procedure ( ).
Using these aforementioned methods to generate attenuation maps of the thorax is even more challenging given the higher anatomical complexity and inherent cardiac and respiratory motion ( ). Furthermore, the attenuation properties of the lung vary both within and between subjects and are also influenced by the breathing phase, patient position, presence of pathologic changes, etc. Although continuous lung attenuation coefficients could be estimated from the MRI data ( ), the lung is assumed uniform in most of the MR-based approaches. Furthermore, respiratory and cardiac motion can lead to misalignments between the attenuation map and the emission data, resulting in improper PET data quantification. Potential mitigation strategies will be discussed in the MR-based motion correction section of this chapter.
Moreover, while the attenuation of all the body parts present in the PET field-of-view should be accounted for in the correction procedure, the arms (and even other body parts in the case of larger patients) are often truncated due the smaller transaxial field-of-view of the MRI scanner, which is often restricted to 50 cm to avoid image distortions. This leads to a 10%–25% underestimation of the PET measurements ( ). The truncated arms can be inferred using the maximum-likelihood reconstruction of attenuation and activity (MLAA) ( ) or using dedicated MRI sequences such as the B 0 homogenization using gradient enhancement (HUGE) ( ).
It should be also noted that metallic implants that cause susceptibility artifacts in the MRI images lead to distortions in the MR-based attenuation maps. These issues can be minimized by using specialized MRI sequences to image near metallic implants (e.g., MAVRIC or SEMAC sequences), recovering the lost signal by means of image postprocessing methods, or completing the attenuation map based on a joint estimation of emission and attenuation ( ; ).
There are other factors that need to be mentioned in the context of MR-based attenuation correction. For example, the radiofrequency MRI coils can also attenuate the 511 keV photons as they are positioned between the subject and the PET detectors. The equipment manufacturers redesigned the coils to minimize this issue and also provided attenuation maps for most of the coils. These “hardware” attenuation maps are automatically combined with the human maps in the attenuation correction procedure. MRI contrast agents can lead to minor tissue misclassification in the MR-based attenuation maps, but several studies showed they do not require special considerations in clinical studies ( ; ; ). Another issue that relates to scatter overcorrection in integrated PET/MRI scanners is the “halo” (or photopenic) artifact ( ; ) observed when there are large differences between the radiopharmaceutical concentration in a specific organ (e.g., urinary bladder, kidney) and the surrounding soft tissue. This issue was addressed by modifying the scatter correction algorithms ( ; ; ).
On the Siemens Biograph mMR scanner, the MRI data required for attenuation correction are currently acquired with a CAIPIRINHA-accelerated Dixon volumetric interpolated breath-hold examination (Dixon-VIBE) 3D sequence in 19 s per bed position. The in-phase, opposed-phase, water and fat images generated at each bed position are used to segment the body into four classes (i.e., background air, lung, fat and soft tissue). A predefined linear attenuation coefficient is assigned to each of these classes (0, 0.022, 0.085, 0.100 cm −1 , respectively). The continuous-valued bone information is added to the segmented attenuation maps by means of a model-based bone segmentation algorithm that incorporates a set of prealigned MRI image and bone mask pairs for each major body bone individually ( ). When required, the HUGE sequence combined with the continuous table motion allow the acquisition of the data required for estimating the body contour in 40–90 s. The Dixon- and HUGE-derived attenuation maps are registered using a landmark-based approach.
The impact of the methods provided by Siemens on the clinical data interpretation and quantification was extensively assessed. The head attenuation correction method was deemed clinically acceptable after the bone tissue misclassification was minimized using the model-based approach ( ). No differences in myocardial uptake between PET/CT and PET/MRI were observed in several studies ( ; ), while others reported underestimation of the myocardial uptake (i.e., up to 291% in the anterior wall) due to respiration-induced misalignment between the attenuation and emission data ( ). When the HUGE and MLAA-based approaches were used for truncation correction, the PET signal in the left ventricle increased compared to the values obtained using the Dixon-VIBE approach (5.4% ± 2.0% and 8.5% ± 3.4%, respectively) ( ). In the case of pulmonary malignant lesions, strong correlations between PET/CT and PET/MRI were reported particularly in lesions larger than 10 mm ( ; ). However, the maximum standardized uptake value (SUV max ) was significantly lower on PET/MRI than PET/CT for pulmonary tuberculosis lesions ( ) while the opposite was reported for breast cancer lung metastases ( ). While no statistically significant differences in SUV max , SUV mean or metabolic tumor volume were seen in primary breast cancer lesions, the values were 54% and 26% higher in the PET/MRI than the PET/CT measurements, respectively ( ). Strong correlation between the SUVs obtained from the PET data corrected using the 4-compartment attenuation correction method and the CT-based approach were reported in lymphoma patients ( ; ; ). Decreased SUV max were observed for PET/MRI versus PET/CT in gynecological malignancies when using the 4-compartment approach (21.5 ± 10.8 vs. 16.5 ± 7.1). Statistically significant higher SUVs were observed after including the bone in the attenuation map in prostatic lesions (12%) and normal prostatic tissue (8%) ( ). Statistically significant differences in SUV max (2.5%) between the two MR-based approaches were also reported in a different study in prostate cancer patients ( ). In bone lesions, a mean increase in SUV max of 5.4% ± 6.4% (range −4.3% to 28.4%) was observed when using the bone model and HUGE methods ( ).
The method implemented by GE for the Signa PET/MRI scanner uses the MRI data acquired with a liver acquisition with volume acceleration flexible (LAVA-Flex) sequence in 18 s. Continuous values in the 0.086–0.100 cm −1 range are assigned to the soft tissue voxels based on the water-fat images and 0.0180 cm −1 is assigned to lung voxels. Continuous-valued head attenuation maps are generated using an atlas-based approach from the LAVA-Flex or zero echo time (ZTE) data. The TOF nonattenuation corrected PET image is used to estimate the body contour for truncation correction ( ; ).
The PET values obtained using the head atlas-based method provided by GE were in good agreement with those obtained using the CT-based approach across the brain. The whole-brain FDG uptake was minimally underestimated (2.19% ± 1.40%), with larger relative changes observed in structures located in the cerebellum (3.69% ± 1.43%), and temporal lobe (3.25% ± 1.42%) ( ). Similar differences (4.5% ± 6.1%) were reported in subjects with cognitive impairment, with larger overestimations and underestimations close to the vertex and in the cerebellum ( ). Even more accurate results were obtained when using ZTE-derived bone masks ( ; ), particularly after methods were implemented to account for the intra- and intersubject variability in bone density, misclassification of teeth, and to minimize partial volume effects ( ; ; ). In the body, the Dixon-based method led to a minimal 2.08% underestimation of the myocardial tracer uptake that was reduced to 1.29% with the addition of TOF information ( ). In the pelvis, the reported root-mean-square error was 11.02% and 7.79% for bone and soft tissue lesions, respectively. These errors decreased to 3.28% and 3.94%, respectively, after incorporating the ZTE-derived bone information approach ( ).
Motion correction
Motion is caused by the inherent difficulty of the patient to stay still for the long periods of time required for acquiring a sufficient number of coincidence events, leading to voluntary or involuntary movements, and by physiological processes (i.e., deformation of the heart due to its contractile function, respiration-induced displacements of internal organs, deglutition, filling of the bladder, peristalsis, etc.). Motion results in blurring of the PET images that offset the benefit of using a high spatial resolution scanner, biased quantification, severe artifacts when it has large amplitude, and mismatches between the PET and MRI data.
The simultaneously acquired MRI data can be employed to derive high temporal resolution motion estimates that can be used for PET motion correction. For this purpose, the emission data are typically divided into short frames/bins that are minimally affected by motion. The MRI data are used to characterize the displacements of the organs of interest to the reference position for each of these motion-free frames. Various algorithms are next used to perform PET motion correction either before, during or after the image reconstruction. Although numerous PET-driven methods have also been proposed for estimating the motion ( ; ; ; ), only some of the MR-assisted approaches that have been implemented on the human PET/MRI scanners will be discussed in the next sections ( ; ; ).
Head motion correction
Brain imaging is primarily affected by the rigid-body motion of the head described by six degrees of freedom (i.e., three translations along and three rotations about the main axes). Although the head motion is limited by the MRI radiofrequency coils and the use of head restraints (e.g., cushions and pads) in integrated PET/MRI scanners, up to 20 mm translations and 4 degrees rotations can still occur during typical studies.
The first proof-of-principle MRI-assisted PET motion correction studies in humans were performed with the BrainPET prototype using the motion estimates extracted from simultaneously acquired echo planar imaging (EPI) series and embedded cloverleaf navigators ( ). In the first case, the individual EPI volumes were coregistered to the first one in the series that was used a reference. While sufficiently high temporal resolution motion estimates could be obtained, this approach is limited to EPI-based acquisitions and cannot be used when running nonanatomical sequences (i.e., such as those used for MR spectroscopy). In the second case, cloverleaf navigators with a duration of 4 ms, acquired every repetition time of a 3D-encoded fast low-angle shot (FLASH) sequence, yielded high temporal resolution motion estimates. In both cases, the motion estimates were used to transform the lines-of-response before PET image reconstruction. Substantially improved PET images were obtained after motion correction. An updated algorithm recently tested in dementia patients led to reduced blurring and improved data quantification, particularly in the group of subjects who exhibited the largest amplitude motion during the scan ( ).
Motion estimates can also be derived from EPI-based navigators acquired between other MRI sequences ( ) or directly from the data obtained with standard morphological MRI sequences ( ). Although these approaches require only minimal changes to the standard data acquisition protocols, the temporal resolution of the motion estimates is low and the intrasequence motion cannot be accounted for.
Respiratory motion correction
Whole-body PET imaging is affected by respiratory motion. During normal respiration, the diaphragm moves 7–28 mm in the superior-inferior direction, leading to displacements and deformations of the internal organs in the thorax and abdomen. Even the heart moves rigidly in the range of 4.9–9 mm during free breathing (the heart motion due to its contractile function will be discussed in the next subsection). Despite the apparent periodicity of the respiration, the thoracic organs follow different paths during inspiration and expiration, which makes respiration even more challenging to model. Additionally, the ranges mentioned above considerably increase during deep inspiration. The respiratory motion can be mitigated by using gating, but at the cost of increased noise in the reconstructed images or increased acquisition times to counteract the signal-to-noise ratio loss.
In the early MR-assisted PET motion correction approaches, the use of motion estimates derived from 2D and 3D MRI sequences for respiratory motion compensation was demonstrated using simulated PET data ( ; ), and in phantom studies ( ; ). Subsequently, motion estimates were derived from tagged MRI data ( ). Tagged MRI enforces a spatially periodic magnetization pattern (tags) prior to the image acquisition; after the tagging pulses, the magnetization pattern is maintained over a specific time and its motion-related deformations can be assessed. Subsequent methods combined 2D multislice MRI data and navigators to extract motion estimates and demonstrated significant improvements in terms of lesion delineation and uptake quantification in oncologic whole-body PET/MRI, while being time-efficient for routine use ( ).
In order to increase the clinical applicability of these methods, the focus has shifted on developing techniques that neither increase the overall MRI acquisition time nor decrease the clinical diagnostic quality of the MRI images. For example, the motion can be estimated jointly during the MRI image reconstruction using a generalized reconstruction by inversion of coupled systems approach and the resulting deformation matrices in the PET respiratory motion correction process ( ). Novel approaches based on radial stack-of-stars MRI spoiled gradient echo sequence (radial-VIBE) were assessed for motion correction of PET images ( ). Artifact resistant methods (i.e., compressed sensing) needed to be applied in the reconstruction process ( ) to minimize the streak artifacts due to the azimuthal undersampling of the radial k-space data. Alternatively, a joint PET/MRI respiratory motion model can be obtained from 1 min of PET data per bed position and dynamic 2D multi-slice MRI data ( ).
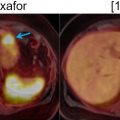
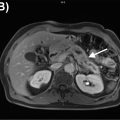
Recent studies have demonstrated that respiratory motion correction significantly reduces blurring and improves lesion localization and visibility, noise ratings, and SUV estimation in thoracic 18 F-FDG PET/MRI compared to uncorrected or gated PET images. This was shown to benefit the detection of small pulmonary nodules ( ), as well as the assessment of non–small-cell lung carcinoma, bronchial carcinoma, adenoid cystic carcinoma, lymphadenopathy, relapsed mammary carcinoma, or adenocarcinoma ( ). The clinical impact of respiratory motion correction on the assessment of lesions in the liver, pancreas, lungs, abdominal nodes, thoracic nodes, kidneys, bowel, ribs or shoulders was also investigated ( ). The reduced blurring, improved quantification and better detection of 18 F-FDG and 68 Ga-DOTATATE avid lesions suggest that motion correction has potential clinical benefits ( Fig. 1.3 ) ( ).

Cardio-respiratory heart motion correction
As opposed to its rigid-body displacement due to respiration, the pumping function of the heart leads to nonrigid deformations, with the heart base moving in the range of 9–14 mm toward the apex, and its myocardial walls thickening from ∼10 mm to more than 15 mm. ECG gating can be used to mitigate cardiac motion but it has similar drawbacks as respiratory gating.
Early cardio-respiratory motion correction approaches evaluated tagged MRI in a cardiac phantom and patients ( ). However, 3D MRI tagging is a time-consuming method not routinely used clinically. Several methods relied on specifically designed MRI protocols to account for motion during the examination ( ; ; ). As the resulting images lacked the soft tissue contrast and/or spatial resolution required for diagnostic purposes, the inclusion of these additional sequences for the sole purpose of estimating motion increased the examination times. Alternatively, motion estimates can be extracted from retrospectively binned free-breathing 3D MRI data acquired using a radial stack-of-stars ( ; ) or from image-navigators ( ). The high spatial resolution 3D structural data and extremely precise nonrigid motion estimates led to substantially improved MRI and PET image quality. Additionally, joint cardiac and respiratory motion estimation approaches that combine complementary dynamic information derived from simultaneously acquired MRI and PET through a joint image registration scheme have been proposed ( ).
Recent studies demonstrated cardio-respiratory motion correction of 18 F-FDG PET data results in improved spatial resolution, with less blurring, and improved contrast-to-noise-ratios, while the radiopharmaceutical uptake is qualitatively aligned better with the underlying myocardial anatomy when fused with the MRI images ( ). These improvements have been noted not only in the static PET images, but also in dynamic studies, where parametric images estimated employing motion correction approaches led to improved spatial resolution, and higher values in the myocardium ( ). The increase in overall spatial resolution in the PET and MRI images improved the delineation of myocardial viability defects and reduced noise when assessing motion corrected PET images, as well as improved visible vessel length and sharpness in the anatomical coronary MRI angiography images ( ). Motion correction approaches have exhibited similar improvements when identifying vulnerable plaques in coronary atherosclerosis imaging using 18 F-NaF, directly affecting the overall image quality and demonstrating a direct impact in sensibility and estimation of the width of focal tracer hotspots in the coronary system ( ).
Bulk motion correction
Bulk patient motion relates to changes in the patient’s position during the data acquisition, leading to non-rigid body changes of the patient’s anatomy. Consequently, the overall quality of the acquired data can be severely compromised, causing blurring, biasing the PET estimates, attenuation-emission data mismatches and directly impacting the diagnostic value of the PET images.
Most of the methods presented in the previous subsections assume that motion is periodic and, thus, are not suitable for bulk motion correction. Instead, motion estimates can be extracted from 3D MR images acquired following a radial encoding ( ) or from reconstructed dynamic MR images ( ).
The integrated PET/MRI equipment manufacturers started to include their own approaches for motion estimation and correction in their scanners. Siemens provides MR-based motion compensation through their BrainCOMPASS and BodyCOMPASS methods, in which patient motion estimates are derived from real-time navigators in fMRI scans and from the 3D T1 VIBE radial sequences, respectively. The GE QuantWorks includes a comprehensive motion correction package to reduce the effects of involuntary and physiological motion, including PROPELLER, PROMO and Pencil Beam Navigator. United Imaging provides the uSync platform (only for research purposes) delivering simultaneous encoding of MRI data, list-mode PET data, and physiological data into the same raw data stream, providing with space-time harmonization.
Image enhancement
The spatial resolution of PET is inferior to that of other imaging modalities (e.g., MR, CT) due to factors related to the positron emission and annihilation, the technology used to detect the annihilation photons, and the image reconstruction algorithms. The resulting blurring combined with the image sampling contribute to the partial volume effects that bias the PET measurements. Consequently, most voxels include different types of tissues, and the PET measurements in each voxel are averages of the true PET measurements in each tissue type. Large biases are present when the radiopharmaceutical uptake is assessed in small tumors ( ; ), gray matter, coronary arteries, etc. Image enhancement methods that rely on the higher spatial resolution morphological MRI data could solve these limitations in integrated PET/MRI scanners.
Even before the advent of integrated PET/MRI, partial volume effects correction techniques were developed to “recover” the PET estimates by using the anatomical MRI images, under the assumption that the radiopharmaceutical distribution is associated with the underlying anatomy. The correction was performed either postimage reconstruction or, more elegantly, the anatomical information was incorporated as a prior in the image reconstruction ( ; ; ; ). Most of these methods included the anatomical information into the PET reconstruction model using a penalized likelihood framework and demonstrated superior quantitative accuracy when compared to conventional PET reconstruction methods. More complex approaches utilized event-driven motion compensation algorithms to extract motion estimates from both PET and MRI images, to obtain a reliable estimate of activity that takes into account its relationship to the underlying anatomy ( ).
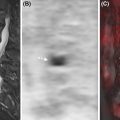
A joint reconstruction framework that exploits the structural similarity between the two modalities was used to reconstruct images from blurred Radon PET data with Poisson noise and undersampled Fourier MRI data with Gaussian noise. The resulting PET and MRI images had fewer artifacts and sharper edges compared to those obtained using the separate reconstructions ( ). Side information from an MR-based features kernel matrix was integrated into anatomically aided brain PET data reconstruction ( ). Alternatively the MRI information can be incorporated using a joint patch-based dictionary prior ( ), or a compressed sensing joint PET/MRI reconstruction ( ). To further enhance the image quality, cardiac motion correction and anatomy guided reconstruction can even be combined in a single PET/MRI image reconstruction framework ( Fig. 1.4 ) ( ).