Physics of Ultrasound
A comprehensive review of the physics used in ultrasonography is beyond the scope of this text. Despite this, some understanding of the basic physics used in ultrasound is needed for optimal creation and interpretation of an ultrasound image. Ultrasound images are created by reflected sound waves returning back to the transducer. The nature of the image is based on the properties of different tissues in the body. There are a number of factors that influence this process.
PIEZOELECTRIC EFFECT
Piezoelectricity was first discovered by Pierre and Jacques Curie in 1880 using natural quartz. Ultrasound machines use the piezoelectric effect to generate an image. The piezoelectric effect refers to the creation of electrical energy by applying another energy (pressure) to a crystal. The word piezo is derived from the Greek word that means pressure. In the case of ultrasound, this is defined by the generation of sound waves emitted from the transducer crystals when precise electrical charges are applied to make them vibrate. The sound waves given off by the transducer is also known as the pulse. This process is known as the reverse (or inverse) piezoelectric effect. The direct piezoelectric effect occurs when the electrical potentials are created by the effect on the crystals from the sound waves returning to the transducer from the tissue. This is also known as the echo. The distinct pattern of electrical charges, given off by returning sound waves, is used to create the image on the ultrasound screen.
SOUND WAVES
Frequency
Frequency of the sound wave is measured in cycles per second or Hertz (Hz).
By definition, sound waves greater than 20,000 Hz are in the ultrasonic range. They are considered ultrasonic because they are outside of the normal human range of hearing, which is 20 to 20,000 Hz. The frequency used in medical ultrasound imaging is generally 2 to 15 megahertz (MHz). The range for most superficial musculoskeletal applications is at the higher end of this, generally 8 to 15 MHz.
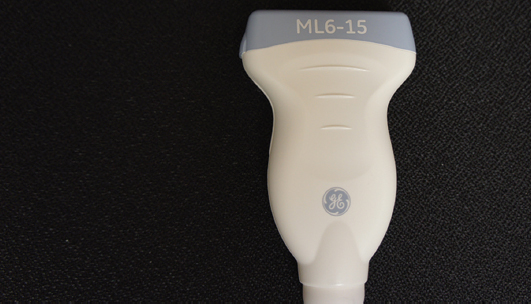
The frequency of the emitted sound wave is controlled by the design of the transducer (Figure 2.1). Most transducers are described by the range they are capable of emitting. This range is termed the bandwidth of the transducer. Transducers that have more than one range of operating frequencies are called broad bandwidth transducers.
Image optimization requires attention to frequency. Lower frequency sound waves penetrate more deeply and therefore, can provide better clarity of a deeper structure (Figure 2.2). By contrast, higher frequency sound waves do not penetrate tissue as well but provide higher resolution of a more superficial structure (Figure 2.3).
Attenuation
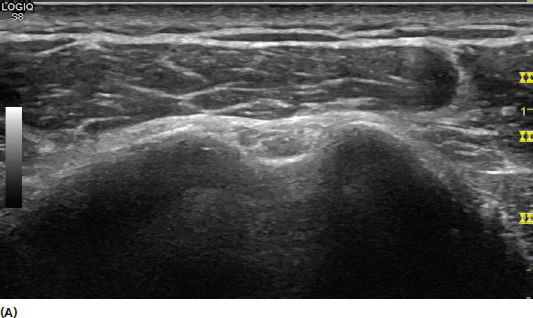
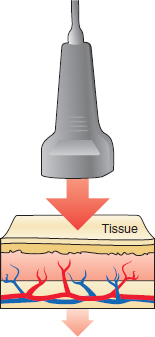
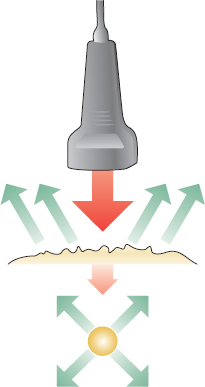
As sound waves travel through tissue, there is a progressive reduction in the intensity of the wave. This process is known as attenuation (Figure 2.4). Note that over a given distance, higher frequency sound waves generally have more attenuation than lower frequency waves. The attenuation occurs as a result of three processes: reflection, refraction, and absorption. The property of the degree of sound wave attenuation in specific tissue is known as that tissue’s attenuation coefficient.
FIGURE 2.1 Picture of a linear broadband transducer.
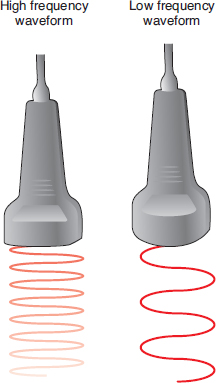
FIGURE 2.2 Illustration demonstrating the difference between high-frequency and low-frequency ultrasonic waveforms. Note that the low-frequency waveform penetrates deeper in the same tissue. High-frequency waveforms provide better resolution of more superficial tissue.
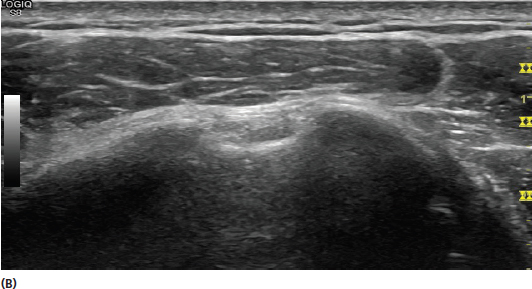
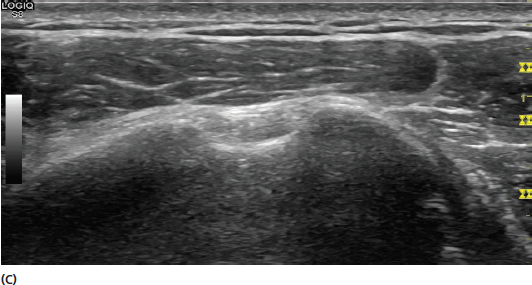
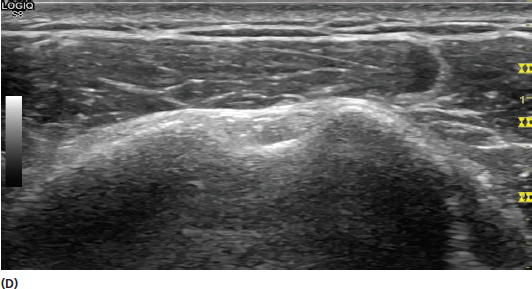
FIGURE 2.3 Sonograms demonstrating the effect of incident sound wave frequency changes on the appearance of the image. The frequencies shown are at (A) 15 MHz, (B) 12 MHz, (C) 9 MHz, and (D) 8 MHz. Although the differences might appear relatively minimal, there is a better resolution of the superficial structures at the higher frequencies and better penetration of the sound waves at the lower frequencies.
FIGURE 2.4 Illustration demonstrating attenuation of the incident sound waves (red arrow) as it travels through tissue. The continuing propagating sound wave is smaller due to the reflection, refraction, and absorption of portions of the incident sound wave.
Reflection
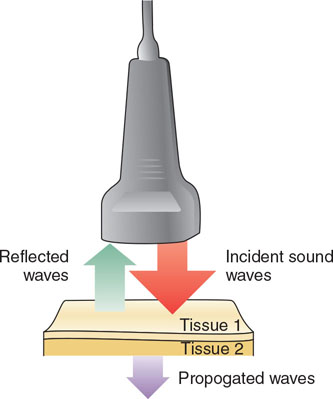
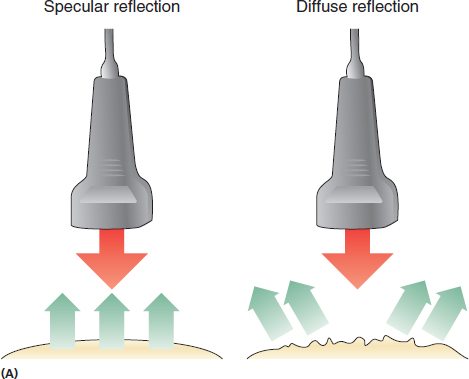
Reflection in ultrasound refers to the return of the sound wave energy back to the transducer. This principle is what allows the image to be generated by the ultrasound machine. Generally, more reflection results in a more hyperechoic (brighter) image. Reflection occurs at tissue boundaries where the tissues on either side of the boundaries have differences in acoustic impedance (Figure 2.5). Larger differences in these acoustic impendences, therefore, result in more reflection. The reflection can be considered either specular or diffuse. Specular reflection occurs when the sound waves encounter large smooth surfaces such as bone, which results in the sound waves being reflected back in a relatively uniform direction. The cells of most soft tissue create a more diffuse pattern of reflection to the transducer (Figure 2.6).
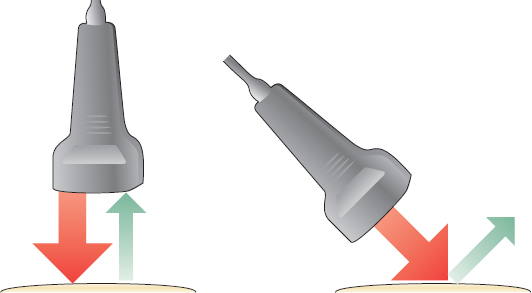
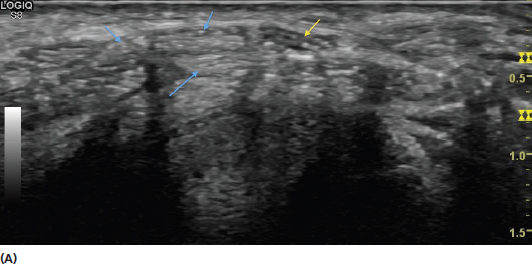
The angle of incidence of the entering sound wave is also critical to the amount of reflection back to the transducer (Figure 2.7). The angle of incidence refers to the angle of deviation from a perpendicular line to the surface of the tissue. Therefore, the desired orthogonal incident wave in ultrasound should be considered to have an angle of incidence of zero. When the angle of incidence is greater, fewer sound waves are reflected back to the transducer resulting in a more hypoechoic (darker) image with less clarity. The optimal reflection with the most sound waves occurs when the angle of incidence approaches zero and is virtually perpendicular (orthogonal) to the tissue of interest. An incident sound wave approach that deviates from perpendicular to the tissue (ie, angle of incidence less than 0°) results in an artifact known as anisotropy, which is discussed in more detail in (Figure 2.8).
FIGURE 2.5 Illustration demonstrating reflection. A portion of the incident sound waves (red arrow) are reflected back to the transducer (green arrow) after striking tissue types with different impedance. A portion of the incident sound waves continues to propagate through the tissue (purple arrow).
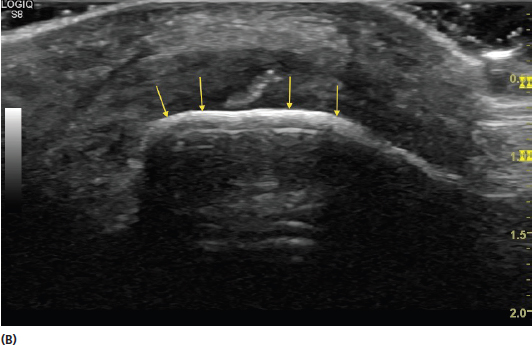
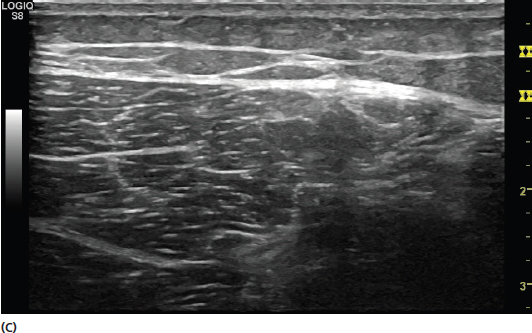
FIGURE 2.6 (A) Illustration of specular versus diffuse reflection. The smooth surface in specular reflection results in more return of the reflected sound waves to the transducer (green arrows) creating a more hyperechoic (brighter) image. The less uniform tissue in diffuse reflection results in less return of the reflected sound waves and a more hypoechoic (darker) image. (B) Sonogram showing the appearance of specular reflection. Note that the large smooth surface of the bone (yellow arrows) leads to a bright signal due to the significant impedance difference between it and the surrounding tissue. (C) Sonogram showing the appearance of more diffuse reflection in muscle tissue. Note that the smaller differences in acoustic impedance reflect various shades of gray rather than the bright signal noted with the interface of bone.
FIGURE 2.7 Illustration demonstrating the effect of the angle of incidence of the sound beam. Note that an angle of incidence that is perpendicular (ie, 0 degrees) (illustration on the left) to a smooth interface results in the largest amount of sound waves returning to the transducer. This transducer position helps create an optimum image. An incident wave hitting the interface at an angle of incidence greater than 0 degrees (ie, less than perpendicular) will result in the wave being deflected away from the transducer at an angle equal to the angle of incidence in the opposite direction (illustration on the right). In this circumstance, the signal of the returning echo is weakened creating a darker image (anisotropic artifact).
Refraction
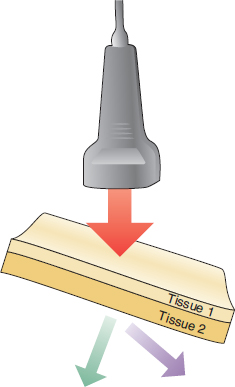
Refraction occurs when the incident sound wave contacts the boundary of tissues at an oblique angle. This causes the reflected sound beam to travel in a direction that is away from the transducer (Figure 2.9). Refraction, therefore, results in a loss of the propagated signal. The conventional settings on the ultrasound instrumentation calculate the returning waves as though they are traveling in a straight line. This leads to a loss of image clarity as the refraction increases.
The direction of the refracted sound waves is predicted by Snell’s law (Sin θi/Vi = Sin θr/Vr). This states that the magnitude of the refraction is directly proportional to the angle of incidence and the difference in velocity of the sound waves within the two tissue types. The relationship of the velocity characteristics of the different tissues also impacts the direction of refraction. If the propagating sound wave is faster in the first tissue because of less tissue impedance, the refraction will be more perpendicular. If the impedance is less in the second tissue with resultant faster sound wave propagation, refraction occurs away from the original direction (Figure 2.9).
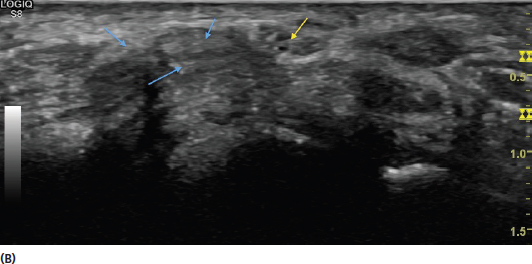
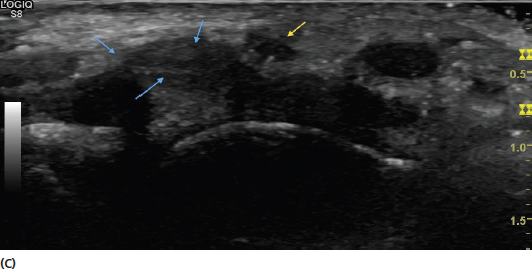
FIGURE 2.8 Sonograms demonstrating the effect of anisotropic artifact on the image. The median nerve (yellow arrow) is shown in proximity to surrounding flexor tendons (blue arrows). In (A), the incident sound beam is close to orthogonal creating a clear image. In (B), there is an increased angle of incidence resulting in less clarity (anisotropic artifact). In (C), the angle of incidence is much greater resulting in more extreme anisotropic artifact with darkening of the structures.
FIGURE 2.9 Illustration demonstrating refraction. Refraction is the alteration of direction of the sound wave after it strikes the interface of different tissue with different impedances. If the sound wave propagation velocity is faster in the first tissue (less impedance in tissue 1) then the refraction occurs toward the center (perpendicular to the interface) (green arrow). If the velocity is greater in the second tissue (less impedance in tissue 2) then the refraction is away from the incident beam (purple arrow).
Absorption
Another source of attenuation of the propagating sound wave is through absorption. This occurs when the sound wave energy is given off as heat. As a result, none of this energy returns to the transducer to contribute to the creation of the signal.
Scatter
Scatter refers to the propagation of incident sound waves in oblique directions. This occurs when the tissue being observed is not completely heterogeneous or has rough edges (Figure 2.10). The return of these obliquely propagated sound waves is termed backscatter. The random image pattern created by backscatter is termed speckle.
FIGURE 2.10 Illustration demonstrating principles of scatter. Scatter occurs when the incident sound wave (large red arrow) strikes on irregular or nonhomogeneous surface. Portions of the sound waves are scattered randomly, whereas the remainder continues on as a propagating wave (small red arrow). Scatter can also occur when the propagating wave strikes a smaller object such as a red blood cell.
Harmonic Frequency
Because of the varying characteristics and properties of tissue, ultrasonic waves can be produced which are not entirely linear. The return of this nonlinear propagation to the transducers produces a pattern distinct from the more linear return echo. These waves are called harmonic frequency waves. These waves are of generally higher frequency than the original sound waves. In some circumstances, the harmonic frequency waves can be evaluated and it can provide an image that has fewer artifacts than the primary propagated wave. This is particularly useful with tissue that has significantly contrasting density.
TISSUE PROPERTIES
Speed of Sound Waves
The speed of sound wave transmission is affected by the properties of the medium in which it is traveling. Sound waves generally travel more slowly in gas mediums, faster in fluids, and fastest in solid material. Ultrasound waves travel through most human tissue at a speed of 1,540 m/s. Ultrasound instruments use this speed for timing the returning echoes to calculate the depth of tissue and constructing images.
Acoustic Impedance
Acoustic impedance refers to a tissue’s property that allows propagation of sound waves. Higher acoustic impedance of the tissue results in less propagation of the sound wave. The amount of the sound energy reflected back to the transducer is directly proportional to the difference in acoustic impedance between tissues. Tissue interfaces with a larger difference in acoustic impedance will result in a larger amount of sound energy reflected back to the transducer. This results in the production of a brighter (hyperechoic) signal. An example of this is muscle tissue with relatively low acoustic impedance, next to bone tissue with very high acoustic impedance. The resultant reflection from this interface produces a very bright (hyperechoic) signal (Figure 2.11).
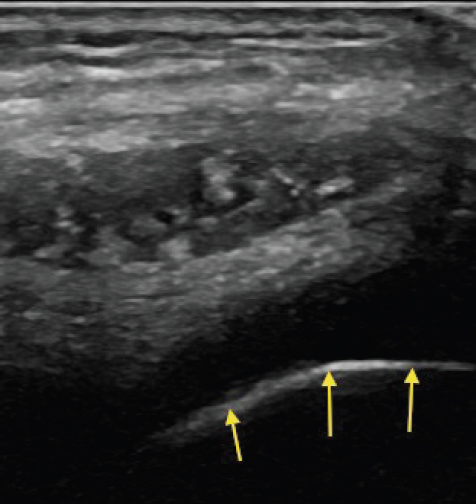
FIGURE 2.11 Sonogram demonstrating the bright signal characteristics from a location with a large difference in tissue impedance. The hyperechoic (bright) signal is seen with relatively low-impedance tissue next to high-impedance bone.
REMEMBER 
1) High-frequency sound waves help provide higher resolution images of relatively superficial structures but low-frequency sound waves have better penetration of deeper tissue.
2) Keep the incident sound waves as close to perpendicular to the tissue under evaluation as possible to allow most of the sound waves to return back to the transducer and therefore, produce best visualization.
3) Reflection of sound waves back from the tissues with the largest difference in impedance provides the most hyperechoic (brightest) signals. Bone has a very high impedance and appears hyperechoic on ultrasound.
Stay updated, free articles. Join our Telegram channel

Full access? Get Clinical Tree


