Fig. 6.1
Experimental reflection scanning optical microscope with differential polarization-gating mechanism. A aperture, B beamsplitter, DT detector, L lens, LP polariser, O objective, P pinhole. Reprinted with permission from [1], 1998, Optical Society of America
Four types of polystyrene microspheres suspended in water were respectively used as scattering particles in a turbid medium. The detailed scattering parameters for the four types of microspheres are given in Table 2.1. A number of samples are prepared for each type of polystyrene microspheres. The samples produced with each polystyrene microsphere size are grouped into sample sets A–D and their details are listed in Table 6.1. The range of the microsphere sizes chosen is consistent with that of the scattering particles in real biological samples which do not include large scatterers (>1 μm) [6, 8].
Table 6.1
Parameters for the sample sets used in the reflection scanning optical microscope
Sample set | Scattering medium | Cell thickness, d (μm) | SMFP length, l s (μm) | Anisotropy value, g | Optical thickness, n (2d/l s) |
|---|---|---|---|---|---|
A | 0.107 μm polysty. microsph. in water | 100–600 | 416.4a | 0.076a | 0.5–2.8 |
B | 0.202 μm polysty. microsph. in water | 100–600 | 70.2a | 0.31a | 2.8–17.1 |
C | 0.48 μm polysty. microsph. in water | 25–300 | 19.2a | 0.81a | 2.6–31.3 |
D | 1.053 μm polytsy. microsph. in water | 25–300 | 10.8a | 0.92a | 4.6–55.6 |
E | Semi-skimmed milk | 50–300 | 30b | <0.4c | 3.3–20 |
Since real tissue-like samples consist of scatterers of different sizes, it is important to demonstrate the effect of the polarization-gating mechanisms on image quality in such a turbid medium. To demonstrate image quality in a more realistic turbid medium a sample set of semi-skimmed milk is prepared (i.e. sample set E in Table 6.1). Semi-skimmed milk (fat content 3.6 %) is chosen since it does not include large scatterers (>1 μm), and has been used in transillumination imaging to simulate tissues which do not include large scatterers (>1 μm) [6, 8]. If the tissue includes large scatterers, polarization-gating may not be efficient as large scatterers (high anisotropy value, g) result in high forward scattering without appreciably changing the degree of polarization, γ, of the incident beam. The size of scattering particles in the milk suspension is approximately in a range of 0.1–1 μm, which is similar to that used in the case of polystyrene microspheres (samples sets A–D). According to Beer’s law , the scattering mean free path length, l s, of the semi skimmed milk was measured to be approximately 30 μm (see Fig. 5.1b). The anisotropy value, g, for the semi-skimmed milk suspension is assumed from the literature [9].
Each type of polystyrene microsphere is placed in a glass cell with lateral dimensions of 2 cm × 1 cm. The thickness of the glass cell, d, can be varied between 25 and 600 μm, producing an optical thickness of a turbid sample, n = 2d/l s, for the reflection microscope. It should be noted that the maximum optical thickness , n, achievable for a given turbid medium set is determined by the working distance of the imaging objective O2 used. To qualitatively demonstrate the image performance of polarization-gating, a selected set of six samples are imaged in the experiments. The detailed parameters of the six samples (numbered 1–6) are illustrated in Table 6.2.
Table 6.2
Parameters for the specific samples used in the reflection scanning optical microscope
Sample number | Scattering medium | Cell thickness, d (μm) | SMPF length, l s (μm) | Anisotropy value, g | Optical thickness, n (2d/l s) |
|---|---|---|---|---|---|
1 | Distilled water | 100 | – | – | – |
2 | 0.107 μm polysty. microsph. in water | 600 | 416.4a | 0.076a | 2.8 |
3 | 0.202 μm polysty. microsph. in water | 100 | 70.2a | 0.31a | 2.8 |
4 | Semi-skimmed milk | 100 | 30b | <0.4c | 6.7 |
5 | Semi-skimmed milk | 300 | 30b | <0.4c | 20 |
6 | 1.056 μm polysty. microsph. in water | 100 | 10.8a | 0.92a | 18.5 |
It should be pointed out that the value of the optical thickness, n, can be altered by changing either the geometric cell thickness, d, of a sample or the concentration of scatterers or both. For a given scatterer size, the time-averaged angular distribution of scattered photons is dependent only on the value of the optical thickness, n, although their spatial distribution is determined by both the optical thickness, n, and the scattering mean free path length, l s [10]. The spatial distribution of scattered photons together with a finite-sized detector and the collection objective used in this experimental investigation introduces additional gating. As a result, increasing the geometric thickness, d, of a turbid medium affects the image resolution more appreciably than increasing the concentration of scatterers. In addition, increasing the sample thickness, d, is more realistic since it represents an increase in the penetration depth for a biological sample.
For the evaluation of image quality, a 48-μm wide metallic reflective bar (reflectivity ≈ 70 % at λ = 632.8 nm) is embedded within one of the turbid media described in Table 6.1. Prepared samples are mounted onto a three-dimensional translation stage and the sample cell is scanned along the x-direction with the focus of the imaging objective O2 on the surface of the bar. Transverse resolution of the scanned bar image, α, is defined as the distance between the 10 and 90 % intensity points, measured from the responses after they are fitted by using a symmetric-double-sigmoidal (SDS) method. This definition of resolution is consistent with that used in the Monte Carlo simulation discussed in Sect. 5.4.
The transverse resolution of the bar image, α, and the degree of polarization, γ, for sample1 is 0.7 μm and 99.9 %, respectively, for an imaging objective, O2, of NA 0.75. The image in this case is constructed purely by unscattered photons obeying the diffraction theory of light and therefore demonstrates the maximum image resolution achievable in the experimental arrangement.
6.2.2 Effect of the Optical Thickness and Scatterer Size on Resolution
Figure 6.2a–c show typical images of a 48 μm bar embedded in sample2 with scatterers of diameter 0.107 μm (see Table 6.2) when CPG, PPG and DPG techniques are employed, respectively. It can be seen that the image constructed by DPG (Fig. 6.2c) has more detail when compared with the image constructed by CPG (Fig. 6.2a), which implies the effectiveness of DPG over CPG in suppressing scattered photons. It should also be noted that an image can be constructed with mainly scattered photons (Fig. 6.2b), although its resolution is lower than that of the images formed with CPG and DPG techniques. This feature is illustrated more clearly in Fig. 6.2d which shows typical edge responses (at the position marked by ‘A’) of the embedded bar and corresponding fitted SDS curves recorded with CPG (I p), PPG (I s) and DPG (I p−s), for the images illustrated in Fig. 6.2a–c), respectively. The measured transverse resolution, α, for CPG (α p), perpendicular polarization-gating (α s) and differential polarization-gating (α p−s) techniques was 6.7, 9.2 and 4.0 μm, respectively. These results demonstrate that once a photon is scattered, it can only contribute to an image with resolution lower than the diffraction limited resolution.
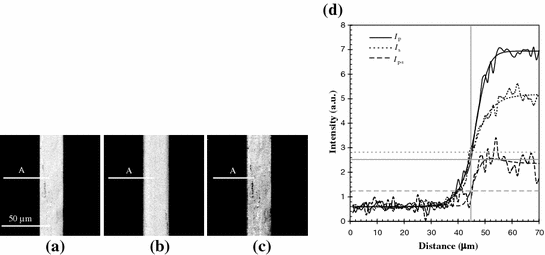

Fig. 6.2
Measured images for sample2 (Table 6.2) when CPG (a), PPG (b), and DPG (c) techniques are employed. The intensity of the images is normalized to unity. d Includes the measured edge responses corresponding to CPG (Ι p), PPG (Ι s), and DPG (Ι p−s) techniques. The horizontal gray lines represent the intensity for I p (solid), I s (dot) and I p−s (dashed), at the bar edge position indicated by the vertical gray line. The NA of the imaging objective is 0.25. Reprinted with permission from [2], 1998, Elsevier
The measured transverse resolution as a function of the optical thickness, n, for sample set A with scatterers of diameter 0.107 μm (see Table 6.1) using imaging objectives with NA = 0.25 and NA = 0.75 is illustrated in Fig. 6.3a, b, respectively, for no-gating (NG), (α p+s), CPG (α p), PPG (α s), and DPG (α p−s) techniques. It is evident from Fig. 6.3a, b that using CPG (α p) is better than NG (α p+s) and that DPG (α p−s) is superior to CPG (α p).
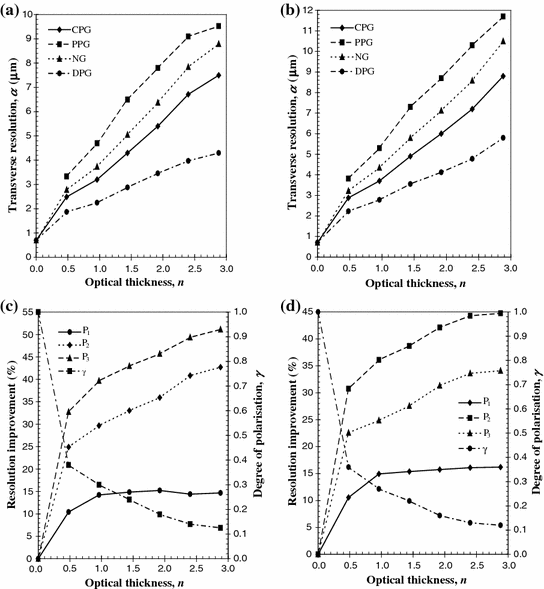

Fig. 6.3
Resolution performance for sample set A at NA = 0.25 (a) and (c) and NA = 0.75 (b) and (d). a and b Measured transverse resolution as a function of the optical thickness, n, for NG (α p+s), CPG (α p), PPG (α s) and DPG (α p−s). c and d Resolution improvement and the degree of polarization, γ, as a function of the optical thickness, n. A comparison is given between CPG and NG (P 1), DPG and NG (P 2), and DPG and CPG (P 3). Reprinted with permission from [2], 1998, Elsevier
According to diffraction theory [11], the image intensity at a sharp edge is 1/3 and 1/2 of the intensity far from the edge for partially coherent and incoherent imaging processes, respectively. In the case of CPG, the image is constructed mainly by unscattered photons and imaging is therefore partially coherent due to the use of a large area detector [11]. As a result, the image intensity at the edge is close to 1/3 of the intensity far from the edge (see the horizontal gray solid line in Fig. 6.2d). For PPG, the image is constructed by scattered photons (i.e., the incoherent component) and thus the intensity at the edge is close to 1/2 of the maximum intensity. In the DPG process, the unscattered component of the intensity is dominant due to the subtraction of the scattered photon component and therefore the intensity at the edge for DPG is close to 1/3 of the intensity far from the edge (see the horizontal gray dashed line in Fig. 6.2d). These three intensity points have been marked at the edge position represented by the vertical gray solid line in Fig. 6.2d.
To help illustrate the improvement in transverse resolution achieved with the implementation of a particular polarization-gating method, we introduce the following three improvement parameters. The improvement in transverse resolution between CPG (α p) and NG (α p+s) is defined as

the improvement in transverse resolution between DPG (α p−s) and NG (α p+s) is defined as

and the improvement in transverse resolution between CPG (α p) and DPG (α p−s) is defined as

where n is the optical thickness.

(6.1)

(6.2)

(6.3)
The improvement in resolution is illustrated more clearly in Fig. 6.3c, d, which shows the percentage improvement in transverse resolution between CPG and NG (P 1), DPG and NG (P 2), and DPG and CPG (P 3). It is clearly seen from Fig. 6.3c, d that the improvement in resolution becomes large as the optical thickness, n, is increased. DPG has a strong effect when applied to this turbid medium because scattered photons are depolarized fast when the optical thickness, n, increases, as shown by the degree of polarization , γ (Fig. 6.3c, d), and also because there is still a significant proportion of unscattered light detectable (i.e., the optical thickness, n, is small). The reason for the higher improvement in resolution and a higher degree of polarization, γ, for, NA = 0.25, compared with those for NA = 0.75, is due to the stronger suppression of multiply scattered photons when the acceptance angle of an imaging objective is reduced (see Fig. 5.17). However, a higher NA imaging objective may be more effective for DPG, in terms of the percentage improvement in transverse resolution, when the optical thickness, n, is large and/or when the depolarization of each scattering event is weak. This effect will be discussed in more detail in Sect. 6.2.4.
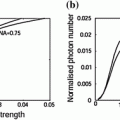
Figure 6.5a illustrates the measured transverse resolution as a function of the optical thickness , n, for NG (α p+s), CPG (α p), PPG (α s), and DPG (α p−s) techniques when sample set B with scatterers of diameter 0.202 μm (see Table 6.1) and an imaging objective of NA 0.75 is used. It is evident from Fig. 6.5a, and has already been seen in Fig. 6.3a, b, that DPG (α p−s) is superior to NG (α p+s) and CPG (α p). This improvement is illustrated more clearly in Fig. 6.5b, which shows the percentage improvement in transverse resolution between CPG and NG (P 1), DPG and NG (P 2), and DPG and CPG (P 3). A comparison of Figs. 6.3d and 6.5b shows that the improvement in transverse resolution between DPG and NG (P 2), in the latter case increases with the optical thickness, n (i.e., no steady-state value is reached). This phenomenon is because the depolarization of scattered photons in Fig. 6.5b is slower than that in Fig. 6.3d, when the optical thickness, n, increases, due to the larger anisotropy value, g, for the former case.
Images of an embedded bar in sample3 with scatterers of diameter 0.202 μm (the optical thickness, n, for this sample is equivalent to the images of sample2 (see Table 6.2 and Fig. 6.2) are shown in Fig. 6.4a–c for CPG, PPG, and DPG, respectively. A comparison of Figs. 6.2 and 6.4 demonstrates that the resolution for the latter case is significantly poorer, which is indicated by the lack of detail, by smearing and by noise. The degradation in resolution is first due to the increase in forward propagation of the scattered photons as a result of the larger anisotropy value , g, and secondly due to the collection of more scattered photons as a result of the larger NA (see Fig. 5.17).
Let us turn to sample set C with scatterers of diameter 0.48 μm. Under the same experimental condition as Figs. 6.3b, d and 6.5, transverse resolution as a function of the optical thickness, n, for NG (α p+s), CPG (α p), PPG (α s), and DPG (α p−s) techniques is shown in Fig. 6.6a. It can be seen from Fig. 6.6a that DPG (α p−s) is superior to NG (α p+s) and CPG (α p) only when the optical thickness, n, is less than 30. This property is illustrated more clearly in Fig. 6.6b, which shows the percentage of improvement in resolution between CPG and NG (P 1), DPG and NG (P 2), and DPG and CPG (P 3). It is noted from Fig. 6.6b that the resolution improvement by using any polarization-gating method becomes weaker as the optical thickness, n, becomes larger than 12. This feature is caused by the reduced number of less scattered photons which can be detected and by the fact that at each scattering event depolarization is weak due to the large anisotropy value, g, of the scatterers in the turbid media. The latter feature can be seen from Fig. 6.6b; photons scattered between 15 and 30 times have similar depolarization (degree of polarization, γ). Therefore, it is difficult for polarization-gating to selectively suppress the highly scattered photons. Since polarization-gating is based on the number of detectable unscattered or less scattered photons which maintain the initial degree of polarization [5], the transverse resolution is eventually degraded to that of the NG technique as the optical thickness, n, increases, which is clearly illustrated in Fig. 6.6a, b.
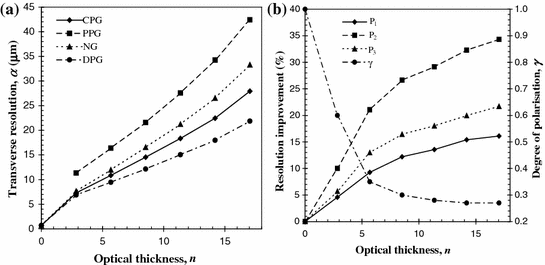
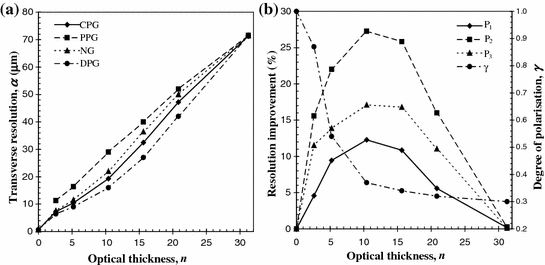

Fig. 6.5
Resolution performance for sample set B at NA = 0.75. a Measured transverse resolution as a function of the optical thickness, n, for NG (α p+s), CPG (α p), PPG (α s), and DPG (α p−s). b Resolution improvement and the degree of polarization, γ, as a function of the optical thickness, n. A comparison is given between CPG and NG (P 1), DPG and NG (P 2) and DPG and CPG (P 3). Reprinted with permission from [2], 1998, Elsevier

Fig. 6.6
Resolution performance for sample set C at NA = 0.75. a Measured transverse resolution as a function of the optical thickness, n, for NG (α p+s), CPG (α p), PPG (α s), and DPG (α p−s). b Resolution improvement and the degree of polarization, γ, as a function of the optical thickness, n. A comparison is given between CPG and NG (P 1), DPG and NG (P 2), and DPG and CPG (P 3). Reprinted with permission from [2], 1998, Elsevier
6.2.3 Image Resolution in a Turbid Medium of Milk
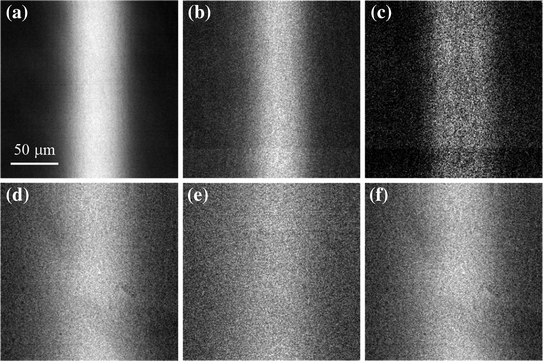
We now demonstrate the effect of polarization-gating in a more realistic tissue-like sample which consists of scatterers of different sizes. To demonstrate the effect of the polarization-gating mechanisms on image quality in tissue-like turbid media, sample4 and sample5 (see Table 6.2) are used to form images of an embedded bar. Figure 6.7 shows typical images of a 48-μm bar embedded in sample4 (Fig. 6.7a–c) and sample5 (Fig. 6.7d–f) when CPG, PPG, and DPG techniques were employed. Clearly, there is an improvement in the edge sharpness for DPG (Fig. 6.7c) when compared with CPG (Fig. 6.7a), indicated by the reduced smearing at the edges of the image. As the turbid sample becomes thicker (Fig. 6.7d–f) it is visually difficult to see the improvement in image quality between CPG (Fig. 6.7d) and DPG (Fig. 6.7f). This result suggests that at an optical thickness, n, of 20 for the semi-skimmed milk suspension, the number of less scattered photons is low. Therefore the effect of polarization-gating is diminished. From the results presented for polystyrene microspheres, the average particle size for the milk suspension may be referred to be between 0.2–0.5 μm.

