Fig. 48.1
Axial diagram shows the anatomy of the prostate in an adult with correlation with axial T2-weighted images. High signal intensity of the normal peripheral zone (PZ). Central zone (CZ) or surgical capsule–pseudocapsule (SC) (short white arrows). Transitional zone (TZ) with normal heterogeneous hypertrophy of low signal intensity. True capsule (white long arrows). Fibro stromal anterior zone (AZ)
Approximately 70 % of prostate cancer arises in the peripheral gland and about 30 % arises in the transition-central gland [1].
The seminal vesicles are paired lobulated glands found superior to the prostate base. The seminal vesicles are visualized as elongated, multiseptated, fluid-filled structures on T2-weighted MR images. Seminal vesicles may be fully, partially expanded or atrophic at the elderly age [2].
48.3 Diagnosis of Prostate Cancer
Prostate cancer diagnosis is initiated on the basis of prostate-specific antigen (PSA) measurements and determination of clinical stage by means of digital rectal examination (DRE). The specificity of PSA is low (36 %) owing to false-positive PSA elevation under benign circumstances, such as inflammation or benign prostatic hyperplasia, which can lead to perform a high number of unnecessary blinded biopsies [5]. When DRE results are positive or when the PSA level is elevated, systematic random biopsies and from a suspicious region is generally performed. Random biopsies are prone to undersampling and underestimation Gleason grade in almost 50 % of cases [1]. These inaccurate tools often lead to incorrect diagnoses, inaccurate risk assessments, and less optimal therapeutic choice. Because of these limitations, there is a need for improved prostate cancer diagnosis with improved detection, localization, staging, and therapeutic follow-up.
48.4 Imaging Techniques (Table 48.1)
Table 48.1
Advantages and drawbacks of imaging in prostate cancer
Technique | Advantages | Drawbacks |
|---|---|---|
TRUS | Evaluate size and zonal anatomy | Low spatial resolution |
Widely available and low cost | Low sensitivity and specificity | |
Facilitate real-time guidance for biopsy | Not useful for staging | |
Detection of hypervascularization on Doppler | Majority of tumors are hypovascular | |
Higher sensitivity using contrast | Not clinically approved | |
CT | Bone and lymph node evaluation | Low spatial resolution |
Therapeutic planning | Not useful for detection and therapeutic follow-up | |
MR | Anatomic and functional imaging (spectroscopy, diffusion, perfusion) | Expensive |
Useful for detection, staging, and therapeutic follow-up | No real-time imaging | |
No ionizing radiation | Features might overlap between cancer and prostatitis | |
Artifacts (susceptibility to motion) | ||
Bone scan | Sensitive | Low spatial resolution |
Low cost | Detect only blastic lesions | |
Do not detect extraskeletal lesions | ||
PET-CT | High sensitivity | Low spatial resolution |
Metabolic evaluation | High cost | |
Potential detection with new tracers | Limitation with FDG | |
Detection of metastatic lymph node and bone metastasis | Response dependence on the tracer |
48.4.1 Transrectal Ultrasonography
Transrectal ultrasonography (TRUS) plays an important role in the diagnosis and management of prostate cancer. TRUS is predominantly used for determining prostate size and guiding prostate biopsy. Prostate cancer can be visualized as a hypoechoic lesion in the peripheral zone. However, the TRUS findings are operator dependent and more than 40 % of cancers are isoechoic and therefore not visible with conventional TRUS methods [2]. New ultrasounds techniques have been developed to enhance the accuracy of the biopsies using a target detection method.
48.4.2 Color Doppler and Power Doppler Ultrasound
Color Doppler ultrasonography (CD-US) is a complementary tool to help better identify areas of increased vascularity which might be associated with tumor. Malignant lesions are characterized by asymmetrically increased flow pattern, particularly in higher-grade Gleason score. It has shown the improved specificity using power Doppler, but not the overall accuracy or sensitivity. The wide range of reported data might suggest operator dependency and subjective interpretation of images. False-positive results may be associated with hypervascular prostate tissue in patients with benign prostatic hyperplasia or prostatitis [1].
48.4.3 Contrast-Enhanced Ultrasonography (CE-US)
The currently used ultrasound contrast agents consist of a solution of gas-filled microbubbles with a diameter of 1–10 μm that are stabilized with a shell. The contrast agents are administered intravenously and provide enhanced visualization of blood flow within the microvasculature. The detection of augmented vasculature of tumor tissue provided by this technique appears helpful for targeted prostate biopsy. However, in the majority of studies, the overall cancer detection rate is similar between systematic biopsy and CE-US-targeted biopsy. There seems to be a potential role for CE-US in the identification of more aggressive high-grade cancers that are accompanied by enhanced neovascularization [1].
48.4.4 Sonoelastography
Elastography is a form of signal processing applied to TRUS that evaluates the stiffness of tissue. The increased cellular density associated with prostate cancer results in areas with limited elasticity or compressibility within the prostate gland that it can be identified by elastography in real time. Different studies have shown that the detection rate of prostate cancer is significantly higher using elastography-guided systematic biopsy (51.1 %) in comparison with gray-scale ultrasonography (39.4 %) [1].
48.4.5 Radionuclide Scans
Bone scan is still being used as method of choice for the detection of bone metastases in men with high-risk disease, symptomatic patients, or patients whose examination suggests the presence of metastases. Bone scans are also used to monitor disease. In some patients a flare phenomenon may be seen in the first week after therapy. The flare phenomenon is characterized by increased uptake of radiotracer because of increased osteoclast turnover associated with healing. Single-photon emission CT (SPECT) is another method used to detect bone metastases, similar to bone scan using tomographic technique. Another radionuclide examination is positron emission tomography/CT (PET-CT). The spatial resolution of PET is limited in its effectiveness relies as a metabolism image tracer to detect tumors. The most widely used tracer is 18F-FDG (fluorine-18 fluorodeoxyglucose), indicative of glycolytic activity of cancer cells. FDG is not effective in locating prostate cancer due to low glucose metabolic activity in prostate cancer. Moreover, nodules from benign prostatic hypertrophy may also show increased metabolic activity (Fig. 48.2). New radiopharmaceuticals based on choline, fluorocholine, methionine, acetate, and l-leucine have shown promising results in research studies. PET-CT examination is not indicated as local detection method but shows encouraging results as a lymph node-staging technique and therapeutic monitoring in patients with biochemical failure. Currently choline PET-CT shows significant accuracy results in the management of recurrence [6], although more experience is required to avoid false-positive and negative results that initial studies have shown, mainly to detect microscopic lesions [2].
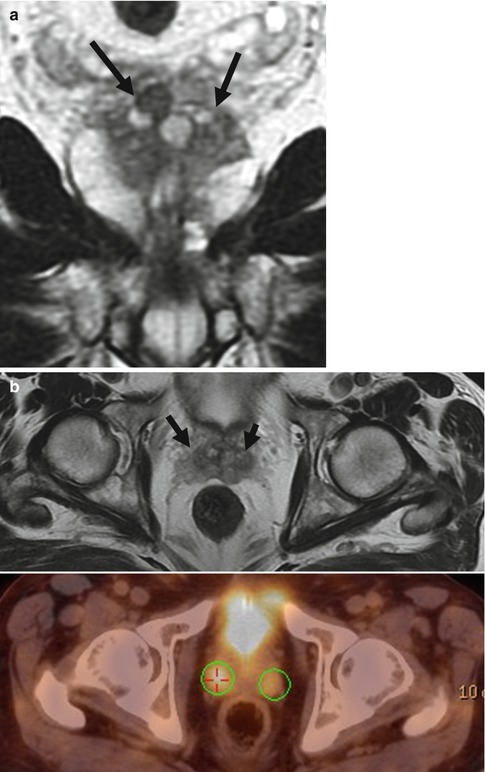
Fig. 48.2
Pitfall on FDG PET-CT due to benign hypertrophy of the prostate. (a) Coronal T2-weighted image showing benign hypertrophy at the base of the prostate bilateral (arrows). (b) Axial T2-weighted image (arrows) and axial PET-CT show pathologic uptake at the level of the base of the prostate bilateral, clearly depicted on the maximum-intensity projection image (circles) (c)
48.4.6 Magnetic Resonance Imaging
MR imaging, with its excellent soft-tissue resolution, can provide functional and anatomical tissue information and is the most sensitive available technique for detection, local staging, and therapeutic follow-up of prostate cancer (Table 48.2).
Table 48.2
Advantages and disadvantages of the different MR sequences
Imaging type | Advantages | Disadvantages |
|---|---|---|
MR | Allows anatomical and functional images of the prostate MR is more accurate in lesion detection and staging than any other method | Expensive Does not allow real-time imaging |
T1 WI | Detection of hemorrhages postbiopsy as zones of high intensity. Detection of lymph nodes and bone lesions | Prostate gland appears homogeneous without anatomical zone differentiation |
T2 WI | Differentiation of anatomical zones Cancer shows low signal intensity Peripheral zone tumors appear as not well-defined foci of low signal intensity Allows assessment of ECE SVI appears as foci of low signal intensity within the high signal intensity of the seminal vesicles | Prostatitis, hemorrhages, atrophy, BPH, and posttreatment changes may look like cancer Signal of central gland tumors is similar to the normal gland and to the central gland hypertrophy. Transitional zone hyperplasia with fibrotic nodules may show similar signal pattern as cancer Lymph node staging is complicated and should be based on their morphology and enlargement size |
DCE | Detection of vascularization Increased specificity in comparison with T2 WI; early tumoral enhancement, with fast washout of contrast agent | Small low-grade tumors may not show increased vascularization Patients with BPH may show an abnormal increase of the vascular pattern similar to that of patients with central gland tumors Contrast agent with gadolinium may cause nephrogenic systemic fibrosis in patients with severe renal failure |
MRSI | Provides concentrations of citrate, choline, and creatine; high levels of choline and low levels of citrate may be indicative of cancer | Technologically challenging and may require physicists expert on MR. Overlap between the metabolic profile of prostatitis and cancer |
DWI | Prostate cancer may appear as a focus of high signal intensity and as a low signal in the ADC map | Findings may not be specific as hyperplasia may show restricted diffusion. Susceptibility artifacts due to postbiopsy hemorrhage |
48.4.6.1 Anatomic MR Imaging
MR examination of the prostate needs high field units with no lower than 1.5 T. An optimal MR study for localization and detection of prostate cancer requires the use of an endorectal coil and a pelvic multichannel phased-array coil; endorectal coil is more uncomfortable and makes the examination more expensive. For 3 T units, the need of using an endorectal coil has not been determined yet. If there is a history of previous biopsies, MR examination has to be postponed 8–10 weeks to avoid that glandular hemorrhagic changes or periglandular fibrotic changes that may interfere with the correct interpretation of the study [7].
Morphological information are obtained on T1-weighted and T2-weighted high-resolution images. T1-weighted image allows assessment of pelvic lymph nodes and of the pelvis bone to rule out metastasis and to assess hemorrhagic changes after biopsy (Fig. 48.3) (which can mimic tumor on T2-weighted images) [8]. T2-weighted image of the peripheral gland shows homogeneous high signal intensity in contrast to the heterogeneous low signal intensity of the central-transitional zone, although high-intensity areas of adenoma may be observed in the central zone (Fig. 48.1). The diagnostic criterion for prostate cancer on T2-weighted MR images is the presence of nodular areas of low signal intensity within the normal high signal intensity of the peripheral gland or zone (Fig. 48.4). T2-weighted imaging has limitations for identifying cancer in the transitional zone due to the difficulty to define tumoral zones of low signal intensity within the normal low signal intensity of the central tissue. The findings suggesting cancer in the transitional zone are diffuse low signal intensity with poorly defined margins [9], absence of a margin (commonly seen in adenomas), and disruption of the surgical pseudocapsule (Fig. 48.5). Low signal intensity lesions in the peripheral zone may also be observed in benign lesions such as prostatitis, hyperplasia, fibrosis, calcification, subacute postbiopsy hemorrhage, postradiation therapy changes, and hormone deprivation therapy (Fig. 48.6).
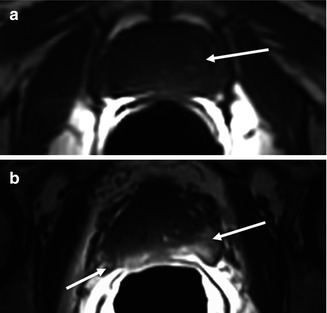
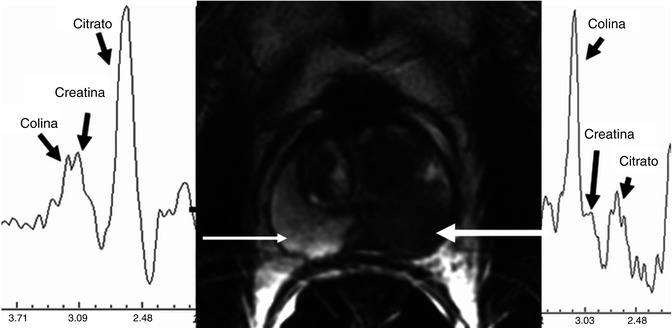
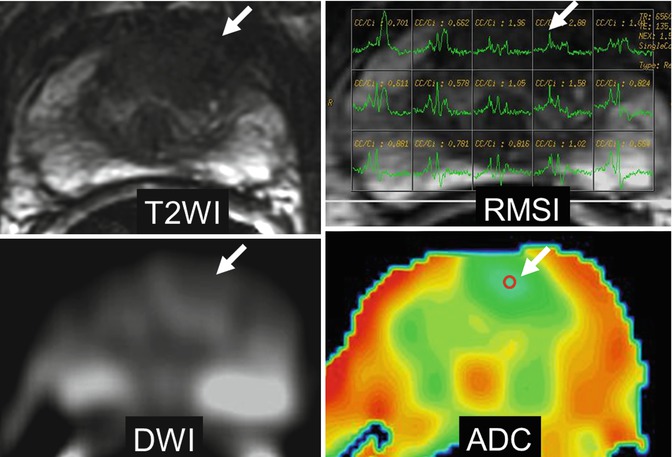
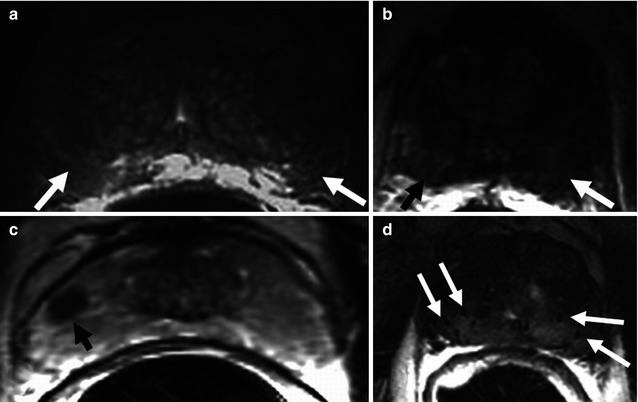
Fig. 48.3
Anatomy in the axial plane, T1-weighted sequence. (a) Diffuse normal isointense signal of the gland, without differentiation between central and peripheral zone, and some slight high-intensity areas of adenoma with no pathological significance (arrow). (b) High-intensity signal in both peripheral lobes secondary to postbiopsy hemorrhage (arrows)
Fig. 48.4
Axial T2-weighted image and spectroscopy curves. Normal spectrum shows elevation of citrate and low level of choline with high signal intensity of the peripheral zone (thin arrow). Pathological spectrum with elevated choline and low citrate from a nodular low signal intensity lesion of the left peripheral zone related to carcinoma (thick arrow)
Fig. 48.5
Prostate cancer in the central zone. Axial T2-weighted image shows focal low signal intensity ill-defined lesion at the left central zone (arrow). MR spectroscopy sequence, MRSI, shows elevated choline peak (arrow). DWI (b = 1,000 s/mm2) shows slight high signal intensity (arrow). ADC color map shows low ADC values of the lesion represented as blue color (arrow); ADC value can be quantified by placing the region of interest (ROI) (arrow)
Fig. 48.6
Axial T2-weighted imaging of nonneoplastic lesions of low signal intensity in the peripheral zone. (a) Bilateral diffuse peripheral low intensity due to prostatitis (arrows). (b) Bilateral diffuse peripheral low signal intensity due to subacute hemorrhage after biopsy (arrows). (c) Focal lesion of low signal intensity in the right peripheral zone related to fibrosis (arrow). (d) Diffuse low signal intensity of the entire prostate secondary to brachytherapy, showing the seeds (arrows)
48.4.6.2 MR Spectroscopy
MR spectroscopic imaging (MRSI) provides information on the gland metabolism. The sequence is acquired using the multivoxel technique, programming a volume on T2-weighted imaging. For three-dimensional spectroscopic acquisition, selective bands are used to achieve water and lipid suppression and to optimize citrate, creatine, and choline detection. Six saturation bands are used to eliminate signals from the adjacent tissue. Field homogenization is automatically calculated. The dataset should be processed using specific software for quantification of the values of the metabolic ratios. Generally, the peaks calculated are for choline, creatine, and citrate. Despite other metabolites can be also identified such as polyamines, they are better detected in 3 T units. Good signal-to-noise ratio needs to be confirmed (>5:1) as well as the absence of contamination by fat or water. Normal prostatic tissue has high citrate values and low choline and creatine values, whereas neoplastic tissue has high choline values and low citrate values [11].
Suspicion criterion is a high [(creatine + choline)/citrate] (CCo/Ci) ratio; however, there is no consensus regarding which metabolic ratio determines the presence of prostate cancer, due to the variability among patients and MR units (Fig. 48.4). Parameters of the metabolic ratio for the central gland have not been established due to the overlap in CCo/Ci ratio between the normal, or hypertrophic, and the neoplastic tissue in the central zone. In any case, the most specific finding for diagnosis of neoplasia in the central zone is the absence or very low values of citrate and the elevation of choline (Fig. 48.5). MR spectroscopy has shown promise in predicting tumor volume, extracapsular extension, and estimation of the aggressiveness of cancer and treatment response. The potential application of MRSI to rule out the presence of prostate cancer in patients with persistently rising PSA value and negative prostate biopsies has been shown. MRSI needs more expertise and longer acquisition time than other functional MR techniques. MRSI has limitations due to artifacts from postbiopsy hemorrhage and suboptimal shimming.
48.4.6.3 Diffusion-Weighted Image
The technological advances of MR have allowed an expansion in the use of the diffusion sequence (DWI) to organs other than the brain. Diffusion sequence provides information about random Brownian motion of the free water molecules in the interstitial space and through the cellular membrane. In general, neoplastic tissue has more restricted diffusion than normal tissue because of its higher cellular density, which hampers normal diffusion of water molecules [12]. Diffusion sequence provides information about cellular density, the tortuosity of the extracellular space, the integrity of the cellular membranes, and the degree of glandular organization. The sequence must include the whole pelvis, prostate, and seminal vesicles in order to simultaneously achieve regional staging and detect a potential extraglandular lesion in the same acquisition [13]. The low mobility of molecules appears as a high signal on DWI MRI; similarly, molecules with high mobility show a loss of signal (Fig. 48.7). Sequence interpretation requires processing and quantification of the diffusion images using the ADC (apparent diffusion coefficient) in the parametric map. For quantification, the 5–10 mm2 region of interest (ROI) is placed on the region of choice. Factor b value varies since there is no consensus regarding its optimal value. Nonetheless, values =0 and ≥1,000 s/mm2 are recommended for the prostate. The use of higher b values may increase the sensitivity of the sequence by eliminating the high signal intensity of tissues with long T2 relaxation times (edema or fluid due to the high density of their protons), phenomenon known as “T2 shine-through.” Lesions with serious diffusion restrictions appear as low signals on gray-scale ADC maps. ADC quantification via monoexponential fitting is highly recommended for lesion characterization and cancer grading. A bicompartmental model using multiple b values and allowing separating true diffusion without perfusion contamination and the perfusion fraction has demonstrated that low and fast diffusion components are present in the prostate as previously reported in the brain [14]. Fast diffusion dominates the signal at low b values and low diffusion at high b values. With low b values the signal decay is due to the perfusion effect over diffusion, and with higher b values over 100 s/mm2, the true diffusion signal decay may be calculated (Fig. 48.7). The fast and slow ADCs of cancer have shown significantly lower values than those of transitional zone and peripheral zone, and the apparent fraction of the fast diffusion component was significantly smaller in cancer than in peripheral zone [15].
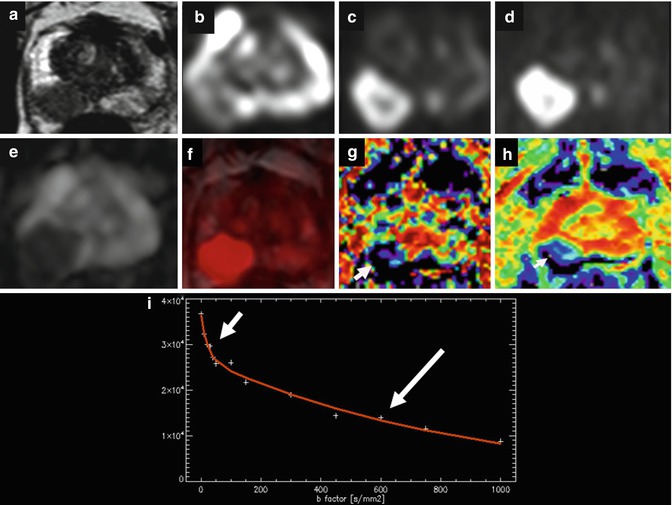
Fig. 48.7
 Functional Imaging of Ovarian Cancer and Peritoneal Carcinomatosis
 Functional Imaging of Tumors of the Mesenterium and Retroperitoneum
 Functional CT and MRI of the Urinary System and Adrenal Glands
 Bone Malignancies
 MR Imaging Evaluation of Posttreatment Changes in Brain Neoplasms
 Pancreatic Adenocarcinoma and Other Pancreatic Malignancies


Related posts:
Functional Imaging of Ovarian Cancer and Peritoneal Carcinomatosis
Functional Imaging of Tumors of the Mesenterium and Retroperitoneum
Functional CT and MRI of the Urinary System and Adrenal Glands
Bone Malignancies
MR Imaging Evaluation of Posttreatment Changes in Brain Neoplasms
Pancreatic Adenocarcinoma and Other Pancreatic Malignancies
Stay updated, free articles. Join our Telegram channel
Full access? Get Clinical Tree
