Quantities for 60Co in the in the denominator of the above equation are well established. For protons, there are some uncertainties. According IAEA TRS 398, Wair/e for protons is 34.23 ± 0.14 J C−1. Water to air stopping power ratios are obtained from Monte Carlo simulation. P wall, the correction factor for non-water equivalence of the wall of the ion chamber; P cel, the correction factor for the presence of the central electrode; and P cav, the correction factor for perturbation of proton fluence distribution due to the presence of the ion chamber are assumed to be unity for protons. Table 10.3 of the IAEA TRS 398 lists the beam quality factor for a number of widely used ion chambers as a function of R res. The determination of the dose per monitor unit (MU) follows the following simple steps.
1.
Measurement of charge generated in ion chamber for fixed amount of MU.
2.
Correction for the measured charge for environmental conditions like temperature and pressure, which is usually different from the condition associated with the chamber calibration factor.
3.
Determination of chamber polarity factor by measuring the charge for same MU at both positive and negative applied bias to the chamber.
4.
Determination of ion recombination factor (Ks), which is usually done following the two-voltage method. The charge is measured for the same number of MU for high voltage and then with a lower voltage. The K s is determined from the formula provided in Table IV.1 of the IAEA TRS 398 report depending on the type of beam to be calibrated.
5.
Final step is the determination of dose per MU using the following equation:

(6.1)
where, Dw is the dose to water,
M is charge generated in ion chamber corrected for temperature and pressure (KTP), polarity (Kp) and ion recombination (Ks),
NDW, 60Co is the dose to water calibration coefficient of the ion chamber for the 60Co beam, and
KQ is the beam quality factor.
A work sheet is provided in IAEA TRS 398 to record different factors needed to determine the dose per MU and to record the results of dose monitor calibration.
Usually a unit of MU corresponds to a certain amount of charge collected by the main dose monitor or back-up dose monitor. The dose per MU can be adjusted to desired value by changing the amount of charge to be used to define the MU and measuring the dose per MU using the IAEA TRS 398 protocol as outlined above.
6.3.2.2 Calibration of the Dose Monitors for Proton Pencil Beam Spots
Same reference condition like the passive scattered modulated proton beam can be used to calibrate the dose monitor of spot-scanned proton pencil beam delivery system. A broad field with uniform dose distribution in a large volume has to be created using a suitable spot distribution and the depth-dose curve for this field needs to be measured to determine the Rres before the calibration is carried out. The dose uniformity in the reference volume is also to be confirmed with measurement in a number of different locations. For example, the reference condition used at UT MD Anderson Cancer Center Proton Therapy Center in Houston, USA, which will be referred as PTCH hereafter, is uniform dose of 217.13 cGy to 1 liter volume irradiated with a broad beam of 10 cm × 10 cm and nominal SOBP width of 10 cm created with the superposition of 6760 spots with 18 different energies from 178.6 to 221.8 MeV and 8 mm of inter-spot spacing. The number of digital charge counts per MU was adjusted such that total of 217.13 MU would deliver the 217.13 cGy.
Alternatively, a broad field of monoenergetic proton spots can be used to do the monitor chamber calibration at a reference depth chosen in the plateau region. The IAEA TRS 398 protocol recommended value for plateau calibration is 3 cm in water. The relationship between MU and dose is complex in discrete spot-scanned proton beams. The dose at any location depends on the contribution of the all the spots of the broad field. The delivery of the desired dose to a volume requires that the entire spot pattern must be delivered. A single MU merely represents a certain amount of charge collected by the main dose monitor; its relation to dose distribution will depend on the energies and locations of spots. The purpose of the dose monitor calibration under the reference condition is to define the amount of digital charge count per MU and to check its constancy during periodic QA measurements. Once the number of digital charge count per MU is established, it is used for dosimetric characterization of PPBS in terms of dose/MU, to configure the PPBS in treatment planning system and for dose verification of broad fields. As described by Pedroni et al. [6] and Tilly et al. [7], if the treatment planning system requires MU per proton, then it would be necessary to use a Faraday cup to count the number of protons in one MU to establish this factor as described in the next section. It is a customary practice to verify the dose for treatment fields of spot scanned proton pencil beams calculated by the treatment planning system using a suitable measuring device like ion chamber or ion chamber array.
6.3.3 Fluence-Based Reference Dosimetry
Dose to a medium like water can be determined from the knowledge of the incident particle fluence (ϕ) and collision stopping power (S w (Z)/ρ w) in water at the depth of interest (Z) using the following equation:

Fluence can be measured by a Faraday cup or sample activation [1].

(6.2)
A Faraday cup, named after Michael Faraday, is a metallic cup designed to count charged particles in vacuum [8]. The construction of the Faraday cup ensures that only the primary charged particles can enter the cup and be counted. The number of charged particles (N) can be determined from the measured current or charge Q and the knowledge of the charge per particle (Ze), which is 1e for protons.
 Suppose the incident proton beam is completely stopped in the Faraday cup and is uniformly distributed in an area A. Then the fluence of the charged particle, ϕ = N/A, and the dose from this incident beam can be calculated using Eq. (6.2). The determination of collision stopping power also requires the knowledge of the spectral fluence of the incident proton beam. One of the possible methods to determine the spectral fluence of a polyenergetic beam is Monte-Carlo simulation of the beam line.

Incident proton fluence can also be determined from sample activation measurements in which a sample with known number, N, of 12C atoms is irradiated for a known time interval t. The proton fluence can be derived from measuring 11C activity and the knowledge of the reaction cross sections and decay constants. This is very useful for high dose per pulse proton beams, but has more uncertainties compared to other methods. The estimated uncertainties of various methods used for reference dosimetry are the following [1, 3]:
Water calorimetry: 0.6 %
Graphite calorimetry: 1.4 %
Ion chamber: 2.3 %
Faraday cup: 2.3 %
Activation-based dosimetry: 3.5 %
6.4 Proton Beam Dosimetry under Non-reference Conditions
National and international protocols like IAEA TRS 398 provide the guideline for dose measurement under reference conditions for therapeutic radiation beams including protons. The treatment fields seldom match the reference conditions. Thus, the clinical dosimetry of therapeutic radiation beams always involves measurements under non-reference conditions but related to the reference condition.
6.4.1 Passive Scattering Proton Beam Dosimetry under Non-reference Conditions
Proton field parameters for passively scattered proton beams leading to a different dose/MU at any point under non-reference condition compared to that from the reference condition are beam energy or range, SOBP width, thickness of range shifters, location of the point of interest relative to the center of SOBP, location of the point of interest relative to the central axis of the beam, source to calibration point distance, field size, and compensator and patient scatter factor. Effect of each of these changes can be quantified in terms of special dosimetry factors [9] as given in Table 6.1.
Table 6.1
Dosimetry factors to quantify the changes in dose/MU at a point of interest under non-reference condition
Changed parameter from reference condition | Associated dosimetry factor |
|---|---|
Beam energy | Relative output factor (ROF) |
SOBP width | SOBP factor, SOBPF |
Range shifter thickness | Range shifter factor (RSF) |
Distance of the point of interest from the center of SOBP | Off-center factor (OCF) |
Distance of the point of interest from the central axis of the field | Off-axis factor (OAF) |
Source to point of interest distance | Inverse square factor (ISF) |
Field size | Field size factor (FSF) |
Compensator and patient scatter factor | Compensator and patient scatter factor (CPSF) |
One can determine these factors by measurement with an ionization chamber in water and use them for dose/MU determination for the specific proton fields of passively scattered beam. These parameters are also useful for simple calculation of point doses in passive scattered proton fields. 3-D dose distribution using these parameters will be too cumbersome and impractical. Semiempirical model-based dose calculation algorithms like pencil beam algorithms are used instead in modern treatment planning systems. However, they are found to be useful in determining the monitor units of treatment fields as discussed in Sec. 6.4.3.
6.4.2 Proton Dose Calculation Using the Semiempirical Analytical Methods
Proton dose distribution for a broad proton field of any shape and size can be calculated [10] either through the use of radiation transport formalism for the protons in the incident beam or by semiempirical analytical methods based on the analytical modeling of proton interaction with devices used for beam spreading and shaping and the irradiated media, and measured data to determine the parameters used in the model. The radiation transport methods, which are expected to be the most accurate, can be Monte Carlo simulation-based or deterministic solution of the Boltzmann transportation equation. However, these calculations are very computationally intensive and are not routinely used in dose calculation for clinical treatment planning. The deterministic dose calculation based on solving the Boltzmann transportation equation is still in research and developmental stage, but the Monte Carlo simulation-based dose calculation is widely used [11] in the proton beam dosimetry necessary to provide the dose distribution information in the situation where analytical methods have limited accuracy. In routine clinical practice, the dose into different media is calculated using the pencil beam algorithm. In this algorithm, a broad incident beam is divided into narrow pencil beams and the dose is calculated convolving the central axis depth-dose of the beamlet [12, 13], I(Z), with the lateral beam profile, K(r,ϕ,σ(z)), and is given by

The lateral distribution of the beamlet is modeled by a Gaussian distribution with root mean square (RMS) spread σ(z) and sum p is carried over all the beamlets of the broad beam. The σ(z), which is also known as lateral beam spread parameter, is obtained from RMS of lateral spread parameters due to various responsible scattering processes, like multiple coulomb scattering, large-angle scattering, and nuclear interactions, involved in proton beam interaction with the beam-modifying devices and media of passage of the beam. Detail description of the dose calculation algorithm is outside the scope of this chapter. One of the key components of the implementation of the dose calculation algorithms is that they require high-quality measured beam data for depth-dose curves and lateral profiles both to extract the pencil beam parameters and to validate the beam model. The validation of the model of the proton beam delivery system nozzle used in Monte Carlo simulation also requires high-quality beam data of the depth-dose curves and lateral beam profiles. The 3-D distribution can be constructed from the measured depth-dose curves and beam profiles or from calculated dose distribution using an appropriate dose computation model.

(6.3)
6.4.3 Depth-Dose Measurement
Depth-dose curves, which are dose profiles in the beam longitudinal direction are usually measured using suitable ionization chambers in computerized 3-D water tank beam scanning systems. The depth dose measurement in broad fields of passive scattering proton beam is similar to the measurements for collecting beam data for photon or electron beams. A parallel plate ionization chamber is recommended for depth-dose distribution measurement by the IAEA TRS 398 protocol [3]. Because of the uncertainties in the effective point of measurement for cylindrical chambers, their use in the high-dose-gradient regions of depth-dose curve should be avoided.
The ionization chamber measures the ionization as a function of depth, which needs to be converted to dose as a function of depth because of possible change in the stopping power ratio S w,air with depth and the change of the ion chamber perturbation factors. Per IAEA TRS 398 protocol, the perturbation factors are assumed to have a value of unity, but it recommends to check any variation of ion recombination and polarity effect with depth. The values of the stopping power ratio S w,air as a function of residual range (R res) at the depth of the measurement are obtained using the following equation [3]:

with a = 1.137, b = − 4.3 × 10⁻⁵, and c = 1.84 × 10⁻³.

(6.4)
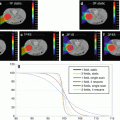
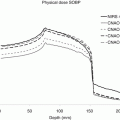
In practice, the variation of the S w/air with depth is minimal and is nearly constant for the range of clinical proton energies. Thus, the difference between the normalized percentage depth-dose curve and normalized depth-ionization curve is negligibly small for the range of proton energies used in the clinic for patient treatment as can be seen in the following figure (Fig. 6.1).


Fig. 6.1
Comparison of percentage depth-ionization (PDI) and percentage depth-dose curves (PDD) measured at PTCH for two passively scattered proton beams
Special care needs to be taken while measuring the depth-dose distribution for small proton beam fields. As recommended in the IAEA TRS 398 protocol, if the field size is smaller than twice the diameter of the parallel plate chamber, then a smaller detector like mini ionization chamber, diode, or diamond detector should be used. Appropriate stopping power ratios, for example, water to air for mini ionization chamber, water to silicon for diode, or water to graphite for diamond detector, then are used to convert the detector response to dose to water. It is recommended that the suitability of these detectors be checked by comparing the depth-dose distribution measured by these detectors with that measured by a parallel plate ionization chamber for an appropriate large field size.
While performing depth-dose measurements with ion chamber and water tank beam scanning system, consideration should be given to suitable scanning parameters, like the time of integration at each point of measurement and spatial spacing of the measurement points. For SOBP fields that are generated with rotating range modulation wheels (RMW), the adequacy of the time of integration should be studied to ensure that artifacts of incomplete rotations of the RMW are not present in the measured depth-dose curves.
Although parallel plate ionization chambers remain the detector of choice for measurement of depth-dose distributions, use of films [14, 15] and imaging plates [16] was also explored to measure the depth-dose curves of proton beams. These measurements require suitable detector response to dose calibration factors and corrections both for LET dependence of the detector response and for quenching. They are useful for quick measurement of depth-dose distribution for constancy checks of the delivery system. A multilayer ionization chamber array, like the Zebra from IBA (IBA Dosimetry GmbH, Schwarzenbruck. Germany), is also found to be suitable for rapid online depth-dose measurements in passive scattering beam [17].
6.4.4 Transverse Profile Measurements
Small-volume ionization chambers in water tank beam scanning system provide high-quality transverse profiles also known as lateral profiles, of proton beam fields. These measurements require scans with high spatial resolution in the high gradient region to determine the field penumbra and may need some correction for the detector size effect. Since the variation of proton LET in the transverse direction is minimal, other dosimeters like film, diode, diamond detectors, and luminescent screens with CCD camera can be used for measuring dose or fluence profiles perpendicular to the beam direction [1]. A suitable calibration curve is used for converting the detector response to dose, if it is not directly proportional to the dose, as in the case of the film. Ionization chamber arrays are also used to measure the lateral profiles but may have limited spatial resolution due to the large inter-chamber separation. Additionally, large detector sizes in the commercially available ionization chamber arrays may not provide accurate field penumbras due to volume averaging effects. They are very useful for constancy check of the delivery system functionality.
6.4.5 Scanned Proton Pencil Beam Spot (PPBS) Dosimetry under Non-reference Conditions
A broad field to provide the required 3-D dose distribution is created by the superposition of a number of spots of different energies spread over the irradiated volume. Thus, the dose at any point of interest is determined from the sum of dose from each spot used to create the broad field. The dose from each pencil beam at any point of interest can be obtained using Eq. (6.3). Usually, the 3-D dose distribution in the media of interest is calculated in the treatment planning system using a semiempirical analytical model. Commissioning the treatment planning system for PPBS [18] includes generating the required input data such as planar integral depth-doses in Gy•mm2/MU for each energy and lateral in-air fluence profiles of the pencil beam spot for selected energies and adjusting the model parameters to match the measured data. Knowledge of spot depth-dose distribution and lateral dose profiles of each individual spot is needed to determine the dose for any broad field created by these spots and forms the core of the dosimetry of PPBS as described the following sections.
6.4.5.1 Dosimetry of PPBS
Dosimetry of the PPBS involves experimental characterization of the spot dose distribution in terms of in-air fluence, spot size, in-water dose profiles, peak spot dose, and planar integral spot dose (PISD). The general shape of the PPBS is close to a Gaussian function and the FWHM of the spot fluence or dose profiles depend on the initial energy and depth of measurement. As the FWHM of the narrowest PPBS can be smaller than 10 mm, measurement of profiles, peak spot dose, and central axis percentage depth-dose is challenging. Various devices like film, small-volume ionization chamber, diodes, optically simulated luminescent detectors, and other solid-state detectors can be used to measure the fluence and dose profiles of PPBS. Some practical measurements to obtain PPBS profile and depth-dose data are described in detail in the following paragraphs.
6.4.5.2 Spot Profile Measurement
There are published reports of spot profile measurements carried out at different facilities using the scanning proton pencil beam. The details of in-air fluence and in-water dose lateral profile measurements carried out for commissioning of the scanning proton beam at PTCH are described in a paper by Sawakuchi et al. [19]. A PTW PinPoint chamber (Model 3014, PTW-Freiburg, Freiburg, Germany) with 0.1 cm radius and 0.5 cm height was used in a PTW MP3 3-D water tank beam scanning system to measure the lateral fluence and dose profiles. Another PTW PinPoint chamber was used as a reference chamber in performing the scans. The reference chamber was placed at an upstream location in the beam path and as far away as possible from the central axis to minimize the perturbation in the fluence or dose at the field chamber from the particles scattered by the reference chamber. An adaptive step size was used at various locations of the profile, namely, 0.1 cm, in the high gradient region and 1 cm in the low gradient regions of the profile. At each point integrated charge for 4 s was measured. Relative dose measurement was extended several centimeters from the central axis until its value became a factor of 104 lower than the central axis value. The reliability of the ionization chamber (IC) measured profile was studied by comparing them with those measured with Gafchromic EBT films (International Specialty Products, Wayne, NJ) and optically stimulated luminescent detector (OSLD) strips (Luxel, Landauer, Inc., Crystal Growth Division, Stillwater, OK). The application of OSLD strips for profile measurements is relatively new and is described in a recent publication by Yukihara et al. [20]. The use of OSLD strips for measuring PPBS profiles was therefore experimental in nature. Figure 6.2 shows a comparison of the in-air profiles measured with EBT film, OSLD, and ionization chamber.


