The 2016 World Health Organization brain tumor classification is based on genomic and molecular profile of tumor tissue. These characteristics have improved understanding of the brain tumor and played an important role in treatment planning and prognostication. There is an ongoing effort to develop noninvasive imaging techniques that provide insight into tissue characteristics at the cellular and molecular levels. This article focuses on the molecular characteristics of gliomas, transcriptomic subtypes, and radiogenomic studies using semantic and radiomic features. The limitations and future directions of radiogenomics as a standalone diagnostic tool also are discussed.
Key points
- •
Current research in brain tumors is focused on tumor genomics to identify novel therapeutic targets, devise personalized treatment options, and thereby improve individual patient outcomes.
- •
Radiogenomics is the study of relationship between imaging features (radiophenotypes) and genetic/molecular profile of disease state, typically neoplasms.
- •
Primary de novo tumors account for more than 80% of glioblastomas (GBs), occur in older patients, and typically show epidermal growth factor receptor gene amplification and mutation, loss of heterozygosity (LOH) of chromosome 10q containing phosphatase and tensin (PTEN) homolog, deletion of p16, and less frequently murine double minute 2 (MDM2) amplification.
- •
Secondary GBs develop from lower-grade astrocytomas or oligodendrogliomas, occur in younger patients, and often include mutations of TP53, retinoblastoma, and LOH of chromosome 19q.
- •
The radiomic features derived from clinical sequences, such as T2, fluid-attenuated inversion recovery (FLAIR), T1, and T1 with contrast, as well as from advanced imaging techniques, such as diffusion, perfusion, and diffusion tensor imaging, can give a detailed overview of the local and global genomic heterogeneity of the tumor environment.
Introduction
The 2003 Human Genome Project and the 2016 World Health Organization (WHO) classification have made significant impact on understanding of brain tumors. , Current brain tumor classification is based on genomic and molecular profile of tumor tissue, and these characteristics play an important role in treatment planning and prognostication. Current research in brain tumors is focused on tumor genomics to identify novel therapeutic targets, devise personalized treatment options, and thereby improve individual patient outcomes. In parallel, MR imaging of brain tumors also has seen rapid growth, with development of advanced imaging techniques that provide insight into tissue characteristics at cellular and molecular levels. MR image processing and analysis have made remarkable progress, with development of niche areas of texture analysis/radiomics and applications of machine learning techniques and artificial intelligence. Because MR imaging offers a unique noninvasive way of comprehensively evaluating tumor milieu, it is no surprise that a new field of radiogenomics has made significant strides in merging imaging with genomic mapping. One of the earliest initiatives to encourage interest in this area was The Cancer Genome Atlas (TCGA) program, which was a joint effort between the National Cancer Institute and the National Human Genome Research Institute. The Cancer Imaging Program has made radiological imaging data for glioblastoma (GB) patients enrolled in TCGA publicly available via the Cancer Imaging Archive (TCIA). This large-scale effort has paved the way for numerous impactful studies exploring potential correlations between tumor imaging features, histologic patterns, and genetic profiles and firmly established the field of radiogenomics.
Overview of glioma biology
Human gliomas can be classified into low-grade gliomas (LGGs) and high-grade gliomas based on their histopathology. LGGs are treated with maximal safe resection and eventual reoperation with adjuvant radiation and/or chemotherapy, and typically have a life expectancy of 10 years to 15 years after diagnosis. High-grade gliomas comprise anaplastic astrocytomas (grade III) and GBs (grade IV). Treatment of GB remains a challenge, with median overall survival of 14 months despite aggressive therapy. The GB treatment regimen consists of a combination of maximally safe surgical resection followed by radiation therapy and concurrent chemotherapy. Tumor heterogeneity, one of the hallmarks of GB, is the presence of multiple different cell subpopulations within a single tumor. It is caused by cancer stem cells that possess varying degrees of ability to self-renew and differentiate into different tumor cell types and also the ability for clonal evolution that may enhance genetic diversity within the affected tissues. Because tumor fragments from the same patient may have different molecular subtypes in different tumor regions, GB grading can be complex. GBs also show epithelial to mesenchymal transitions, thought to be due to signaling pathways of Wnt, transforming growth factor β, and NOTCH. This transition is partly responsible for the migration, diffusion invasion, and angiogenesis of GB. By virtue of the inherent heterogeneity of these tumors, not all of the cells within a glioma respond to chemotherapy and radiation equally and effectively, resulting in tumor progression/recurrence.
Gliomagenesis is a multifactorial process involving more than 60 genetic alterations. Primary de novo tumors accounts for more than 80% of GBs, occur in older patients and typically show epidermal growth factor receptor (EGFR) gene amplification and mutation, loss of heterozygosity (LOH) of chromosome 10q containing phosphatase and tensin homolog (PTEN), and deletion of p16, and less frequently murine double minute 2 (MDM2) amplification. Secondary GBs develop from lower-grade astrocytomas or oligodendrogliomas, occur in younger patients, and often include mutations of TP53, retinoblastoma (RB), and LOH of chromosome 19q. Because it is well-established that treatment response and overall survival depend on the molecular and genomic characteristics, identifying the radiogenomic links becomes vitally important for the radiologist and the oncologist.
Definitions and terminology
Radiogenomics is the study of relationship between imaging features (radiophenotypes) and genetic/molecular profile of disease state, typically neoplasms. In a broader sense, radiogenomics also may encompass study of genomic changes induced by radiation therapy, but a more focused definition used commonly by cancer imaging community refers to the earlier description alone. The radiophenotypes used for radiogenomics can be derived from conventional clinical imaging data or from advanced imaging techniques, such as permeability imaging, perfusion imaging, diffusion tensor imaging (DTI), and MR spectroscopy. The radiophenotypes can be radiologist derived, also known as semantic, and harvested with minimal data processing, or they can be computer-derived radiomic parameters, which quantitatively measure texture features that are not visible to human eye. The genomic profile of tumors can be determined by analysis of DNA, RNA, or protein, with emphasis on presence, absence, overexpression, or suppression of these markers. The commonly used techniques can identify targeted gene mutations or their downstream effects or provide whole-genome sequencing.
Molecular characteristics of gliomas
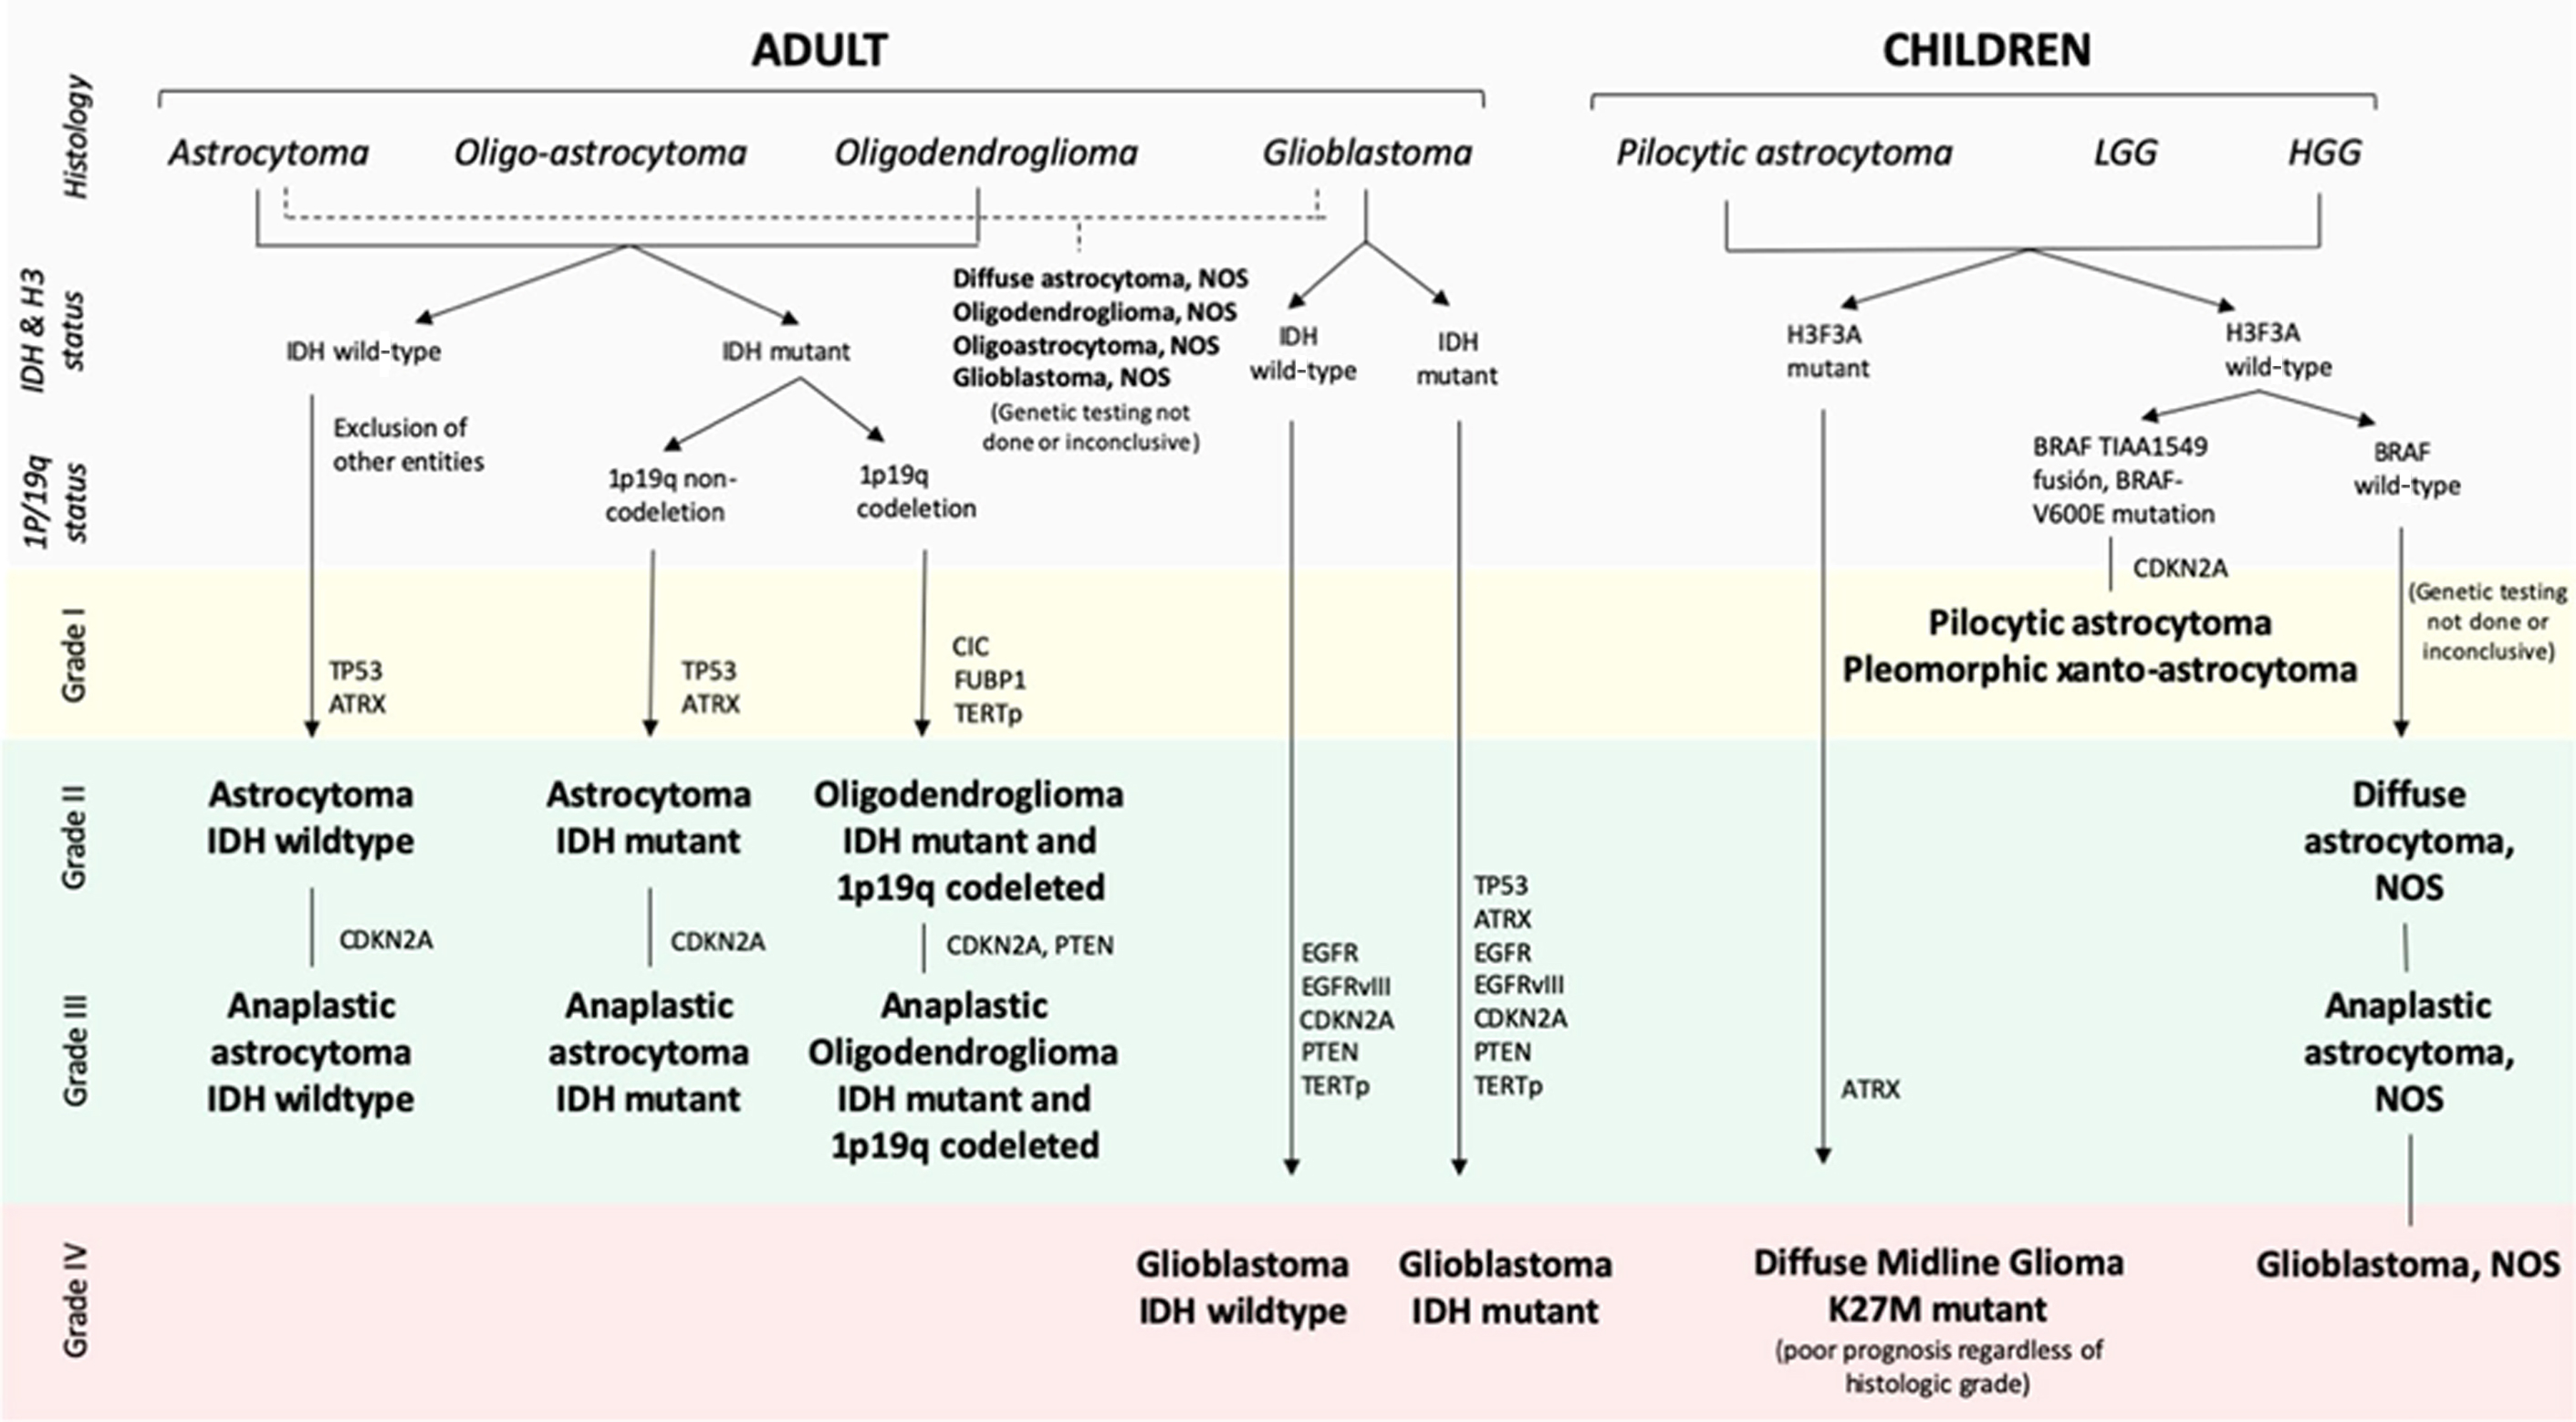
The 2016 WHO classification of brain tumors outlined specific molecular parameters for diagnosis of brain tumors in combination with the more traditionally used histologic features. This has significantly altered the overall clinical approach to diagnosis and classification of glioma subtypes.
Isocitrate Dehydrogenase Gene 1/Isocitrate Dehydrogenase Gene 2
Isocitrate dehydrogenase gene (IDH) mutation is one of the key molecular markers described in relation to gliomas. IDH is a key enzyme in the cell citric acid cycle and a mutation in IDH1 or IDH2 gene results in altered enzyme activity with accumulation of 2-hydroxyglutarate (2-HG). Accumulation of 2-HG, in turn, causes a cascade of events that results in DNA hypermethylation to affect cell differentiation and neoplasia. This mutation can be detected in clinical setting by immunohistochemistry and whole-genome sequencing. Detection of IDH1/2 has significant implications for diagnosis and prognosis of gliomas. GBs are classified as primary (wild-type) or secondary (IDH-mutant) based on IDH mutational status. IDH mutation is also indicative of a diffuse glioma (grade II and grade III) and is useful to distinguish these tumors from reactive gliosis or discrete grade I gliomas, such as pilocytic astrocytoma. Presence of IDH mutation is a favorable prognostic indicator with better overall survival and progression-free survival. More importantly, patients with a LGG (grade II or III) with a wild-type IDH have worse outcomes that are similar to grade IV tumors.
1p/19q Codeletion
1p/19q codeletion was one of the earliest chromosomal abnormalities described in patients with oligodendroglial tumors and is detected in clinical setting using fluorescence in situ hybridization. Only recently has it been shown that the codeleted tumors have key physical and chemical attributes that have an impact on migration, apoptosis, and cell-cycle regulations. Presence of 1p/19q codeletion is indicative of LGGs, supports the diagnosis of an oligodendroglial tumor, and is seen in more than 70% tumors with oligodendroglial origin. Presence of this codeletion is associated strongly with excellent response to chemotherapy with alkylating agents and remains a strong favorable prognostic factor associated with improved survival. A key study based on TCGA database found that LGGs with 1p/19q codeletion and IDH mutations had significantly higher survival (median survival of 8 years) compared with patients with IDH mutations without codeletion (median survival of 6.3 years) and patients with IDH wild-type tumors (median survival of 1.7 years). In another study, grade II and grade III gliomas were classified into 5 different subtypes based on IDH, 1p/19q, and telomerase reverse transcriptase (TERT) mutational status with distinct clinical outcomes.
O6-methylguanine-DNA Methyltransferase
O6-methylguanine-DNA methyltransferase (MGMT) is a DNA repair enzyme located on chromosome 10q, and methylation of the promoter region of the gene results in lower levels of this enzyme, resulting in less efficient DNA repair in tumor cells damaged due to cytotoxicity. MGMT methylation status is detected with pyrosequencing or by a quantitative polymerase chain reaction test. It is a positive prognostic factor and is a strong predictor of positive therapeutic response to temozolomide in new and recurrent high-grade gliomas. , MGMT methylation also frequently is seen in IDH-mutant LGGs and is associated with favorable survival. In patients with GBs treated with standard therapy, the incidence of pseudoprogression is significantly higher in tumors with methylated MGMT.
Epidermal Growth Factor Receptor and Vascular Endothelial Growth Factor
High-grade gliomas are associated with abundant and disorderly cellular and vascular proliferation. Amplification and mutation of the EGFR gene located on chromosome 7q12 induce rapid cellular growth, resulting in an aggressive proliferative neoplasm. EGFR amplification is commonly associated with classical subtype and is seen more frequently in primary GBs compared to secondary GBs. The EGFR mutated cell lines can be suppressed by EGFR inhibitors, such as erlotinib and gefitinib, raising the possibility of targeted therapeutics. Clinically, EGFR abnormalities can be detected by immunohistochemistry or EGFR staining. High-grade gliomas also are characterized by overexpression of vascular endothelial growth factor (VEGF), which is responsible for neoangiogenesis. Hypoxia in the tumor microenvironment acts as a stimulus for angiogenesis by activation of hypoxia inducible factor 1 subunit alpha. Other factors that drive hypervascularization such as angiopoietin-1 and angiopoietin-2, hepatocyte growth factor, and platelet-derived growth factor (PDGF) are also activated by hypoxia. The ultimate result of this process is a neoplasm with profuse leaky aberrant vasculature with deficient blood-brain barrier. Bevacizumab is an antiangiogenic agent that targets VEGF overexpression and often is used in treatment of recurrent GBs.
Other Key Mutations
Other key molecular aberrations and genetic mutations in gliomas include alpha-thalassemia mental retardation (ATRX), TERT, TP53, and neurofibromatosis type 1 (NF1) histone H3 K27M, among several others. , X-linked gene of ATRX mutations affect DNA repair and are found in low-grade astrocytomas. TERT mutations result in intact length of telomeres, which confers the ability to divide ad infinitum. These often are seen in gliomas in combination with ATRX mutations. Based on the findings from TCGA study, the key signaling pathways that drive tumor growth in GBs are the RB pathway, the TP53 pathway, and the PTEN/NF1/RTK (receptor tyrosine kinase) pathway. The RB and TP53 are known tumor suppressor genes, and mutations in this pathway result in increased mitotic activity and suppressed apoptosis, respectively. The PTEN/NF1/RTK pathway abnormalities simultaneously cause increased cell growth, modulate cell cycle, and affect tumor suppression. Lastly, histone H3 gene mutations cause abnormalities of DNA packing and are seen in pediatric diffuse intrinsic pontine gliomas and pediatric GBs. Recent WHO classification has defined a new entity called diffuse midline glioma with H3 K27M-mutant. Although these tumors demonstrate low grade on histology, they are considered grade IV due to their aggressive behavior.
Transcriptomic Subtypes
Depending on the molecular and genomic characteristics, GBs can be classified into classical, mesenchymal, neural, and proneural. Each subtype is associated with a distinct set of molecular features with distinct clinical behaviors. For example, the proneural subtype is associated with IDH mutations, includes a majority of secondary GBs, and is associated with best prognosis. The mesenchymal type, on the other hand, is associated with increased mutations of PTEN, TP53, and NF1 genes and correlates with poor radiation response and shorter survival. The neural subtype is characterized histologically by higher astrocyte and oligodendroglial differentiation and is highly infiltrated by healthy brain cells. , Fig. 1 provides an overview of current classification of adult and pediatric gliomas.
Approach to radiogenomic analysis
Simply put, a radiogenomic study allows for assessment of relationship between imaging patterns and genomic signatures in disease states, typically cancer. These studies are focused primarily either on identifying the possible molecular associate with the specific radiographic correlate or studying how a particular genomic variation might have an impact on the tumors’ imaging characteristics. The first category of studies can be classified as exploratory, whereas the second category of studies can be classified as hypothesis driven. Early radiogenomic literature focused primarily on a single imaging characteristic (for example, presence of necrosis) and correlated the presence or absence of this feature with the corresponding tissue molecular and genomic features. These studies predominantly used semantic features to harvest tumor radiophenotypes (for example, the Visually Accessible Rembrandt Imaging [VASARI] feature set) and incorporated targeted tissue sampling using neuronavigational techniques to sample areas with specific imaging features. Subsequent radiogenomic studies using semantic features explored associations between imaging phenotypes and more targeted genomic characteristics with direct implications for treatment planning and outcome. More recent studies have focused on exploring correlations between computer-derived radiomic features and large-scale gene expression patterns. A smaller subset of these studies falls under the category of a directed or hypothesis-driven approach, where more specific gene expression profiles or genetic pathways are targeted for analysis using quantitative metrics derived from conventional and advanced imaging sequences.
Radiogenomic studies using semantic features
TCGA initiative led to the development of the VASARI feature set, which consisted of 24 common MR imaging observations routinely made during clinical interpretations ( https://www.cancerimagingarchive.net/ ). These observations were made using standard contrast-enhanced MR imaging acquisitions and included features, such as location, laterality, proportion and quality of enhancement, proportion of necrosis, cysts, diffusion, and so forth. These feature sets were utilized to create subjective and objective markups of baseline MR imaging–GB studies stored in TCIA for TCGA and linked to the Repository of Molecular Brain Neoplasia Data (REMBRANDT) set. These imaging data sets were utilized mainly to understand the correlation of imaging phenotypes with survival, molecular subtypes, mutation status, and copy number expression. Some of the key VASARI imaging features that have demonstrated correlation with brain tumor genomics are location, tumor volume, edema, and necrosis, enhancing versus nonenhancing areas, and diffusion characteristics. Although perfusion imaging was not included in the VASARI data set, perfusion characteristics of tumor have also emerged as key semantic feature for radiogenomic correlation.
Location and Volume
Tumor volume and location of tumor are shown to be robust imaging phenotypes that have strong correlation with genomic features. For tumor volume analysis, fluid-attenuated inversion recovery (FLAIR) and postcontrast T1-weighted images are used most commonly to segment out enhancing tumor volume, nonenhancing tumor volume, and necrosis with manual or automated techniques and then correlated with genomic profile. For studies based on tumor location, features, such as location, laterality, involvement of eloquent cortex, multifocality, periventricular involvement, and extension across midline, have been used to explore genomic correlations. For example, MGMT methylated IDH-mutant tumors are located primarily in the frontal lobe or subventricular region of the frontal horns of the lateral ventricles and are less likely to invade eloquent areas of the brain, whereas amplified and variant EGFR-expressing tumors occurred most frequently in the left temporal lobe. ,
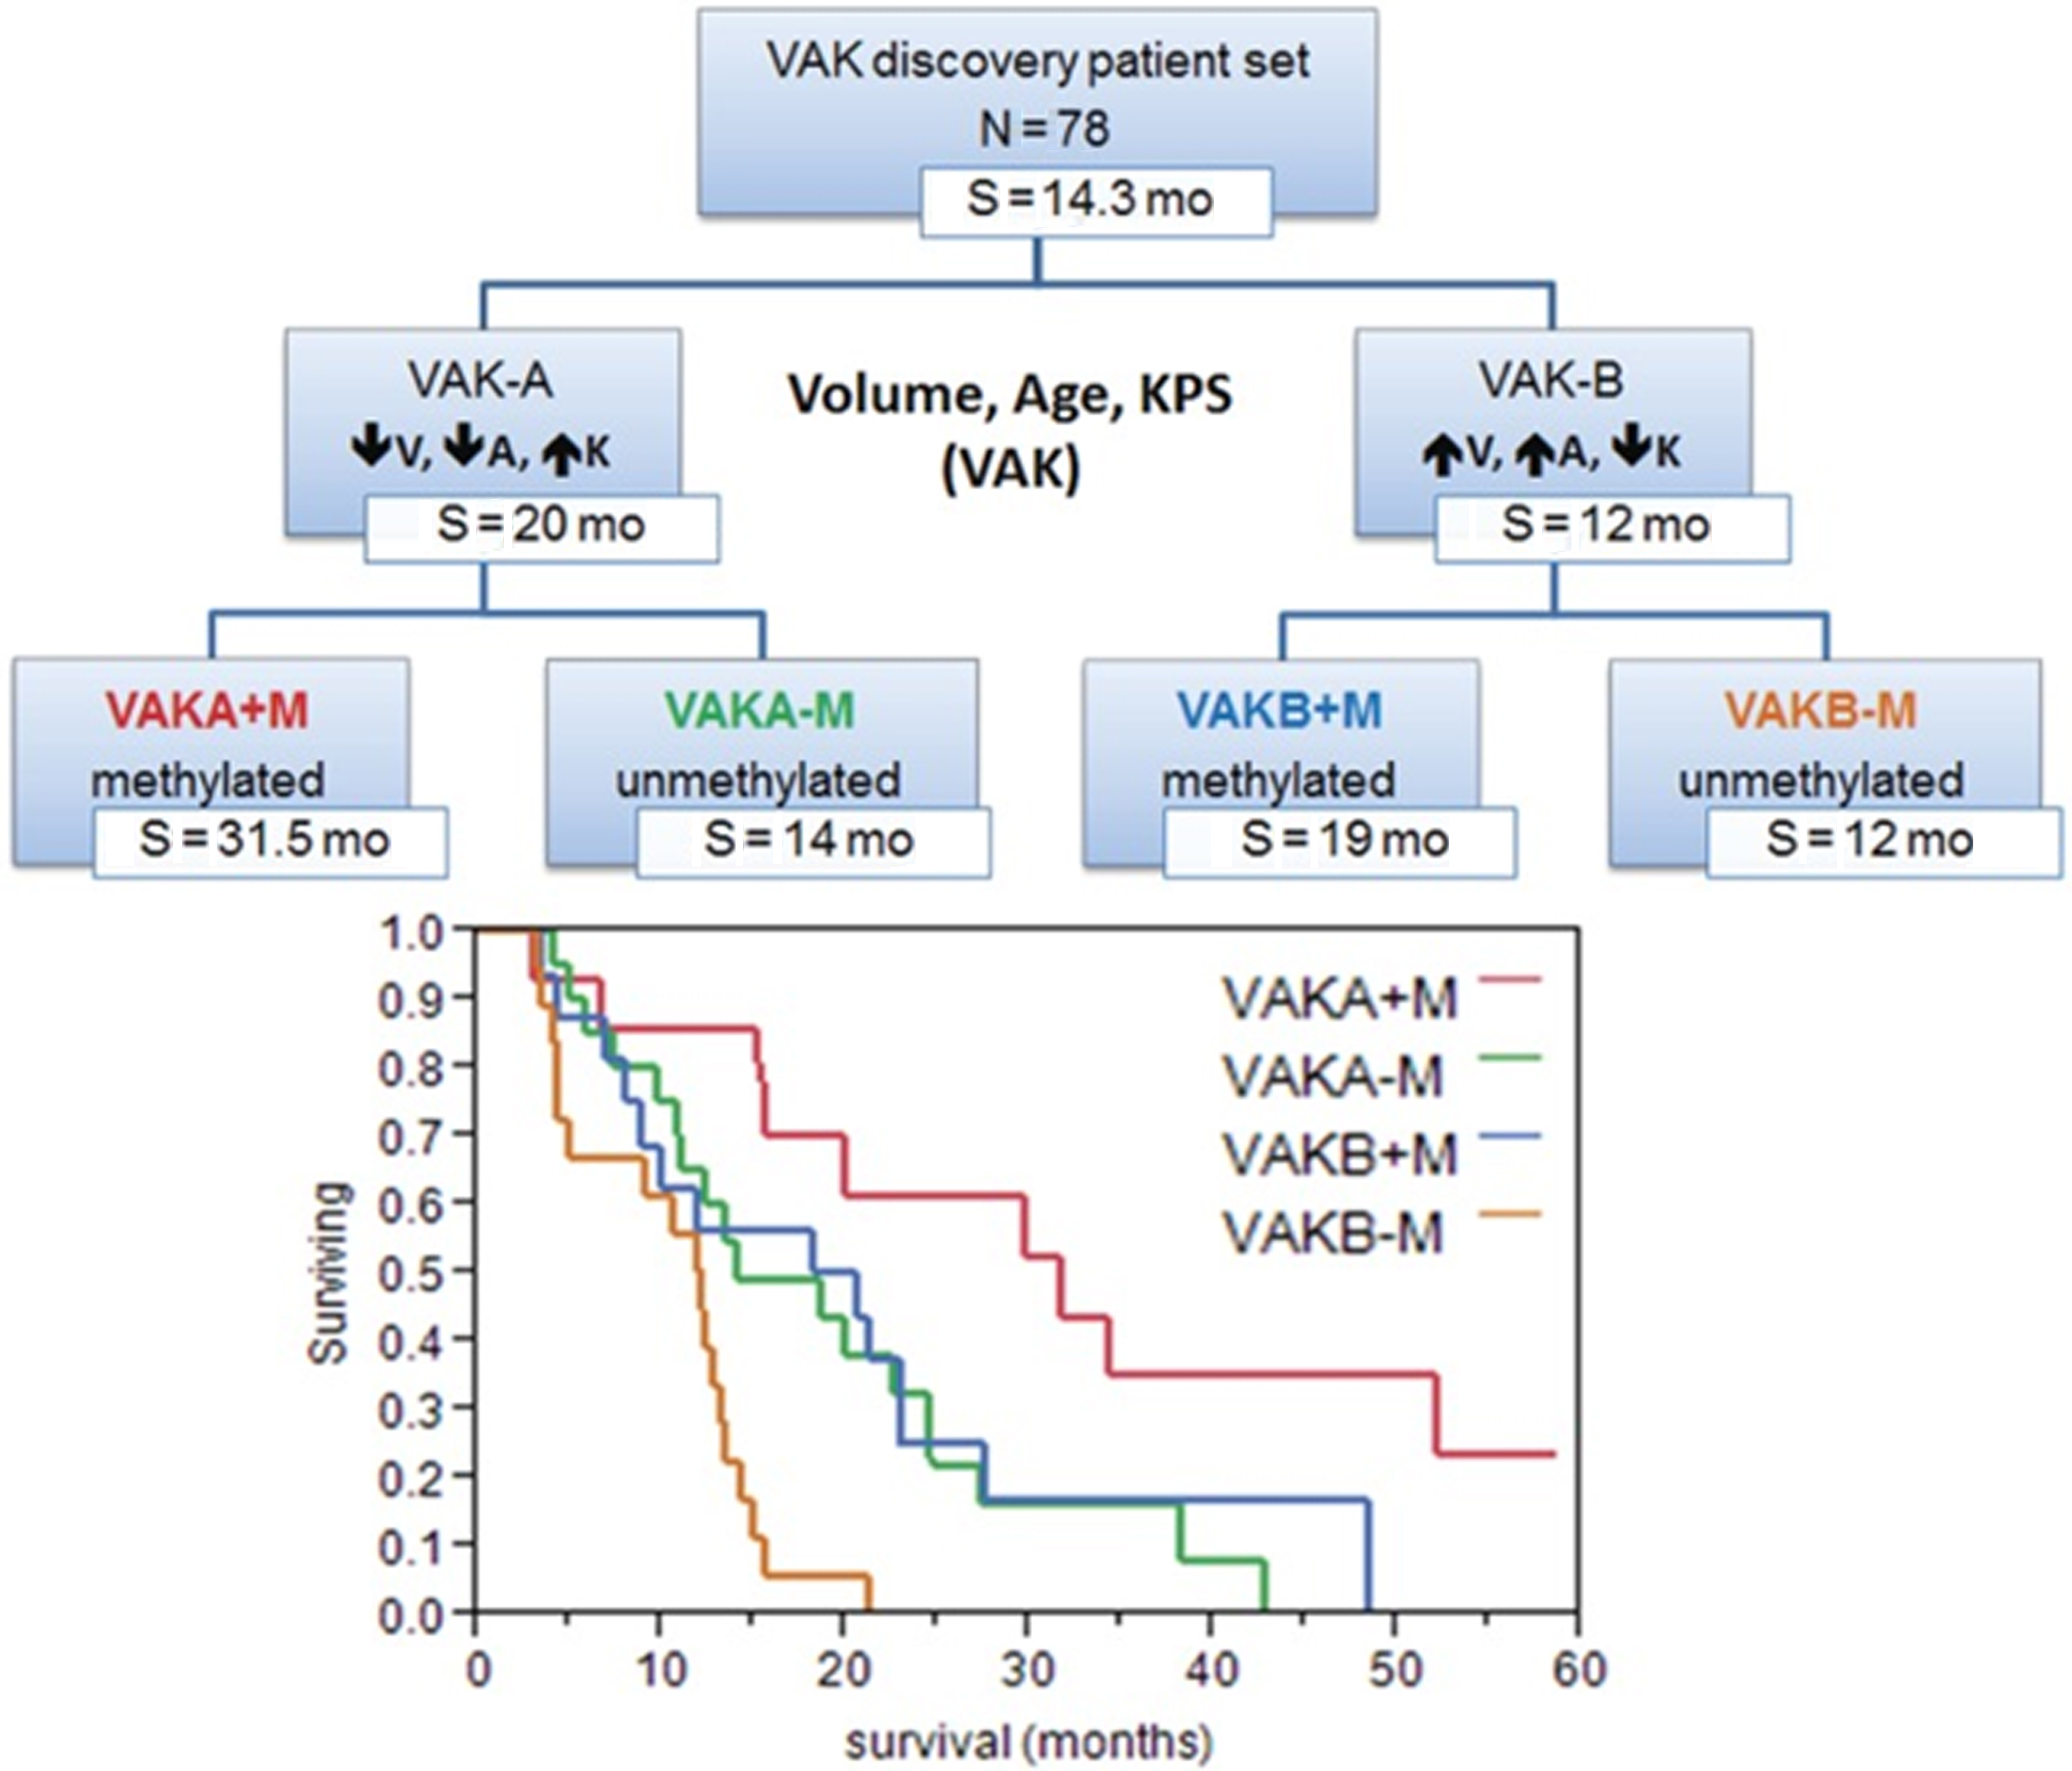
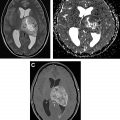
In 2012, Zinn and colleagues studied 78 GB patients from TCIA data set and generated a prognostic model for patient survival based on the volume of enhancing tumor (including the necrotic core), patient age, and Karnofsky performance scale status (VAK). Larger volume tumor, age of 60 years or more, and Karnofsky performance scale status less than 100 were noted and patients with none or only 1 feature were categorized as VAK-A, whereas patients with 2 or all 3 features were categorized as VAK-B. The investigators also identified differences in gene and mRNA expression profile between these 2 groups. They found class VAK-A was associated with P53 activation whereas class VAK-B was associated with P53 inhibition. Adding MGMT-promoter methylation status to VAK-A stratified the data further, such that the MGMT methylated VAK-A cohort was found to have significantly longer survival compared with other 3 groups ( Fig. 2 ).
Enhancement Characteristics
Enhancing and nonenhancing components of GB have been extensively studied in relation to gene expression. In one of the earliest efforts, Pope and colleagues compared the imaging findings of 52 GBs with microarray analysis of tissue derived from areas with different enhancement characteristics. They specifically analyzed the gene expression between lesions with complete enhancement and lesions with incomplete ring enhancement and confirmed that interleukin-8 and VEGF gene expression were higher in the former subset compared with the later. Barajas and colleagues also had similar results demonstrating the intertumoral and intratumoral regional differences in genetic and cellular expression patterns. They further confirmed that the contrast enhancing regions had more complex vascular hyperplasia as well as increased hypoxia and tumor cell density and up-regulation of VEGF and various collagen genes.
Peritumoral Edematous/Tumor-Infiltrated Tissue
The nonenhancing T2-FLAIR hyperintensity surrounding the enhancing tumor core often represents a mixture of edema and tumor infiltration, particularly in GBs. This region is of particular interest because it often includes the site of future recurrence, which invariably occurs in GBs. Various studies have explored the radiogenomic characteristics of this region. Zinn and colleagues demonstrated that there was up-regulation of PERIOSTIN (POSTN) gene set and down-regulated microRNA-219 in the T2-FLAIR hyperintensity. PERIOSTIN was found to be promoting mesenchymal transition and invasion in GB and POSTN expression was up-regulated significantly in the mesenchymal subtype of GB. Pope and colleagues found that the incompletely enhancing tumor regions (regions defined as nonenhancing FLAIR hyperintense areas with suspicion of tumor infiltration) had distinct genetic profile compared with the enhancing tumor regions and demonstrated higher expression levels of the stem cell and oligodendrocyte lineage marker OLIG-246 as well as genes associated with secondary GB.
Necrosis
Necrosis is a hallmark of GB and is closely associated with shortened patient survival in high-grade gliomas. , Colen and colleagues studied the phenomenon of cell death in GBs with respect to sex-specific differences and found overall lower volumes of necrosis on imaging in women compared with men. Women with higher volumes of necrosis had poor outcomes compared with men (6.5 months vs 14.5 months, respectively; P = .01). Larger area of necrosis in women was associated with MYC, an oncogenic transcription factor (via an oncogenic pathway), whereas in men it was associated with Tp53 (via an apoptotic pathway). Van Meter and colleagues explored intratumor genetic variations between the enhancing peripheral mass and a poorly enhancing central tumor core on contrast-enhanced T1-weighted MR imaging and found increased expression of genes associated with cell migration, angiogenesis, cell survival, and integrin signaling in the enhancing core, with the poorly enhancing and low perfused core having an elevated rate of expression for hypoxia-induced gene. Yamashita and colleagues found correlation between IDH1 status and area of necrosis. Barajas and colleagues confirmed these findings by reporting the increased expression of genes associated with mitosis, angiogenesis, and apoptosis.
Restricted Diffusion on Diffusion-Weighted Imaging–Apparent Diffusion Coefficient
In tumor imaging, lower apparent diffusion coefficient (ADC) values are known to reflect areas of hypercellularity. Zinn and colleagues studied ADC values in the nonenhancing, FLAIR hyperintense lesions of the tumor in 35 GB patients and found that lower ADC values (restricted diffusion) were seen in the peritumoral edematous/tumor-infiltrated tissue. These lower ADC values were correlated further with distinct genomic networks and differentially expressed genes that play a role in invasion. ADC measurements have shown promise in predicting MGMT methylation status and patient survival. Heiland and colleagues studied the role of DTI-derived parameters in identification of gene expression pathways in 21 patients, which were correlated with biopsy tissue. They documented that GB with high fractional anisotropy had a worse prognosis and was associated with activation of the epithelial mesenchymal pathway, whereas higher mean diffusivity was suggestive of more favorable prognosis. Hong and colleagues were able to demonstrate ADC differences based on IDH1 and ATRX profiles of GBs.
Perfusion Status of the Tumor
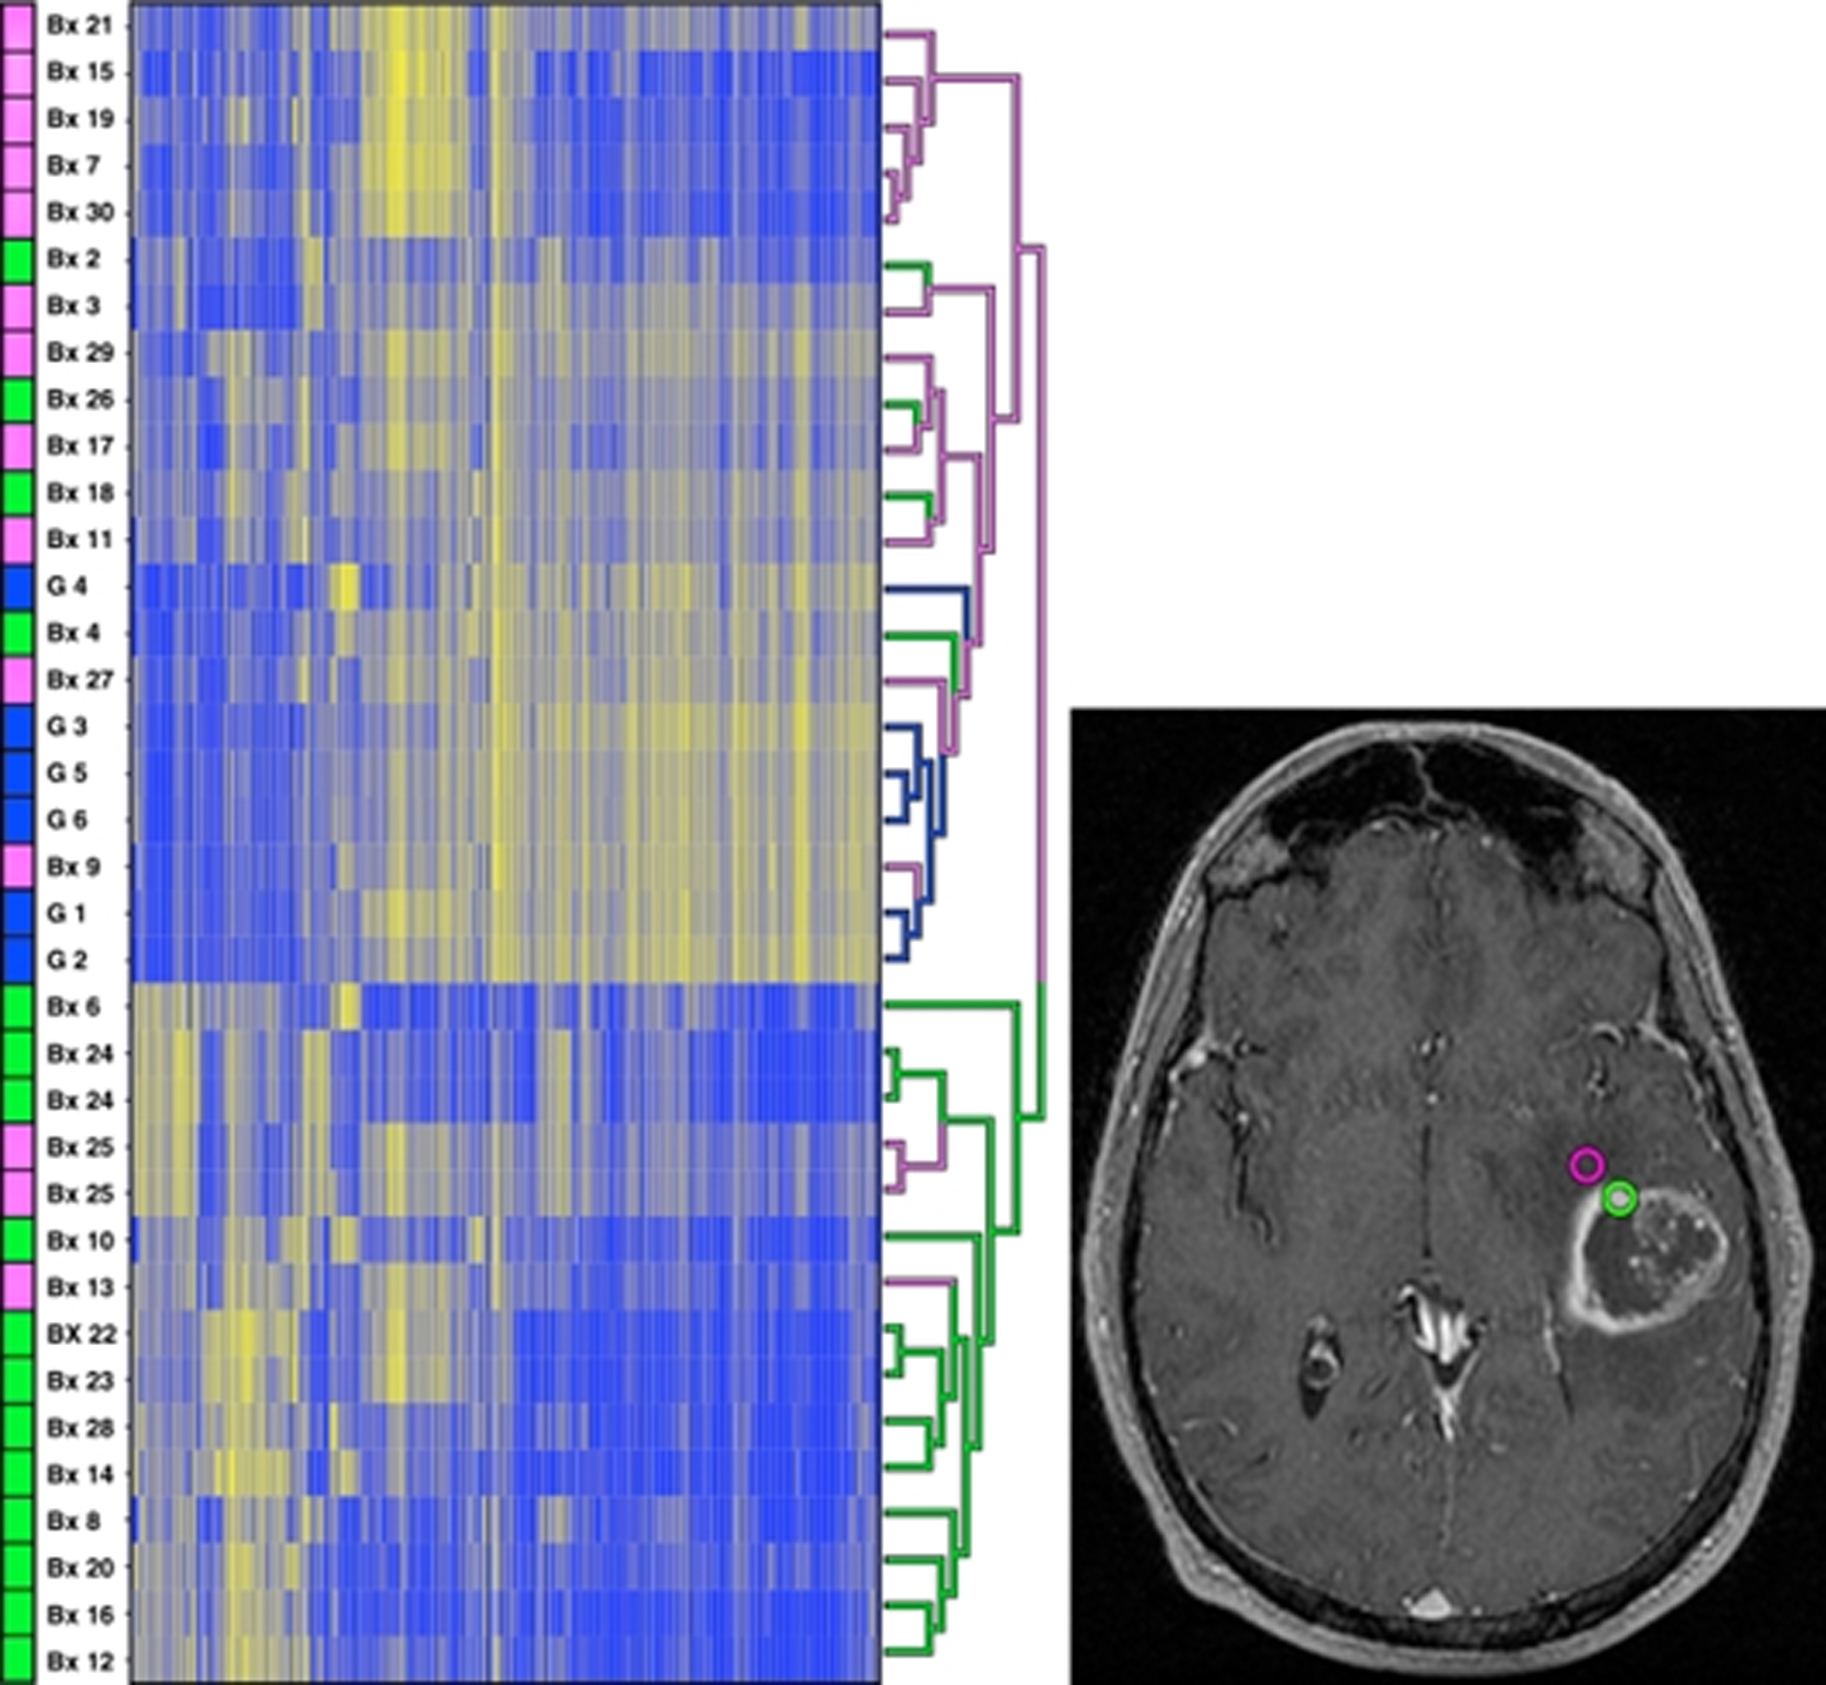
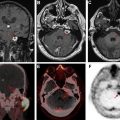
Dynamic contrast–enhanced and dynamic susceptibility contrast MR perfusion are employed routinely in the presurgical evaluation and post-treatment follow-up of the brain tumors. Among all the perfusion parameters, cerebral blood volume (CBV) has been the most extensively studied. Barajas and colleagues studied enhanced and nonenhanced portions of the tumor and correlated them with CBV and peak height values, and decreased percentage of signal recovery and ADC values. They documented that the genes associated with mitosis, angiogenesis, and apoptosis were significantly upregulated in contrast-enhanced regions compared with nonenhanced portion of the tumor ( Fig. 3 ). , In a feasibility study using perfusion CT, Jain and colleagues demonstrated positive correlation between higher perfusion parameters and proangiogenic genes and a negative correlation between these parameters and antiangiogenic genes. Jain and colleagues using dynamic susceptibility contrast–enhanced T2-weighted MR perfusion from TCIA TCGA-GB collection, correlated tumor blood volume with patient survival, and determined its association with molecular subclasses of GB. They measured the mean relative CBV (rCBV) of the contrast-enhanced and nonenhanced regions and correlated with the genomic subclassification. They found that rCBV values had no statistical significance with regard to their molecular classification, but the rCBV max measurements were found to be a strong predictor of overall survival regardless of the molecular subtype. Yamashita and colleagues demonstrated the correlation between IDH1 status and tumor blood flow. Kong and colleagues documented that CBV and cerebral blood flow–related radiomic features were significantly related to up-regulation of PDGF, EGFR, and VEGF pathways and down-regulation of the PTEN pathway.
Related posts:
 Clinical Review of Computed Tomography and MR Perfusion Imaging in Neuro-Oncology
 Imaging Findings of New Entities and Patterns in Brain Tumor
 Cellular and Molecular Imaging with SPECT and PET in Brain Tumors
 Imaging Mimics of Brain Tumors
 PET Imaging for Head and Neck Cancers
 Novel Tracers and Radionuclides in PET Imaging
Stay updated, free articles. Join our Telegram channel

Full access? Get Clinical Tree


