Fig. 1
(a) Scheme of the anterior anatomical relations of the kidneys: R right, L left. (b) Scheme of the posterior anatomical relations of the kidneys: R right, L left. (c) Scheme of the main components of the renal parenchyma (renal cortex, renal columns, and renal medulla divided in multiple renal pyramids) overlied by the renal capsule (black color)
The renal parenchyma is composed of different components (Fig. 1c). The renal capsule is a tough fibrous layer surrounding the kidney (fibrous renal capsule) and covered by a thick layer of perinephric adipose tissue (fat renal capsule). The kidney is covered by the renal capsule formed by the fibrous and adipose renal capsule. The fibrous capsule represents the connective tissue investment of the kidney, continuous through the hilum to line the renal sinus. The adipose renal capsule represents the investment of fat surrounding the fibrous capsule of the kidney, continuous at the hilum with the fat in the renal sinus. The renal cortex is the outer portion of the kidney between the fibrous renal capsule and the renal medulla. In the adult, it forms a continuous smooth outer zone with a number of projections (cortical columns) that extend down between the pyramids. The renal cortex is the part of the kidney where ultrafiltration occurs. It contains the renal corpuscles and the renal tubules except for parts of the loop of Henle, which descend into the renal medulla. It also contains blood vessels and cortical collecting ducts. The renal column (or Bertin column or column of Bertin) is an extension of the renal cortex between the renal pyramids, and it allows the cortex to be better anchored. Each column consists of lines of blood vessels and urinary tubes and a fibrous material.
The renal medulla is the innermost part of the kidney. The renal medulla is split up into a number of sections, known as the renal pyramids (Fig. 1c) about 8–18 in number. The broad base of each pyramid faces the renal cortex (outer medulla), and its apex, or papilla (inner medulla), points internally. The pyramids appear striped because they are formed by straight parallel segments of nephrons. Renal pyramids (or malpighian pyramids) are cone-shaped tissues of the kidney, and the renal papilla is the location where the medullary pyramids empty urine into the renal pelvis. Histologically, it is marked by medullary collecting ducts converging to channel the fluid.
Segmentation and duplications of the renal pelvis and/or ureters are secondary to segmentation of the wolffian duct, which forms the collecting system. The renal pelvis is generally triangular, and it tapers smoothly to its junction with the ureter defined as ureteropelvic junction. The pelvis exits from the kidney anteromedially. The right renal pelvis is usually located opposite to the L2 vertebra, and the left renal pelvis is usually 0.5–1 cm higher (Friedenberg and Dunbar 1990). The renal calyx is a concave structure receiving the tip of the papilla of the renal medulla, and the fornices represent the side projections of the calyx surrounding the papilla. Two wide cup-shaped major renal calices are subdivided into 7–14 minor calices. Each single calyx or multiple minor calyces drain by means of an infundibulum into the renal pelvis. The renal sinus is the compartment that surrounds the pelvocalyceal system of the kidney, is filled by peripelvic fat, and communicates medially with the perinephric space. It contains the vascular and nervous structures that enter within the renal sinus, the lymphatics, the renal pelvis, and the surrounding fat. Cysts and sinus lipomatosis are the most common abnormalities in this space. The ureter also presents a restriction where it crosses the iliac vessels and enters the anatomical pelvis at the ureterovesical junction.
In each kidney, the main renal artery divides into the posterior and anterior branches that run posteriorly and anteriorly to the renal pelvis (Fig. 2). The superior, anterior superior, anterior inferior, and inferior vascular areas of each kindey are vascularized by the segmental arteries originating from the larger anterior branch. The posterior vascular area is vascularized by the smaller posterior branch of the main renal artery (Fig. 2a). The junction of the anterior and posterior branches of the main renal artery in the renal parenchyma creates a relatively avascular plane (Brodel’s line), which is the preferred track of placing percutaneous nephrostomies and should be considered when performing biopsies of a native or transplanted kidney.
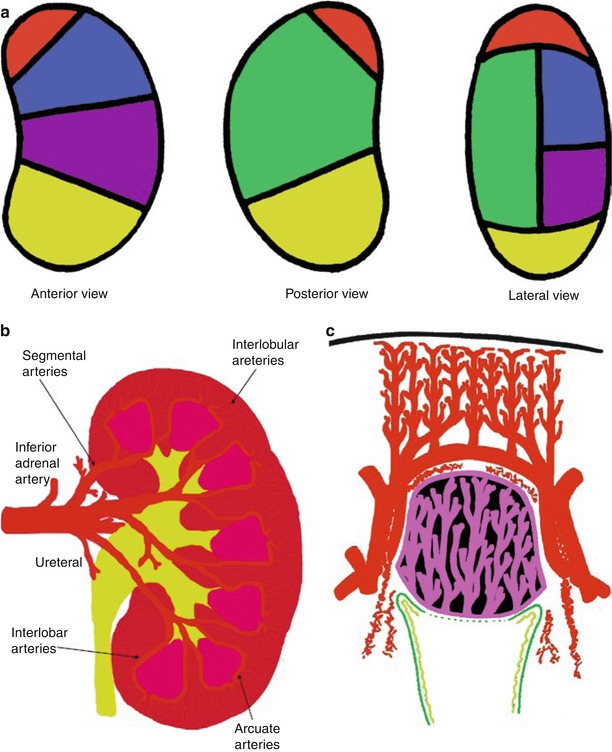
Fig. 2
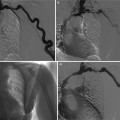
(a–c) Normal intrarenal arterial vessels. (a) Vascular areas of the renal parenchyma vascularized by the different segmental arteries and represented according to the anterior posterior and lateral views. The vascular areas are described as superior (red), anterior superior (blue), posterior (green), anterior inferior (violet), and inferior (yellow). (b) Segmental, interlobar, interlobular, and arcuate arteries represent the different branches of the renal arteries. (c) The renal medulla presents a relationship with the interlobar and arcuate arteries while the interlobular arteries reach the renal cortical surface
The superior, anterior superior, anterior inferior, inferior and posterior vascular areas of the kidney are vascularized by the segmental arteries of the same name (Fig. 2a), which subdivide into interlobar arteries (Fig. 2b). Each interlobar artery penetrates the kidney through a column of Bertin and divides at the corticomedullary junction into arcuate arteries, which eventually run parallel to the surface (Fig. 2b). The arcuate arteries, in turn, supply interlobular arteries that penetrate the cortex perpendicularly to the renal surface (Fig. 2c). Branching from each interlobular artery are numerous small arterioles, the afferent arteries. The fibers of the nervous renal plexus, including sympathetic nervous fibers triggering vasoconstriction, course along the renal artery to reach each kidney. The renal branches of the vagus nerve are small branches providing parasympathetic innervation to the kidney. Sensory input from the kidney travels to T10–11 levels of the spinal cord.
The renal lymphatics have not been fully documented in humans (Ischikawa et al. 2006). The distribution of the normal renal lymphatic system has been investigated in various animals using light microscopy by the ureteric occlusion technique, electron microscopy, and microradiography (Hogg et al. 1982). In humans, microradiography has been performed to detect the renal lymphatics at autopsy (Cuttino et al. 1989). Lymphatic vessels are abundant around the intrarenal arteries/veins, while they are scarce in the interstitium around the glomeruli or between the tubules (Ischikawa et al. 2006), since the lymphatic system begins in the cortical interstitium around the glomeruli or between the tubules. Lymph nodes for the kidneys include the renal hilar nodes and the abdominal para-aortic (periaortic) nodes including the interaortocaval, paracaval, precaval, retrocaval, preaortic, and retroaortic lymph nodes. The ureters are drained prevalently by the renal hilar and paracaval lymph node groups (Fig. 3).
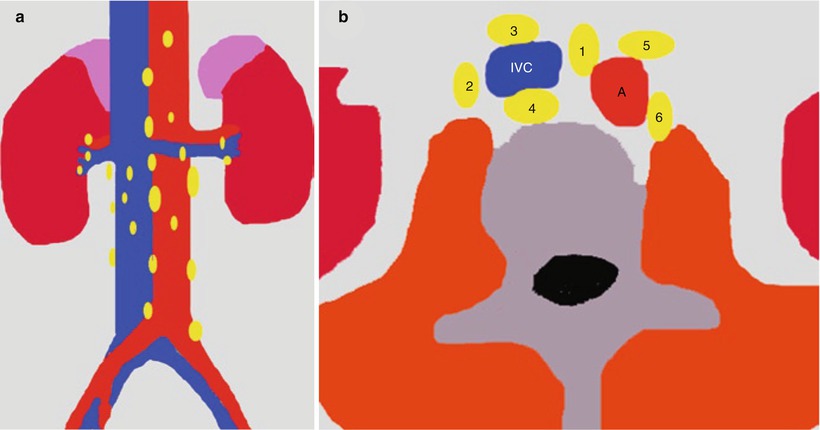
Fig. 3
(a) Regional lymph nodes of the kidneys; (b) abdominal para-aortic (periaortic) lymph nodes including the interaortocaval (group 1), paracaval (group 2), precaval (group 3), retrocaval (group 4), preaortic (group 5), and retroaortic lymph nodes (group 6). IVC inferior vena cava, A aorta
1.1.2 Microscopic Renal Anatomy and Nephron Physiology
The cortex of each human kidney contains the glomeruli of 1–1.5 million nephrons. The afferent artery intimately interacts with the glomerular portion of the nephron, where the afferent artery breaks into a capillary network named the glomerular capillary tuft from which originates the efferent artery. The glomerular vessels are contained within Bowman’s capsule forming the Malpighian corpuscle (Fig. 4a). The Malpighian corpuscles represent small, round, deep red bodies in the cortex of the kidney, each communicating with a renal tubule. They average about 0.2 mm in diameter, with each capsule composed of two parts: a central glomerulus and a glomerular capsule, also called Bowman’s capsule. Bowman’s capsule represents the glomerular portion of the nephron and is a double-walled, cup-shaped structure around the glomerulus of each nephron and at the beginning of the tubular component of a nephron. The filtration barrier is composed of three layers corresponding to capillary endothelium; the basement membrane composed of glycoproteins, collagens, and mucopolysaccharides; and the epithelium of Bowman’s capsule. The basement membrane presents an average thickness in adults of 3,200 Å and contains three distinct areas: a central electron dense lamina densa and, on either side, a lamina rara externa and lamina rara interna (Fig. 4a). Thickening of the basement membrane is seen in a number of glomerular diseases.
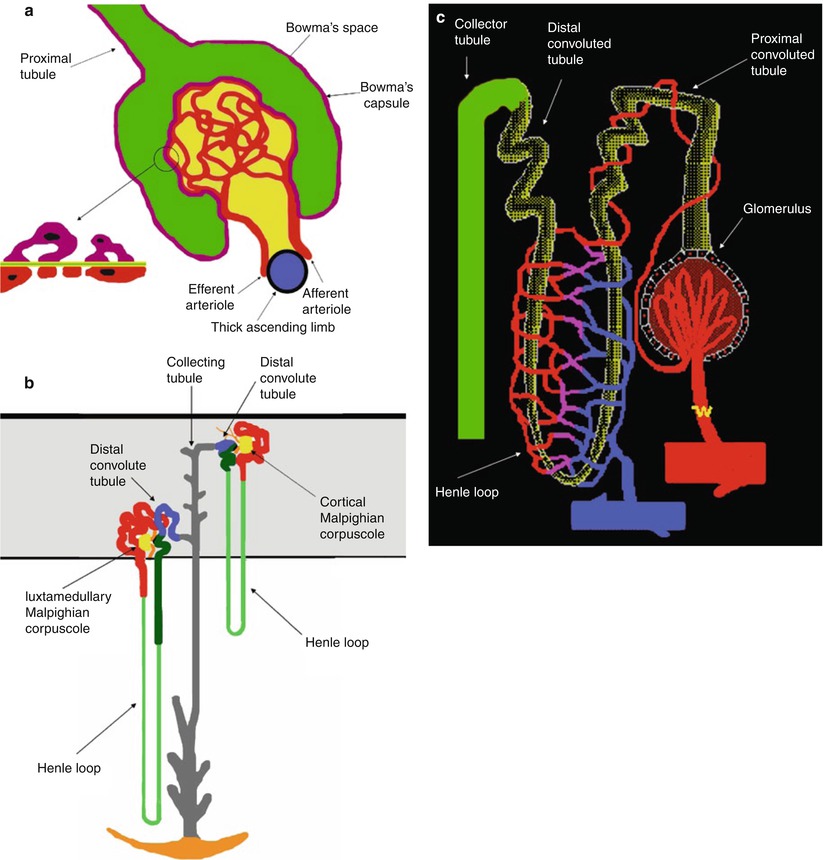
Fig. 4
(a) Scheme of the Malpighian corpuscle. Mesangium with mesangial cells is represented in dark yellow. The filtration barrier is composed of three layers corresponding to the capillary endothelium (red), the basement membrane, and the epithelium of Bowman’s capsule (violet). The basement contains three distinct areas, a central electron dense lamina densa (green) and a lamina rara externa and lamina rara interna (light yellow). The epithelial cells that surround the capillary tuft differ from those forming the rest of Bowman’s capsule, because they present numerous foot processes or pedicles which come into contact with the lamina rara externa of the basement membrane and are called podocytes. (b) Scheme of cortical and juxtamedullary nephrons within the renal cortex (gray color), the proximal tubule (red), the loop of Henle (thin descending limb, light green; thick ascending limb, dark green), the distal convoluted tubule (blue), and the connecting and collecting tubule (gray). The juxtaglomerular apparatus is represented in black. The loop of Henle begins at the end of the proximal straight tubule. In cortical nephrons the hairpin turn that forms the tip of the loop of Henle occurs not deeper than the junction between the outer and inner zones of the medulla, whereas in the juxtamedullary nephrons the hairpin turn may occur as deeply as the tip of papilla. (c) Scheme of the branches of the efferent arteries vascularizing the different regions of the nephrons forming the peritubular capillaries
The epithelial cells that surround the capillary tuft differ from those forming the rest of Bowman’s capsule, because they present numerous foot processes or pedicles which come into contact with the lamina rara externa of the basement membrane and are called podocytes (Fig. 4a). Between the foot processes is a space, named filtration split or split pore, 250–400 Å wide which is covered by a thin membrane, named the filtration slit diaphragm and located approximately 600 Å from the basement membrane. Interspread between the adjacent capillaries, the mesangium, containing mesangial cells and mesangial matrix, appears to provide support for the glomerular capillaries. Usually, the term glomerulus includes both the nephron and capillary components. At the glomerulus, the blood reaches a highly disfavorable pressure gradient and a large exchange surface area, which forces the serum portion of the blood out of the vessel into the renal tubules. About 20 % of the water in plasma entering the afferent artery filters out the glomerular capillary into the Bowman’s space.
Fluids from blood in the glomerulus are collected in the Bowman’s capsule forming the glomerular filtrate and further processed along the nephron to form urine. This process is known as ultrafiltration, which is performed by the glomerulus and then by the nephron (Fig. 4b). Flow continues through the renal tubules, including the proximal convoluted tubule, to the loop of Henle with the thick ascending and thin descending limb and finally leaves the kidney by means of the collecting duct, leading to the renal ureter. The proximal tubule has traditionally been divided into the proximal convoluted tubule, which contorts itself in an apparently random fashion in the renal cortex, and the proximal straight tubule (or pars recta). The epithelial cells of the proximal tubule have a cuboidal shape (Laiken and Fanestil 1985). A layer of closely packed microvilli covers the luminal surface forming a brush border. The proximal tubule is responsible for the initial processing of the glomerular filtrate, and it both reabsorbs approximately two thirds of the filtered water and sodium (with bicarbonate instead of chloride) and almost all the filtered glucose and amino acids from the tubular fluid and secretes organic acids (e.g., uric acid) and bases such as drugs (including diuretics) and drug metabolites into the tubular fluid. Sodium reabsorption in the proximal tubule occurs in cells and intercellular spaces. Entry of sodium across luminal membranes is passive and occurs by diffusion, coupled to the transport of other solutes (e.g., glucose, amino acids, phosphate), and in exchange with protons secreted from cell to lumen and reabsorption of bicarbonate. Sodium extrusion from cells into the intercellular spaces and across the basolateral membrane is an active process, which is accomplished by the sodium–potassium pump (Na+−K+-ATPase). Chloride is reabsorbed due to the diffusion gradient from the tubular lumen to the peritubular capillary.
The loop of Henle consists of a descending limb and an ascending limb. Most renal physiologists consider the loop of Henle to begin at the end of the proximal straight tubule (Laiken and Fanestil 1985) (Fig. 4b). Here the cuboidal epithelial cells of the proximal tubule are replaced by flat, squamous epithelial cells with a small number of short microvilli. This segment of the tubule is called the thin descending limb since the epithelial cell layer is very flat. The thin descending limb of the juxtamedullary nephrons is substantially longer than that of cortical nephrons (Fig. 4b). In cortical nephrons the hairpin turn that forms the tip of the loop of Henle occurs not deeper than the junction between the outer and inner zones of the medulla, whereas in the juxtamedullary nephrons the hairpin turn may occur as deeply as the tip of the papilla. In juxtamedullary nephrons the ascending limb begins with a segment of flat, squamous epithelial cells, termed the thin ascending limb. At the junction between the inner and outer zones of the renal medulla, the thick ascending limb begins (Laiken and Fanestil 1985). In this segment, the epithelial cells are cuboidal and contain numerous mitochondria like the epithelial cells of the proximal tubule, even though these cells lack a luminal brush border. The thick ascending limb transverses the outer zone of the medulla (the medullary portion of the thick ascending limb) and then ascends through the renal cortex to the level of its nephron’s glomerulus. In cortical nephrons, the ascending limb consists entirely of cuboidal epithelial cells, and cortical nephrons lack a thin ascending limb (Laiken and Fanestil 1985). The loop of Henle dissociates the absorption of sodium and water. The descending limb of Henle passively abstracts water into the hypertonic medullary interstitium, concentrating the tubular fluid, while the essentially water-impermeable thick ascending limb of Henle actively absorbs approximately 25 % of filtered sodium chloride but little water (Andreoli 1992). In the thick ascending limb of the loop of Henle, sodium and potassium cross the luminal cell membrane together with two chlorides by a carrier-mediated uptake (Na+/K+/2Cl–) under the energy of sodium–potassium ATPase on the basolateral membrane. The loop diuretics inhibit the apical cotransport system, thereby enhancing the sodium and chloride secretion.
In each nephron the thick ascending limb returns to the glomerulus of its own origin and contacts its originating glomerulus at the vascular pole, the region where the afferent and efferent arterioles, respectively, enter and leave the glomerulus (Fig. 4a, b). A specialized structure, the juxtaglomerular apparatus, is found at this contact point consisting of three components: the macula densa, the extraglomerular mesangial cells, and the granular cells secreting renin. The juxtaglomerular apparatus is made up of specialized cells in the wall of the afferent arteriole and granular cells in the wall of the distal tubule (the macula densa). This area is innervated by adrenergic fibers and the granular cells carry renin in intracellular granules.
The distal nephron includes the distal convoluted tubule, the connecting tubule, and the collecting tubule (or duct) which can be subdivided into cortical collecting tubule, medullary collecting duct, and papillary collecting duct. The distal convoluted tubule primarily absorbs sodium by the sodium–potassium pump (Na+−K+-ATPase) under the influence of aldosterone and secretes protons, ammonia, and potassium in the tubular lumen. Aldosterone and other mineralocorticoids stimulate the rate of sodium absorption in the distal nephron. Aldosterone also increases the rate of net potassium secretion and net proton secretion (and consequently the rate of bicarbonate regeneration) by the distal nephron. The collecting tubule/duct develops from the ureteral bud, and the connecting tubule represents the connection between the embryonic nephron and the ureteral bud. The collecting duct system regulates the osmolality of the urine by absorbing water under the influence of the antidiuretic hormone (ADH), and tubular fluid equilibrates osmotically with the hypertonic medullary interstitium. ADH promotes the formation of a hypertonic urine both by increasing the rate of salt absorption in the thick ascending limb of Henle and by increasing the water permeability of the collecting duct system (Andreoli 1992).
The efferent artery disperses into a second capillary network that surrounds the tubular portion of the nephron (Fig. 4c), delivering substances for tubules to secrete into the tubular fluid and taking up water and solutes reabsorbed by the tubule. Most of the capillaries in this second network surround the tubules in the cortex and are termed peritubular capillaries. Some of these capillaries in the juxtamedullary nephrons, called vasa recta, descend to varying depths in the medulla before forming a capillary network and reunite while turning around and ascend back to the renal cortex. From the peritubular capillaries and vasa recta, blood flows into the peritubular veins and is drained by the renal veins.
1.2 Normal Renal Physiology
The principal function of the mammalian kidney is to maintain homeostasis or equilibrium between our internal volume and electrolyte status and that of the environment’s influences, diet, and intake. It functions to maintain our intra- and extracellular fluid status at a constant, despite the wide variety of daily fluid and electrolyte intake. In man, the kidneys consist of two to three million nephrons (Fig. 4) and weigh only 250–300 g. The kidneys’ extraordinary excretory and regulatory objectives are achieved through the processes of glomerular ultrafiltration, tubular reabsorption, and tubular secretion. To a large extent, these excretory and regulatory processes depend on the blood supply to the kidneys.
The kidneys receive the highest blood flow per gram of organ weight in the body at 1 L/min. The renal blood flow is to consider the renal fraction, which corresponds to the fraction of the total cardiac output that flows through the kidneys. The kidneys are highly vascularized parenchymas, and a 70-kg man with a cardiac output of 6 L/min has a normal renal blood flow of about 1.2 L/min corresponding to 20 % of the cardiac output. Considering the fact that each kidney in a normal 70-kg man weighs about 130–170 g, for a total weight of about 300 g of kidney, the average flow per gram of kidney weight (perfusion value) is about 400 mL/min/100 g. This is several times greater per unit weight of organ than the blood flow through most other organs. During various stress conditions or diseases, this renal fraction can vary considerably and be markedly affected. Blood flow to the kidneys will be dependent on a number of important systemic factors. Clearly, if there is a problem with volume (dehydration, hemorrhage) or cardiac output (congestive heart failure, myocardial infarct), blood flow is diminished. In less obvious ways, hypoalbuminemia (cirrhosis, nephrotic syndrome, and starvation) affects the intravascular volume so that the effective blood (volume) flow is diminished, despite many of these patients appearing with total body fluid overloaded. Finally, hypotension from severe vasodilatation (anaphylactic shock, sepsis) would also diminish blood flow to the kidneys.
Oxygen consumption by the kidneys is quite high and amounts to about 8 % of the total oxygen consumption of the body. Oxygen delivery to any organ is directly dependent on hemoglobin content (blood) and cardiac output (blood flow). As in other tissues, an important function of blood flow is to provide adequate oxygenation and nutrition. Therefore, the relatively high blood flow to the kidneys exists to feed its metabolic demands as well as to allow ultrafiltration. In fact, the renal blood flow is so high that only a small percent of the available oxygen is extracted from the blood perfusing the kidneys.
The fundamental parameter to indicate the renal function is glomerular filtration rate (GFR) corresponding to the volume of water filtered out of the plasma through glomerular capillary walls into Bowman’s capsules per unit of time. The normal value of the GFR is above 90 mL/min/1.73 m2. The initial step in urine formation (ultrafiltration) occurs across the glomerular wall (Klahr 1992). The difference in hydrostatic pressure between the glomerular capillary pressure (P GC) and Bowman’s space (P BS) favors filtration, whereas the colloid osmotic pressure inside the glomerular capillaries (ΠGC) opposes it:
![$$ \mathrm{GFR}={K}_{\mathrm{uf}}\kern0.5em \left[\left({P}_{\mathrm{GC}}-{P}_{\mathrm{BS}}\right)-{\Pi}_{\mathrm{GC}}\right] $$](/wp-content/uploads/2016/04/A183014_2_En_2_Chapter_Equ1.gif)
(1)
K uf corresponds to the ultrafiltration coefficient and is a function of both the total capillary surface and the permeability per unit of surface area. Bowman’s space (P BS) pressure and the hydrostatic pressure (P GC) remain relatively constant along the glomerular capillaries, while the colloid osmotic pressure (ΠGC) undergoes a large progressive increase because the filtration of protein-free fluid results in an increase of protein concentration along the capillary lumen. Hence, the mean effective pressure for ultrafiltration decreases along the glomerular capillaries and becomes zero before the end of the capillary (Klahr 1992) with consequent end of filtration. Thus, the GFR is highly dependent on the glomerular plasma flow rate because, at high flow rates, a slower rise in the colloid osmotic pressure occurs and glomerular filtration increases since it takes place across a greater length of the capillary (Klahr 1992).
The autoregulatory system accomplishes this by maintaining the glomerular capillary pressure around 60–70 mmHg. Renal blood flow and GFR are autoregulated within a wide range of renal arterial pressure. This ability to maintain renal perfusion pressure and P GC is impaired when mean arterial pressure drops below 70 mmHg. Unless cardiac output is severely reduced, however, GFR usually remains near normal. GFR is protected from reduced cardiac output and arterial pressure by autoregulation (Cohen 1991), which involves the local activation of the renin–angiotensin system in the juxtaglomerular apparatus via myogenic receptors in the wall of the afferent arteriole, and granular cells carry renin in intracellular granules in the wall of the distal tubule (the macula densa). These sense blood pressure changes through stretch receptors and respond accordingly through relaxation or constriction. Renin, a glycoprotein of 340 amino acids, is produced in the granular cells as a precursor protein (prorenin) that is cleaved to yield active renin (Baxter 1992). The granular cells of the juxtaglomerular apparatus release renin into the circulation where it has a half-life of around 15 min. The release of renin can be induced by altered sodium concentration at the macula densa of the distal tubule (tubuloglomerular feedback loop), by changes in the blood flow patterns of the afferent arteriole or by adrenergic stimulation. Renin acts in the plasma and cleaves the renin substrate angiotensinogen, secreted by the liver, to yield the decapeptide angiotensin I. Angiotensin I is not known to have a physiologically important action, while it serves as a substrate for the production of angiotensin II. The conversion of angiotensin I to the octapeptide angiotensin II is catalyzed by angiotensin converting enzyme that is present in a number of tissues and in high concentration in the lung. Angiotensin II is a potent vasoconstrictor and appears to constrict the efferent glomerular arteriole selectively (Cohen 1991). Angiotensin II is also a potent stimulator of aldosterone release from the adrenal glands. The afferent arteriole will respond to changes in renal perfusion pressure by either vasoconstriction or vasodilatation as a result of a direct myogenic response. The resultant increase in efferent arteriolar resistance maintains hydrostatic pressure within the glomerular capillaries and GFR (Cohen 1991).
As further endocrine functions of the kidney, besides the renin–angiotensin axis, the prostaglandin production, the operation of the kallikrein–kinin system, and the degradation of low molecular weight proteins should be mentioned. The kidney is also the major site for the synthesis of erythropoietin, which is a glycoprotein produced by renal enzymatic action on a circulating precursor of hepatic origin (Andreoli 1992). The principal action of erythropoietin is to stimulate the rate of red blood cell production by the bone marrow.
1.3 Calculation of Glomerular Filtration Rate (GFR)
Unfortunately, blood urea nitrogen (BUN) and serum creatinine will not be raised above the normal range until 60 % of total kidney function is lost. In particular, serum creatinine is known to be an unreliable indicator of GFR. Approximately 30 % of elderly patients with normal serum creatinine (1.4 mg/dL or less) have chronic kidney disease based on an estimated GFR of less than 60 mL/min/1.73 m2 (Lane et al. 2009). Thus the serum creatinine concentration may remain within the normal range, despite a substantial decrease in the GFR. Moreover, the creatinine concentration in the blood is affected by a number of factors other than creatinine filtration, including diet, muscle mass, and sex (Lameire et al. 2006). Older patients and women tend to have a lower muscle mass than younger men, and hence, the renal function, namely, the GFR, may be lower than that expected from the serum creatinine.
GFR and creatinine clearance are the two indices that are usually employed to quantify the renal function. Recommendations for evaluating people at increased risk for chronic renal failure are to measure urine albumin to assess kidney damage and to estimate the GFR with an equation based on the level of serum creatinine (Stevens et al. 2006). Many studies support the similarity of creatinine clearance to GFR and its reciprocal relationship with the serum creatinine level. Creatinine clearance rate (C Cr) is the volume of blood plasma that is cleared of creatinine per unit time and is a useful measure for approximating the GFR. Both GFR and C Cr may be accurately calculated by comparative measurements of substances in the blood and urine or estimated by formulas using just a blood test result. The results of these tests are important in assessing the excretory function of the kidneys, and the grading of chronic renal failure and dosage of drugs that are primarily excreted via urine are based on GFR (or C Cr). GFR or its approximation of the creatinine clearance is measured whenever renal disease is suspected or careful dosing of nephrotoxic drugs is required. Creatinine is produced naturally by the body (creatinine is a metabolite of creatine in the muscle).
Creatinine is an amino acid derivative with a molecular mass of 113 Da that is freely filtered by the glomerulus and secreted by the proximal tubule cells. Consequently, the creatinine clearance exceeds the GFR (Stevens et al. 2006). Tubular secretion of creatinine varies among and within individual persons and is influenced by some drugs, including trimethoprim and cimetidine, which inhibit creatinine secretion, thereby reducing creatinine clearance and elevating the serum creatinine level without affecting the GFR. The generation of creatinine is determined primarily by muscle mass and dietary intake, which probably accounts for the variations in the level of serum creatinine observed among different age, geographic, ethnic, and racial groups. Extrarenal elimination of creatinine may be increased at low levels of GFR; this increase is mainly related to the degradation of creatinine by intestinal bacteria and can be affected by the use of antibiotics.
GFR can be calculated by measuring any chemical that has a steady level in the blood and is freely filtered, but neither reabsorbed nor secreted by the kidneys. The rate measured, therefore, is the quantity of the substance in the urine that originated from a calculable volume of blood:
(2)
The GFR can be determined by injecting inulin into the plasma. Since inulin is neither reabsorbed nor secreted by the kidney after glomerular filtration, its rate of excretion is directly proportional to the rate of filtration of water and solutes across the glomerular filter. Cystatin C, a nonglycosylated basic protein with a low molecular mass (13 kD) that is freely filtered by the glomerulus, is currently under investigation as a replacement for serum creatinine in estimating the GFR since its concentration is independent of muscle mass and does not seem to be correlated with age and sex. After filtration, cystatin C is reabsorbed and catabolized by the tubular epithelial cells; only small amounts are excreted in the urine. Consequently, although cystatin C is cleared by the kidneys, its urinary clearance cannot be measured, which makes the study of the factors affecting its clearance and generation difficult.
In practice, the GFR is often estimated from the serum creatinine level (estimated GFR, eGFR). Creatinine clearance (C Cr) can be calculated if values for creatinine’s urine concentration (U Cr), urine flow rate (V), and creatinine’s plasma concentration (P Cr) are known. Since the product of urine concentration and urine flow rate yields creatinine’s excretion rate, creatinine clearance is also said to be its excretion rate (U Cr × V) divided by its plasma concentration. This is commonly represented mathematically as
(3)
Commonly a 24-h urine collection is undertaken, from empty bladder one morning to the contents of the bladder the following morning, with a comparative blood test then taken. The urinary flow rate is still calculated per minute; hence,
(4)
To allow comparison of results between people of different sizes, C Cr is often corrected for the body surface area (BSA) and expressed compared to the average-sized man as mL/min/1.73 m2. While most adults have a BSA that approaches 1.7 m2 (1.6–1.9 m2), extremely obese or slim patients should have their C Cr corrected for their actual BSA, which can be calculated on the basis of the weight and height:
(5)
The National Kidney Foundation (2002) Kidney Disease Outcome Quality Initiative (K/DOQI; 2002) recommends that clinicians should use an estimated creatinine clearance rate (eC Cr) calculated from the serum creatinine as an index of renal function, rather than serum creatinine alone. A number of formulas have been devised to estimate GFR or C Cr values on the basis of serum creatinine levels. The most widely used equations for estimating GFR are the Cockcroft–Gault (1976) and the Modification of Diet in Renal Disease Study Group (MDRD) (Levey et al. 1999) formulas.
Cockcroft–Gault (1976) formula may be used to calculate eC Cr, which in turn estimates GFR: eCCr (mL/min) = (140 – age [years]) × weight (kg)/72 × SCr (mg/dL)(6) where eC Cr is the estimated creatinine clearance rate and S Cr is the serum creatinine. Resulting value must be multiplicated by 0.85 for women. eCCr (mL/min) = (140 – age [years]) × weight (kg) × k/SCr (µmol/L) (7) where eC Cr is the estimated creatinine clearance rate, S Cr is the serum creatinine, and k is 1.23 for men and 1.04 for women.
The most recently advocated formula for calculating the GFR is the one that was developed by the MDRD study. The most commonly used formula is the “four-variable MDRD,” which estimates GFR using four variables: serum creatinine, age, race, and gender. According to this formula, for creatinine in mg/dL: eGFR (mL/min/1.73 m2) = 186 × SCr –1.154 × Age (years) –0.203 × [1.210 if black] × [0.742 if female] (8)
For creatinine in μmol/L: eGFR (mL/min/1.73 m2) = 32788 × SCr –1.154 × Age (years) –0.203 × [1.210 if black] × [0.742 if female] (9)
Considering also the serum albumin and blood urea nitrogen (BUN) levels, eGFR (mL/min/1.73 m2) = 170 × SCr –0.999 × Age (years) –0.176 × [1.180 if black] × [0.762 if female] × BUN –0.170 × Albumin +0.318 (10) where the creatinine and BUN concentrations are both in mg/dL. The albumin concentration is in g/dL.
These MDRD equations are to be used only if the laboratory has not calibrated its serum creatinine measurements to isotope dilution mass spectrometry. When isotope dilution mass spectrometry-calibrated serum creatinine is used (which is about 6 % lower), the above equations should be multiplied by 0.94086.
Creatinine levels in μmol/L can be converted to mg/dL by dividing them by 88.4. The equations have been validated in patients with chronic kidney disease. MDRD equation versions underestimate the GFR in healthy patients with GFRs over 60 mL/min and in heavy patients and overestimate it for underweight people, while the equations have not been validated in acute renal failure.
In the equation used in MDRD, the factors of age, sex, and race are surrogates for muscle mass (Stevens and Levey 2005). Many chronic illnesses, including cardiovascular disease, affect muscle mass through malnutrition, inflammation, and deconditioning. Thus people with chronic illness are more likely to have lower levels of serum creatinine than are healthy people, even for the same level of GFR and the same age, sex, and race. In such persons, estimating equations based on serum creatinine may overestimate GFR. It must be emphasized that both the Cockcroft–Gault and MDRD equations can only provide estimates of GFR, and where there is doubt about renal function, direct GFR measurement is preferable (Lameire et al. 2006).
The Chronic Kidney Disease Epidemiology Collaboration (CKD-EPI) formula (Levey et al. 2009) was developed in an effort to create a formula more accurate than the MDRD formula, especially when actual GFR is greater than 60 mL/min per 1.73 m2:
![$$ \mathrm{eGFR}\left(\mathrm{mL}/ \min /1.73\;{\mathrm{m}}^2\right)=141\times \min {\left({S}_{\mathrm{Cr}}/ k,1\right)}^{\mathrm{a}}\times \max {\left({S}_{\mathrm{Cr}}/ k,1\right)}^{-1,209}\; x\;{0.933}^{\mathrm{Age}}\times \left[1.159\;\mathrm{if}\;\mathrm{black}\right]\times \left[1.018\;\mathrm{if}\;\mathrm{female}\right] $$](/wp-content/uploads/2016/04/A183014_2_En_2_Chapter_Equ11.gif)
where S Cr is the serum creatinine (mg/dL), k is 0.7 for females and 0.9 for males, a is −0.329 for females and −0.411 for males, min indicates the minimum of S Cr/k or 1, and max indicates the maximum of S Cr/k or 1.
(11)
Another estimation tool to calculate GFR is the Mayo Quadratic formula (Rule et al. (2004) to improve the estimation of the GFR in patients with preserved kidney function due to the underestimation of the GFR in patients with preserved kidney function:
![$$ \mathrm{eGFR}\left(\mathrm{mL}/ \min /1.73\kern0.24em {\mathrm{m}}^2\right)= \exp \left(1.911+5.249/{S}_{\mathrm{Cr}}-2.114/{S_{\mathrm{Cr}}}^2-0.00686\times \mathrm{Age}-\left[0.205\kern0.24em \mathrm{if}\kern0.24em \mathrm{female}\right]\right) $$](/wp-content/uploads/2016/04/A183014_2_En_2_Chapter_Equ12.gif)
(12)
In children, the Schwartz formula (1984) is used (Schwartz et al. 1984). This employs the serum creatinine (mg/dL), the child’s height (cm), and a constant to estimate the GFR:
where k is a constant that depends on muscle mass, which itself varies with a child’s age. In the first year of life, for preterm babies k = 0.33, and for full-term infants k = 0.45. For infants between 1 and 12 years of age, k = 0.55. The method of selection of the k-constant value has been questioned as being dependent upon the gold standard of renal function used (i.e., creatinine clearance, inulin clearance, etc.) and also may be dependent upon the urinary flow rate at the time of measurement.
(13)
For most patients, a GFR over 60 mL/min is adequate. But, if the GFR has significantly declined from a previous test result, this can be an early indicator of kidney disease requiring medical intervention. The sooner the kidney dysfunction is diagnosed and treated, the greater the odds of preserving remaining nephrons and preventing the need for dialysis. The normal ranges of GFR, adjusted for BSA, are 70 ± 14 mL/min/m2 for males and 60 ± 10 mL/min/m2 for females.
1.4 Calculation of Glomerular Filtration Rate (GFR) in Acute Renal Failure
Measurement and estimation of GFR in acute renal failure present numerous challenges (Dagher et al. 2003). Serum creatinine concentration alone will provide inaccurate information of eGFR when the GFR is rapidly changing or before it is reaching an equilibrium value. Thus equations to estimate creatinine clearance from serum creatinine cannot be used. In addition, clearance also inaccurately estimates true GFR because of tubular secretion of creatinine.
Oral cimetidine, a blocker of tubular creatinine secretion, improves the accuracy of measuring creatinine clearance, but requires a pretreatment period (Dagher et al. 2003). In addition, the GFR measurements after cimetidine administration have not been validated in patients with acute renal failure. Urinary clearance of GFR markers may provide better information. Thus, if a bolus of a marker such as inulin was administered intravenously and its urinary clearance measured, an estimate of GFR can be obtained (Dagher et al. 2003).
The choice of the GFR marker such as inulin, 125-I iothalamate, and others has been validated in patients with stable renal function. These measurements presume the marker is filtered, not metabolized, neither reabsorbed nor secreted by the tubule, and can be reliably measured in the blood and urine. However, with tubular obstruction and backleak, these assumptions may not hold true. Leakage of substances filtered at the glomerulus, but which leak back across the tubular epithelium, may underestimate GFR in ARF. The permeability to those substances most commonly used for filtration rate determination, such as inulin, may be the principal cause of this phenomenon. Distal recovery of inulin is reduced by only 15 % in kidneys showing severely restricted renal function in animal models (Olbricht et al. 1977). Thus the reduction in whole kidney inulin clearance reflects primarily a reduction in GFR.
GFR can be measured by various methods in patients with acute renal failure, including the continuous infusion method, the standard clearance method, or the plasma clearance method. The infusion method consists in the infusion at a constant rate, usually following a bolus-loading dose, of a known concentration of GFR marker. Since the GFR is often unstable in patients with ARF, a steady state may not be achieved, a major assumption underlying this method. Therefore, this method is not suitable for use in patients with ARF.
In calculating GFR by the standard clearance method, bolus and infusion of a GFR marker is carried out in a manner identical to the above. In addition, urine is collected at three to six timed intervals of 20–30 min each in a water-loaded state (Dagher et al. 2003). The urine flow rate (V) and urinary iothalamate concentration (U) are recorded. Peripheral venous blood is drawn immediately before and after the urine collection period for measurement of plasma maker concentration (P). P represents the logarithmic average of the marker concentration before and after the collection period. The renal clearance is calculated by the formula:
This method lends itself well to the estimation of GFR in ARF when hemodynamic changes can be rapid. By collecting urine and plasma at timed intervals, rapid changes in GFR can be detected.
2 Normal Radiological Anatomy of the Renal Parenchyma, Intrarenal Vasculature, and Anatomical Variants
2.1 Conventional Radiography
The longitudinal (Fig. 5a) and transverse (Fig. 5b) represent the two fundamental planes employed for renal imaging. The conventional plain radiography of the abdomen, or kidney–ureter–bladder (KUB) radiograph, is a first-line imaging technique in the assessment of the kidney. It is performed in the anteroposterior projection with the patient in the upright or supine position. It is indicated to evaluate the renal shape, margins, dimensions, and location and to identify renal calcifications, stones, or transparencies due to fat or gas.
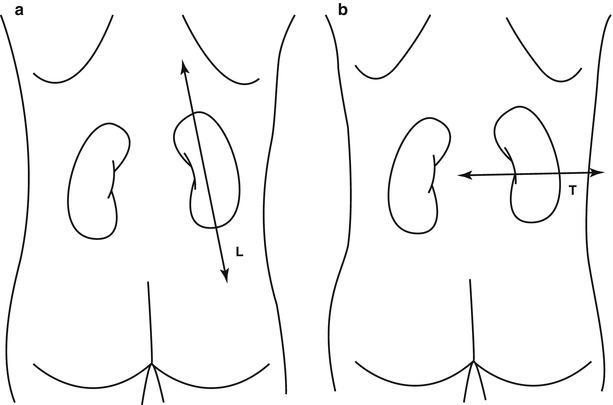
Fig. 5
(a, b) Fundamental planes employed for renal imaging. The longitudinal axis (a) is parallel to the major diameter of each kidney. The transverse axis (b) is perpendicular to the major diameter of each kidney
On the abdomen plain radiography, both kidneys are clearly visible due to the natural contrast provided by the perirenal fat (Fig. 6) and can be assessed regarding their position, morphology, margins, and dimensions. In normal adults both kidneys present a longitudinal diameter of 9–12 cm, and a latero-lateral diameter of 3–5 cm, and should not have a difference in the largest longitudinal diameter higher than 1.5 cm. In the long body habitus subjects, the longitudinal diameter may exceed the highest range, while in the short body habitus subjects, the normal 15–20° inclination of the renal longitudinal diameter on the frontal plane may be much higher with an apparent reduction of the longitudinal diameter on the anteroposterior projection. The psoas muscle profile is another important parameter to evaluate since it is canceled by the intestinal meteorism or by retroperitoneal effusions.
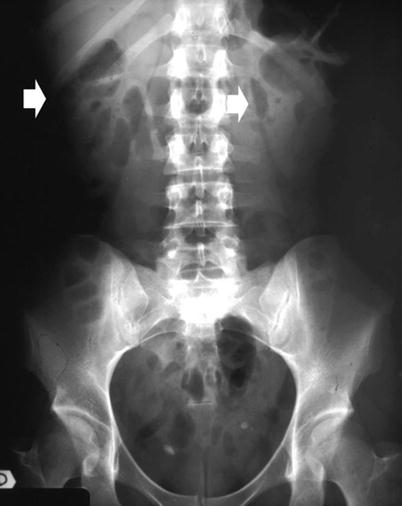
Fig. 6
Conventional plain radiograph of the abdomen. The kidneys (arrows) are easily identified due to the natural contrast provided by the perirenal fat which allows the differentiation between the kidneys and the psoas muscle
The fundamental radiopacities that should be detected at the conventional plain radiograph of the abdomen (Fig. 7) correspond to renal stones or calcifications due to vascular structures, chronic inflammations (e.g., tuberculosis), traumatic lesions (e.g., hematoma), or solid or cystic neoplasms.
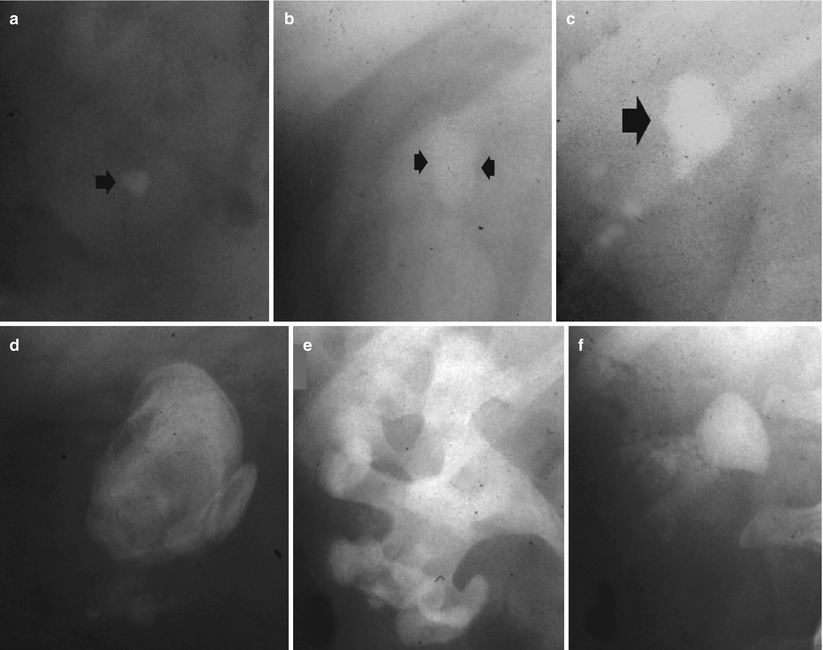
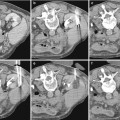
Fig. 7
(a–f) Plain radiograph. Different type of high-density opacities (arrows) projecting on the renal anatomical site. (a) Stone; (b–e) different type of staghorn stone; (f) putty kidney
The fundamental radiolucencies visible on plain radiography are determined by gas (e.g., emphysematous pyelonephritis, Fig. 8) or fat (e.g., angiomyolipomas, liposarcomas, renal sinus lipomatosis).
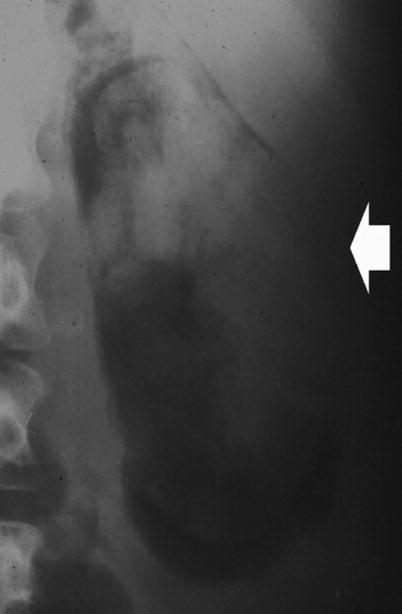
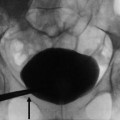
Fig. 8
Plain radiograph. Radiolucency (arrow) in the kidney region due to emphysematous pyelonephritis
2.2 Grayscale and Doppler Ultrasound
Grayscale US is a reliable technique for renal dimension assessment, even though renal volume is influenced by patient age and hydration. In a newborn’s kidneys (Fig. 9), the renal cortex is iso- or hyperechoic to liver and spleen parenchyma (Kasap et al. 2006), whereas pyramids are more prominent than in adults. The renal cortex hyperechogenicity compared to the liver is more evident in premature infants. This is because in a newborn, during the first 2 months of life, the kidney loops of Henle are still within the cortex in large percentage, while the glomeruli occupy proportionately a greater volume of the renal cortex than in adults and an increased number of acoustical interfaces results (Hricak et al. 1983). However, an unusually increased renal echogenicity in newborns may be observed in infantile polycystic kidney disease, hemolytic uremic syndrome, and renal vein thrombosis (Chiara et al. 1990). Compound calyces and associated compound pyramids are present in the upper and lower renal poles in newborns and may appear as large irregular hypoechoic areas, mimicking an obstructed pole of a duplex collecting system, focal caliectasis, hydrocalyx, a cyst, or a hypoechoic mass. Neonatal kidneys also show a paucity of renal sinus echoes due to a minimal renal sinus fat. Within 2–6 months, the kidneys become progressively less echogenic than the liver and assume the features of the adult kidney between 6 and 24 months of life.
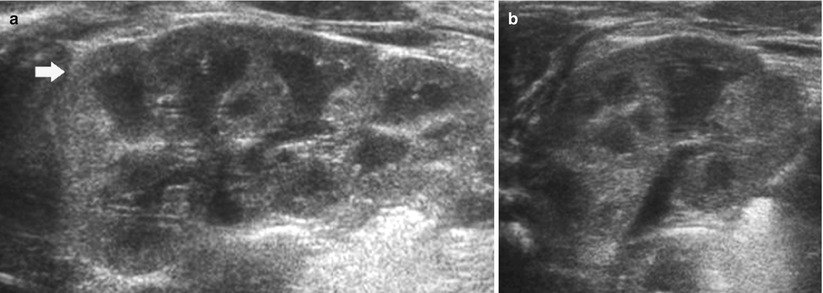
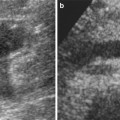
Fig. 9
(a, b) Ultrasound. Longitudinal (a) and transverse scan (b). Normal neonatal kidney. The renal cortex (arrow) appears hyperechoic with evident hypoechoic medulla. On the upper renal pole, the adrenal gland (a) is evident
In a normal adult, the length of both kidneys is considered normal when it is comprised between 9 and 12 cm. Normally, renal margins are smooth, except in some normal anatomical variants such as functional parenchymal defects and renal fetal lobations. In normal adults, the mean normal value of renal cortical thickness (distance between the renal capsule and the outer margin of the pyramid) is 1–1.5 cm, while the normal value of renal parenchyma thickness (distance between the renal capsule and the margin of the sinus echo avoiding renal columns) is 1.4–2.2 cm and decreases with age (Gourtsoyiannis et al. 1990). Renal cortical echogenicity is normally lower than the echogenicity of the liver, spleen, and renal sinus (Fig. 10). When liver parenchyma appears hyperechoic on US, spleen echogenicity is used as a standard reference; however, kidneys may be isoechoic to the liver even when no clinical or laboratory evidence of renal disease is documented. Renal cortical echogenicity is correlated to severity of histological changes in renal parenchymal diseases such as global sclerosis, focal tubular atrophy, and hyaline casts per glomerulus. On US, renal pyramids appear triangular and hypoechoic and may be differentiated from the renal cortex in approximately 50 % of adult patients (Fig. 10), being more conspicuous in slim patients and children and with hydration and diuresis. Renal sinus appears hyperechoic if compared with renal parenchyma, for the presence of hilar adipose tissue with fibrous septa, blood vessels, and lymphatics. Renal sinus may appear inhomogeneous, less echogenic, and poorly differentiated from renal parenchyma when edema, fibrosis, or cellular infiltration are present. With increasing age, amount of renal parenchyma decreases and renal sinus fat increases with the evidence of renal contour irregularities due to vascular scars or nephrosclerosis (Fig. 11). Renal sinus fat tissue may also be increased in renal sinus lipomatosis, which can be determined by obesity, parenchymal atrophy, and normal variants.
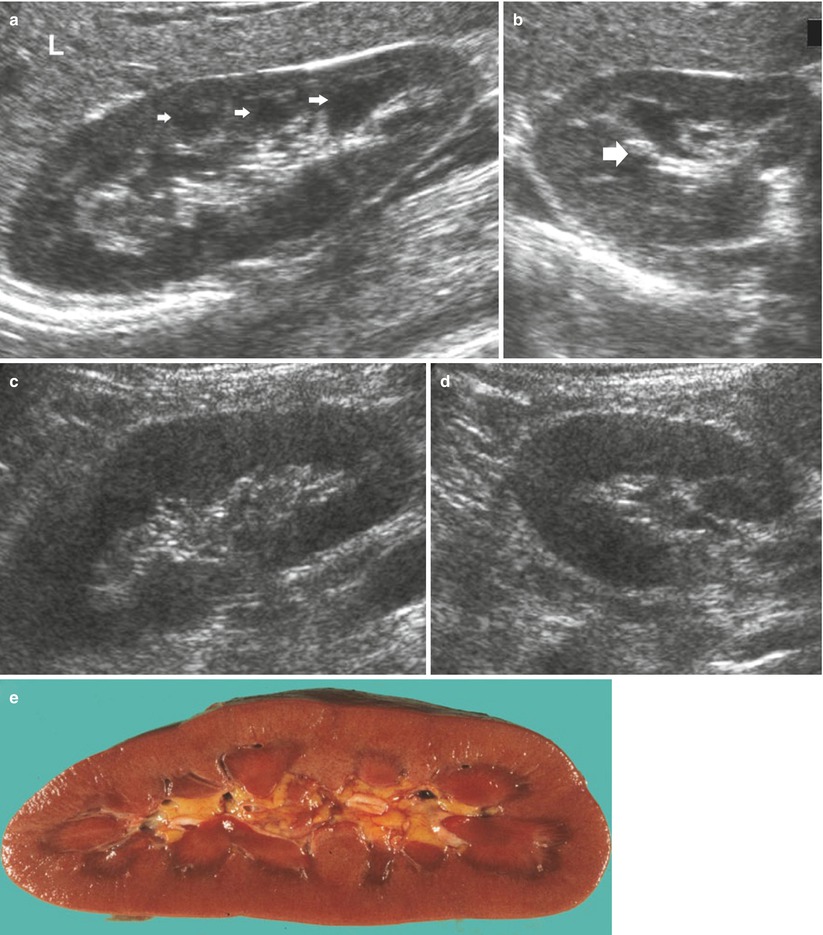
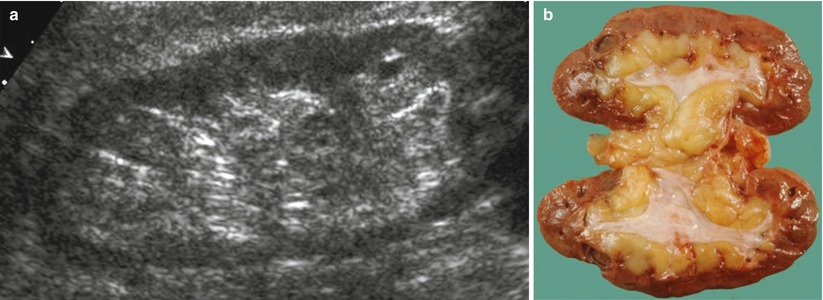
Fig. 10
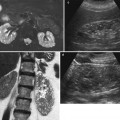
(a–e) Normal anatomy of the adult kidney at ultrasound (a) Longitudinal scan. On US renal pyramids (small arrows) appear hypoechoic in comparison with renal cortex, which appears normally hypoechoic or isoechoic to the adjacent liver parenchyma (L), whereas renal sinus is hyperechoic. (b) Transverse scan. The renal pelvis (large arrow) appears hyperechoic due to sinusal fat. (c, d) Longitudinal and transverse scan of a normal kidney with a lower corticomedullary differentiation if compared with the previous example. (e) Gross specimen of a cadaveric kidney from a young adult
Fig. 11
(a) Grayscale ultrasound. Longitudinal scan of a kidney of an 80-year-old patient. Reduction of the renal parenchyma thickness and increase in the renal sinus fat with the evidence of renal contour irregularities due to vascular scars or nephrosclerosis. (b) Gross specimen of a cadaveric kidney from an elderly patient
Color and power Doppler US accurately depict renal vessels (Fig. 12) with possible assessment of single vessel flows by pulsed Doppler interrogation (Fig. 13). Renal parenchymal arterial and venous vessels have to be evaluated by color and power Doppler by using low wall filter, flow optimization for slow flows with low-pulse repetition frequency, and by appropriate gain setting with the lowest possible level of noise.
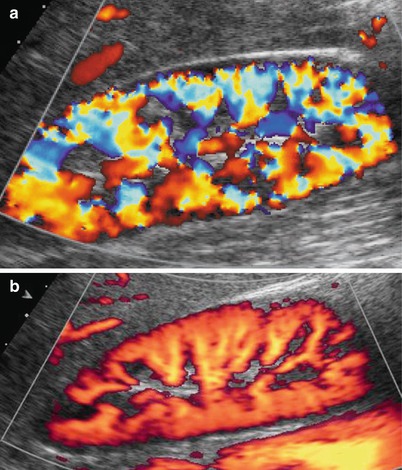
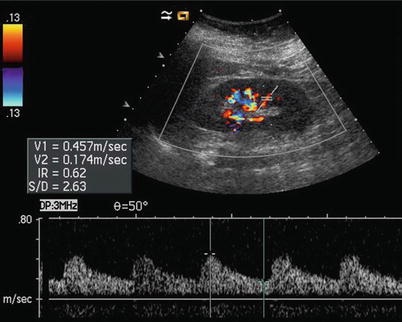
Fig. 12
(a, b) Normal renal parenchymal vascularization may be effectively revealed by color Doppler (a) and power Doppler (b), by setting correctly color gain and by using a low-pulse repetition frequency (slow flows setting optimization). Power Doppler is superior to color Doppler in delineating renal parenchymal blood flows, particularly at the renal poles and superficial cortex
Fig. 13
Intrarenal arteries may be interrogated by pulsed Doppler. In particular, segmental arteries are well suitable for this task. The resistive index may be calculated by measuring the peak systolic and the end-diastolic velocity
The assessment of renal vascular resistances is obtained by Doppler waveform analysis (Fig. 13), obtaining resistive indices (RIs) which correspond to peak systolic velocity minus end-diastolic velocity divided by peak systolic velocity. Increased sensitivity of color Doppler and power Doppler provided by the latest digital US equipment allows depiction and Doppler interrogation of the renal parenchymal vessels up to the interlobular arteries. The RIs measured on segmental, interlobar, and arcuate renal parenchymal arteries are normally below 0.70 and decrease progressively from segmental to interlobular vessels. RIs are significantly higher in elderly subjects. Studies that correlate RIs values with biopsy findings in various renal parenchymal diseases have revealed that kidneys with active disease in tubulointerstitial or vascular compartment present elevated RIs (>0.80), whereas kidneys with glomerular diseases present more often normal RIs values.
2.3 Computed Tomography
Related posts:
Stay updated, free articles. Join our Telegram channel

Full access? Get Clinical Tree


