Radiomics allows for high throughput extraction of quantitative data from images. This is an area of active research as groups try to capture and quantify imaging parameters and convert these into descriptive phenotypes of organs or tumors. Texture analysis is one radiomics tool that extracts information about heterogeneity within a given region of interest. This is used with or without associated machine learning classifiers or a deep learning approach is applied to similar types of data. These tools have shown utility in characterizing renal masses, renal cell carcinoma, and assessing response to targeted therapeutic agents in metastatic renal cell carcinoma.
Key points
- •
Radiomics tools allow for high throughput extraction of quantitative, mineable data from images to aid in decision support.
- •
Texture analysis is one radiomics tool that can be used with or without machine learning classification.
- •
Radiomics tools have shown some utility in differentiating benign and malignant renal masses including fat-poor angiomyolipoma, oncocytoma, cysts, and renal cell carcinoma (RCC).
- •
Radiomics may be helpful in further characterizing RCC, particularly identifying clear cell versus non–clear cell subtype and nuclear grade.
- •
Radiomics tools may be helpful in assessing response of metastatic RCC to targeted chemotherapeutic agents.
Introduction
Radiomics is the high throughput extraction of quantitative features used to convert images into mineable data that is used for decision support. This has been an area of active research as groups try to capture and quantify a spectrum of imaging parameters and convert these into descriptive phenotypes of organs or tumors. There are a plethora of quantitative features that can be extracted from images in this way, ranging from descriptors of size, shape, and morphology to parenchymal or tumoral heterogeneity and these techniques have been applied to organs and tumors throughout the body.
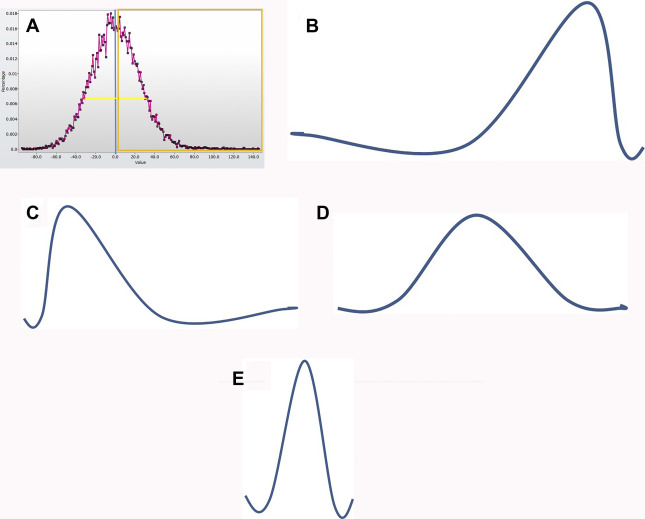
Texture analysis represents one tool in the radiomics toolbox. It allows the assessment and quantification of spatial heterogeneity within a given region of interest (ROI) by analyzing the distribution and relationship of pixel or voxel gray levels in an image. There are a variety of methods for performing texture analysis, with a statistical-based technique most commonly applied. In a statistical-based model, first-order statistics evaluate the gray-level frequency distribution from the pixel intensity histogram in an ROI. First-order variables often include descriptors, such as mean gray level intensity, standard deviation, skewness (asymmetry), kurtosis (peakedness), entropy (irregularity), and threshold or mean of the positive pixels (pixels within or above a given threshold, such as 0) for a given pixel histogram ( Fig. 1 ). First-order variables only take into account the frequency and distribution of gray levels in an image, not their physical location in the image or their relationship to other pixels.
Second- and higher-order variables do take context of pixels into account and are based on co-occurrence matrix or run length matrix. Examples of more advanced texture metrics are listed in Table 1 .
| Advanced Computed Tomography Texture Analysis Metrics | Description | Examples |
|---|---|---|
| Run length matrix | Consecutive pixels or voxels of a single gray level in a given direction | Short-run emphasis, long-run emphasis, run-length nonuniformity, gray level nonuniformity, fraction |
| Gray level co-occurrence matrix | How frequently a gray level occurs in a given interval and direction | Angular momentum, contrast, second-order entropy, uniformity, variance, dissimilarity |
| Autoregressive model | Model-based approach using fractal and stochastic models to interpret image texture | Tetra 1–4, Sigma |
| Haar wavelet | Transform method, produces an image in a space whose coordinate system has an interpretation related to characteristics of a texture | Wavelet energy |
| Geometry parameters | Several |
A variety of platforms are being used for texture analysis, some commercially available and others proprietary to research groups. Some use a single slice (typically the largest cross-sectional diameter) and some use a volume of interest rather than a two-dimensional approach. Some platforms use an image filtration step (a Laplacian or Gaussian bandpass filter is commonly used). It is thought that filtration may limit the impact of technical noise and allows for extraction of features of differing sizes. There is no current technical standardization across platforms.
There is a growing body of literature applying texture analysis to a variety of clinical tasks and imaging modalities, predominantly MR imaging and computed tomography (CT). Texture analysis represents a component of classical approach to radiomics where an ROI is delineated manually and spectrum of human-selected features are extracted. Statistical or mathematical analysis is used to look for associations between hand-extracted features and clinically relevant variables, which can include pathologic characteristics or clinical outcomes. In addition, machine learning classifiers can be applied to groups of hand-extracted features, as might be seen with random forest or support vector machine (SVM) classification. A true deep learning approach would use a system, such as a convolutional neural network, capable of learning from annotated data without specific human instructions. There are advantages to this approach and many research groups are moving in these directions. This review focuses on application of classical radiomics techniques to the kidney and kidney lesions, and touches on application of machine and deep learning to these tasks where data are available.
The applications for renal radiomics are classified into three main groups: (1) organ or lesion characterization, (2) pretreatment assessment of malignancy, and (3) assessment of response to therapy.
Lesion characterization
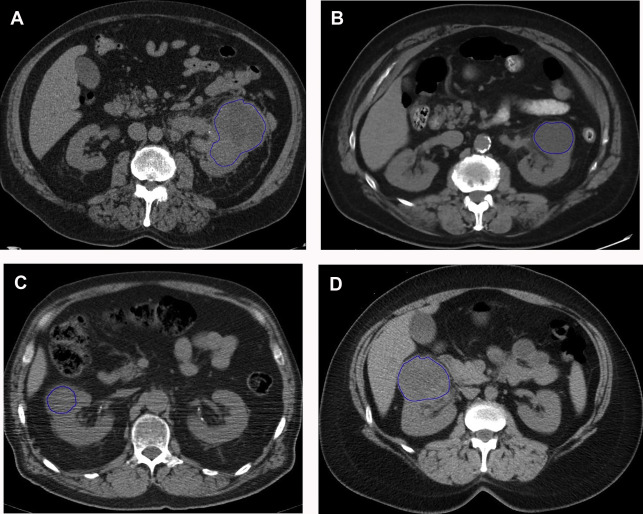
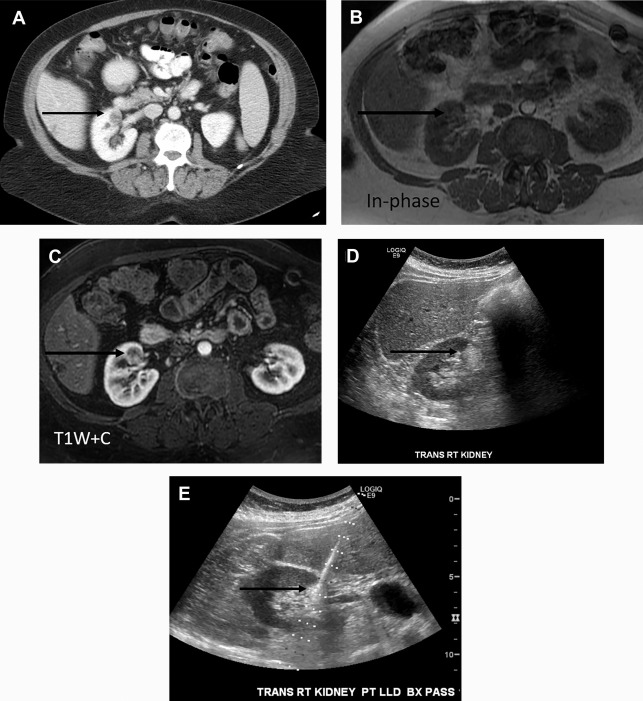
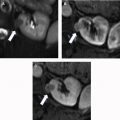
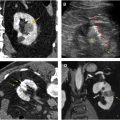
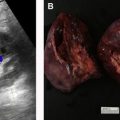
There are a spectrum of tumor histologies, benign and malignant, that can occur in the kidney, and as medical imaging performed for a variety of indications continues to increase, the incidence of renal masses and detection of renal cell carcinoma (RCC) has also continued to rise. Renal cysts are often straightforward to identify when they are simple. They are low in attenuation (usually <20 HU), homogeneous, and well-circumscribed with an imperceptible wall. However, at unenhanced CT, other entities, including RCC, can be low in attenuation , and in these cases, the main differentiating feature may be heterogeneity ( Fig. 2 ). Several studies have found that heterogeneity can often be detected subjectively but can also be evaluated objectively using multiple small or overlapping ROI or using texture features, such as mean gray level intensity and entropy. Angiomyolipomas (AMLs) are common renal mesenchymal lesions composed of variable proportions of blood vessel, smooth muscle, and adipose tissue. Intralesional macroscopic fat is a reliable way to differentiate AML from RCC (with rare exception and as long as not accompanied by lesion calcification), and is identified on CT and MR imaging in many cases. However, up to 5% of AMLs may exhibit minimal or no gross fat (sometimes referred to as “lipid poor”) and therefore be more challenging to differentiate from RCC on imaging. This can lead to unnecessary biopsy, ablation, or surgical resection ( Fig. 3 ). , Application of radiomics has also shown some utility as a discriminator because AMLs tend to have less lesional heterogeneity than RCC. For example, Hodgdon and colleagues looked at 100 patients, 84 with RCC and 16 with lipid-poor AMLs. They collected first- and second-order (gray level co-occurrence, run-length matrix) texture features in these two cohorts and used the most discriminating features to generate SVM classifiers. Diagnostic accuracy was assessed, and 10-fold cross-validation was performed. Results were compared with a subjective reader study assessing heterogeneity. A model incorporating several texture features (mean gray level intensity, gray level co-occurrence angular momentum, gray level co-occurrence entropy) resulted in an area under the curve (AUC) of 0.89 ± 0.04. The average SVM accuracy of textural features ranged from 83% to 91% (after 10-fold cross-validation), and the most accurate three texture features outperformed individual readers.
Takahashi and colleagues looked at the presence of negative HU pixels and skewness of the pixel histogram for identification of fat in lipid-poor AMLs at unenhanced CT. When comparing lipid-poor AMLs (n = 38) with RCC (n = 83), they found that the combination of six or more pixels less than −30 HU using multiple overlapping ROIs and negative whole lesion skewness less than −0.4 identified 20/38 AMLS and 1/83 RCCs.
Varghese and colleagues looked at solid, enhancing masses on contrast-enhanced CT and found that a collection of texture features aided in differentiating benign (oncocytoma, lipid-poor AML) from RCC (multiple subtypes). The overall contrast-enhanced CT model had an AUC of 0.87 for differentiating benign from malignant solid renal masses.
Yan and colleagues evaluated lipid-poor AML (n = 18) compared with clear cell RCC (ccRCC, n = 18) and papillary RCC (pRCC, n = 14) on multiphase CT and found that texture features did an excellent job classifying AML versus ccRCC on unenhanced images (misclassification ≤10%). Similarly, there was excellent classification of AML versus pRCC on enhanced, corticomedullary, and nephrographic phase CT. Takahashi and colleagues used a combination of noncontrast and postcontrast CT with demographic factors to differentiate RCC from lipid-poor AML. The model included sex; morphologic descriptions, such as percentage exophytic growth; entropy on postcontrast CT; attenuation; and lesion to kidney difference. It demonstrated low sensitivity but high specificity for oncocytoma versus RCC (50% and 98%, respectively).
Feng and colleagues applied machine learning to texture analysis of multiphase CT of small renal masses (<4 cm) to differentiate lipid-poor AML (n = 17) from RCC (n = 41). SVM with recursive feature elimination and synthetic minority oversampling technique were used to identify discriminative classifiers. An optimal subset of 11 features and the SVM with recursive feature elimination plus synthetic minority oversampling technique classifier achieved the best performance with AUC of 0.955 in differentiating lipid-poor AML. Similarly, Yang and colleagues used a machine learning–based classification model to differentiation small (<4 cm) lipid-poor AML (n = 45) and RCCs (n = 118) at multiphasic CT. In their study, ROIs were drawn on each phase of contrast and texture features were extracted. Fifteen concatenations of the features were fed into 224 classification models, classifications were compared, and top ranked features analyzed. Features extracted from the noncontrast phase performed the best, with an AUC of 0.9. Other groups have applied machine and deep learning models to this task.
Oncocytomas are the second most common benign renal mass, representing 3% to 5% of renal epithelial neoplasms in adults. They are mistaken for RCC at imaging, and account for 4% to 10% of renal resections. Because they share a cell of origin with chromophobe RCC, there is strong overlap in imaging findings and pathologic features of these two entities, and biopsy is sometimes not sufficient to differentiate oncocytoma from malignant oncocytic neoplasm. Given that there is a growing role for active surveillance in oncocytoma, identifying these lesions is clinically important. ,
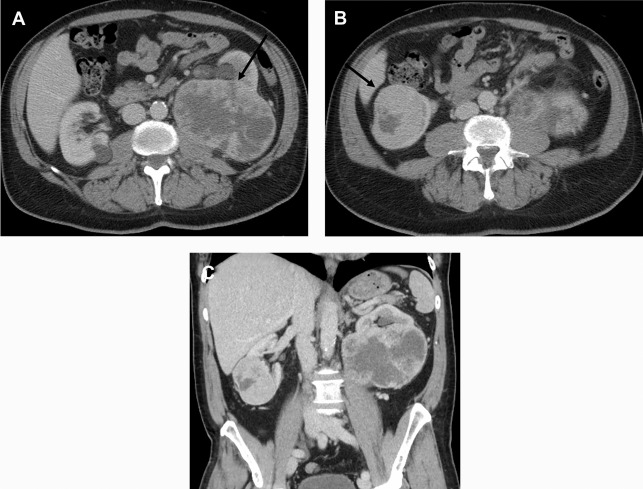
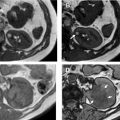
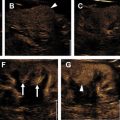
Several groups have compared the radiomic features of oncocytoma to other renal masses. For example, Raman and colleagues looked at multiple renal masses including renal cysts (n = 20), oncocytoma (n = 20), pRCC (n = 20), and ccRCC (n = 20) at multiphasic CT and used machine learning classification to try to differentiate these entities. The random forest method was used to construct a predictive model to classify lesions using texture parameters. The model was then externally validated on 19 unknown lesions. Using this model, oncocytomas were correctly classified 89% of the time with a sensitivity and specificity of 89% and 99%, respectively. The model performed as well or better in the other lesions types, correctly classifying ccRCC 91%, cysts 100%, and pRCC 100%. Another group compared small renal masses including 53 oncocytomas to 128 RCCs (24 pRCC, 104 ccRCC) on biphasic CT. They found that a combination of patient age, tumor attenuation values, and texture features including subjective heterogeneity and skewness of the pixel histogram were able to help differentiate oncocytoma from RCC. Oncocytomas tended to be higher in attenuation than RCC, less subjectively heterogeneous than ccRCC, but more heterogeneous than pRCC (objective entropy values showed similar differences), and had more negatively skewed pixel histograms than RCC ( Fig. 4 ). This model demonstrated an AUC of 0.82 for differentiating oncocytoma from ccRCC, an AUC of 0.95 for differentiating oncocytoma and pRCC, and an AUC of 0.84 for differentiating oncocytoma from any RCC. Another group found that skewness and kurtosis were useful for differentiating ccRCC (n = 46) from oncocytoma (n = 10) with an AUC of 0.91 and 0.93, respectively. This group also used SVM classification to improve their model and found they could separate RCC from other tumors (including oncocytoma, AML) with good to excellent discrimination (AUC, 0.91–0.92). This cohort did include 22 chromophobe RCCs, and some difference in mean and median gray level intensity of the pixel histogram was noted with an AUC of 0.88 in differentiating these tumor types in this small cohort. MR imaging texture features have also shown promise in stratifying small renal masses. In a cohort of 142 renal lesions (90 ccRCC, 22 pRCC, 30 oncocytomas), selected texture features were extracted from precontrast and dynamic postcontrast imaging and random forest classification was used to create a multivariate model. The classifications were moderately useful in distinguishing lesions (eg, oncocytoma vs ccRCC with accuracy of 79%).
Related posts:
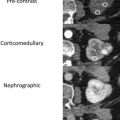 Image Interpretation
 Protocol Optimization for Renal Mass Detection and Characterization
 Mimics and Pitfalls in Renal Imaging
 Percutaneous Thermal Ablation for Treatment of T1a Renal Cell Carcinomas
 Imaging of Renal Infections and Inflammatory Disease
 Use of Contrast Ultrasound for Renal Mass Evaluation
Stay updated, free articles. Join our Telegram channel

Full access? Get Clinical Tree


