As discussed in detail in earlier chapters of this book, diffusion-weighted imaging (DWI) is a powerful tool in the multiparametric assessment of breast lesions with magnetic reconace imaging (MRI) and can provide decisive information for initial detection and classification of lesions, for treatment selection, and for monitoring the efficacy of treatments and follow-up. Whereas dynamic contrast-enhanced MRI studies allow to study tissue vascularity and provide high sensitivity for cancer detection, DWI allows assessing tissue organization at a microscopic level by probing the diffusivity of water molecules in their surroundings.
From a vendor perspective, key objectives in breast DWI are to provide robust diffusion-weighted images with high resolution, to generate few distortions and artifacts in reasonable acquisition times for a seamless integration into daily clinical routine, and to support advanced (clinical and research) applications, such as the assessment of non-Gaussian diffusion or tumor heterogeneity.
Data Acquisition
Hardware and Sequences
Although two decades ago there were no tailored protocols or optimized sequences for DWI of the breast, today every Siemens Healthcare MAGNETOM scanner provides standardized DWI sequences and protocols for imaging of the breast. These protocols have been optimized to make best use of the respective MRI hardware (e.g., gradient slew rate and maximum gradient amplitude) and follow the recommendations of the European Society of Breast Imaging (EUSOBI) consensus group for breast imaging. As recommended there, the Siemens Healthineers protocols provide coverage of both breasts in axial orientation, an in-plane resolution (acquired, not interpolated) of ≤2 × 2 mm 2 , a typical slice thickness of 4 mm, and two b values: one low b = 50 s/mm 2 to minimize the effects of pseudo perfusion (intravoxel incoherent motion [IVIM]), which are observed with b = 0 s/mm 2 ; and one high b value of 800 s/mm 2 , which has been shown to be a sweet spot for reasonable signal-to-noise ratio (SNR) and lesion conspicuity in the breast. To reduce scan time by leveraging higher SNR at low b values, a different number of averages is acquired for the individual b values and can be flexibly adjusted by the user. Up to 15 b values can be acquired within a measurement, and small b value increments for non-Gaussian diffusion models are supported with recent software versions. Furthermore, the user can choose from various diffusion modes (e.g., 3-scan-trace, 3D-diagonal, 4-scan-trace) and between monopolar (single-echo) and bipolar (double-echo) diffusion schemes. To mitigate diffusion anisotropy effects, usually a 3-scan-trace diffusion mode is used, in which acquisitions are performed using three orthogonal diffusion gradient directions sequentially to obtain orientation-averaged apparent diffusion coefficient (ADC)–weighted images, which approximate diffusion tensor imaging (DTI)-orientation-invariant trace-weighted images. With a 4-scan-trace or tetrahedral mode the maximum gradient strength can be applied, facilitating minimal echo times (TEs) and echo-planar imaging (EPI) readouts. Under the assumption that diffusion anisotropy in body oncology applications is neglectable, another highly efficient alternative is the diagonal mode, applying the maximum diffusion gradient strength in all three directions simultaneously and thereby measuring diffusion in a single direction.
Whereas the bipolar diffusion scheme is less sensitive to eddy-current effects (which result in geometrical distortion) and background gradient effects (which might interfere with b values), the monopolar scheme has the advantage of shorter TE and repetition time (TR) and provides higher SNR. By applying an image-based dynamic distortion correction algorithm, however, most disadvantages of monopolar acquisition can be compensated, and monopolar is routinely used in the Siemens Healthineers breast DWI protocols. Proper fat saturation is achieved by offering different excitation/fat saturation schemes (e.g., spectral adiabatic inversion recovery [SPAIR], inversion recovery), including the use of gradient reversal for minimizing remaining fat residuals. Typical clinical settings encompass 4-scan-trace, monopolar mode, and SPAIR, whereas for scanning ultra-high b values, inversion recovery is recommended. The automated (inline) calculation of ADC maps is a standard feature and is based on a monoexponential diffusion model. In addition, the scanner software enables the inline generation of synthetic (extrapolated) high or ultra-high b value images, which have been proposed as a tool to increase lesion conspicuity in DWI by means of better suppression of normal tissue and more pronounced appearance of focal lesions with impaired diffusion. Although clinically reasonable values are in a range of 1500 to 2500 s/mm 2 , the calculation is possible up to a value of 5000 s/mm 2 . However, one should remain cautious that extrapolation from lower b value images, assuming diffusion is monoexponential (Gaussian), may result in interpretation errors of some findings (see Chapter 12 ).
Single-Shot Echo-Planar Imaging
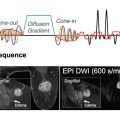
The standard and most widely used sequence for DWI in clinical practice is single-shot echo-planar imaging (ss-EPI), where the measured k-space of an entire 2D plane is filled with one EPI readout following a single radiofrequency (RF)–excitation pulse.
The ss-EPI method has the advantage of speed but suffers from susceptibility artifacts, spatial distortions, and spatial blurring. The choice of imaging parameters significantly impacts artifacts and needs careful optimization. When high spatial resolution is desired, for example, the matrix size in phase encoding (equal to the EPI factor or echo train length [ETL]) must be increased but consequently more echoes are acquired during the T2* decay of the signal. Furthermore, susceptibility effects are amplified in the images due to a larger echo-spacing (ESP).
Geometrical distortions and susceptibility artifacts (∆d(r)) in EPI are related to ESP, the field of view (FOV) in phase-encoding direction (FOV PH ), the number of interleaves (N in ), and the parallel acceleration factor R as follows:
Δd(r)∼ESPFOVPHNinR
Related posts:
 DWI and Breast Physiology Status
 Disease and Treatment Monitoring
 Diffusion MRI as a Stand-Alone Unenhanced Approach for Breast Imaging and Screening
 High-Resolution Diffusion-Weighted Breast MRI Acquisition
 Diffusion-Weighted Whole Body Imaging With Background Body Signal Suppression (DWIBS)
 Diffusion-Weighted Imaging (DWI) for Breast Lesion Characterization: The Olea Medical Perspective and the Utilization of Olea Sphere Software
Stay updated, free articles. Join our Telegram channel

Full access? Get Clinical Tree


