This section discusses the normal magnetic resonance (MR) imaging appearance of the brains of children after term delivery up to the age of 18 months. We illustrate this topic with anatomically matched T1- and T2-weighted images and the equivalent line diagrams taken from the 40-week fetus in the Larroche atlas. The most obvious macroscopic changes that occur at this time relate to the normal, sequential changes in the degree of myelination of the brain structures. At its simplest level, MR images can be thought of as maps of body water and fat, and the changing proportions of water and lipid in brain resulting from myelination are well seen on MR images. Several groups have published data on the normal milestones of myelination and have shown how that knowledge can be used in the early detection of diseases characterized by abnormal amounts or forms of myelination.
In the light of several years of teaching trainee radiologists, two significant, recurring misconceptions about brain myelination warrant further discussion. First, most newcomers to the field believe that no myelin at all is present in the brain of the term neonate, but this is not correct. Second, most newcomers do not appreciate that the deep brain nuclei or deep “gray matter” regions of the mature brain such as the putamen and thalamus, contain a relatively high proportion of myelin as well as cell bodies. The myelin is mainly located on projectional axons and interneurons. As a result, gray matter regions change their MR signal intensities during prenatal and postnatal life because of accumulation of myelin in them as well as in adjacent typical “white matter” structures. The signal characteristics in the deep gray matter structures are complicated further in later childhood as iron accumulates in the basal ganglia. These changes are often first seen around the age of 8 to 9 years, with rapid accumulation in the second decade of life. The iron is stored in a form that has significant effects on T2 (particularly T2′) relaxation, which explains why structures such as the globus pallidus and substantia nigra have low T2 signal in older children and adults but not in neonates or infants.
A good example of the competing signal changes brought about by these mechanisms is illustrated by the T2 signal of the globus pallidus and putamen at different ages. These structures provide useful comparison because they are both deep gray matter nuclei and their close anatomic proximity allows direct comparison. The two structures would be predicted to have similar signal characteristics because they have similar neuronal/glial composition. This is true for the first 30 to 32 weeks of gestation. However, myelination proceeds more rapidly in the globus pallidus when compared with the putamen (even in the posterior portion of the putamen that myelinates first). This difference usually can be seen as lower signal in the globus pallidus on T2-weighted images at 33 to 34 weeks’ gestational age. As myelination proceeds in both structures, the signal differential reduces, and at 0 to 1 months post term little signal difference is seen, a characteristic that is maintained for a number of years. The accumulation of iron in brain structures is exceptionally variable by region and continues throughout life. MR techniques that can quantify the amount of iron deposition are available. However, the globus pallidus accumulates iron particularly rapidly and to high concentration. A higher concentration of iron is present in the normal adult globus pallidus than in the liver. After 7 to 8 years of age, the globus pallidus usually has lower signal than the putamen on T2-weighted images, a feature that is most marked on imaging at higher field strengths (e.g., 3 T).
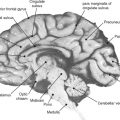
Macroscopic myelination before term has been studied using both fixed and appropriately stained fetal tissue and MR imaging. Good correlation between the two techniques has been observed, particularly if increased signal on T1-weighted images is used to evaluate early postnatal myelination. Evidence of supratentorial myelination is unusual in the 29- to 30-week fetus/premature baby. Consistent evidence of supratentorial myelination at any site is seen on MR imaging only at 33 to 34 weeks. High T1 signal at that stage is frequently seen in the thalamus (particularly ventrolateral) and putamen (particularly posteriorly); the lateral thalamic regions and globus pallidus may alsoshow reduced signal on T2-weighted images. By 37 to 38 weeks, the high T1 signal intensity has increased generally in the basal ganglia and thalami, and evidence of myelination in the posterior limb of the internal capsule and the corona radiata close to the ventricles is seen. Most of those regions also return low signal on T2-weighted images around that maturity ( Figure 3-1 ).

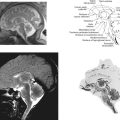
Myelination is more advanced in the infratentorial brain structures. By 33 to 34 weeks, prominent signal changes consistent with myelination on both T1 and T2 sequences are seen in most of the dorsal pons and medulla and in the deep cerebellar white matter. High-resolution studies show myelination within the inferior colliculus and medial lemniscus. By 37 to 38 weeks, prominent myelination usually is seen in the superior cerebellar peduncle, most of the midbrain, and the cerebellar white matter. A 38-week example is shown in Figure 3-2 .

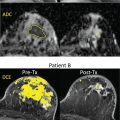
There is close correlation between the regions of the brain injured close to term by profound, hypoxic ischemic injury and the regions of the brain that are actively myelinating. For example, a typical textbook description of a close-to-term profound ischemic injury includes involvement of the lateral thalamus, posterior putamen, white matter of the paracentral lobule, and optic radiations ( Figure 3-3 ). These are precisely the regions that show low T2 signal due to myelin formation in the 38-week fetus. It has been postulated that there is a selective vulnerability for regions of the brain that are metabolically active in the face of hypoxia/ischemia. In the brain of the term neonate this does not necessarily imply neuronal activity; it is much more likely that myelination is the most energy-dependent process. This goes a significant way towards explaining the pattern of injuries seen on neuroimaging and this has helped to explain why some less-well described regions of the brain, such as the anterior lobule of the cerebellar vermis and the subthalamic nucleus, 5 are also involved in the process. Our interest in the involvement of the subthalamic nucleus in cases of profound hypoxic ischemic injury has come about because of the central role of that structure in suppressing unwanted movements acting in parallel to volitional movement. It is no surprise to find that the subthalamic nucleus myelinates close to term ( Figure 3-4 ).


Detailed descriptions of myelination can be reviewed in other more specific texts, but using the physical explanations outlined earlier in the introduction we can produce a list of key features that may be useful in clinical practice.
- •
Mature myelin has high signal on T1-weighted images (compared to gray matter).
- •
Mature myelin has low signal on T2-weighted images (compared to gray matter).
- •
T1-weighted images should show the expected high signal in all white matter regions by the age of 8 months (i.e., myelination is virtually adult pattern at 8 months).
- •
T2-weighted images should show the expected low signal in all white matter regions by the age of 24 months (except peritrigonal “terminal myelination” zones).
- •
Myelination proceeds in an anatomically predictable fashion in normal children, a process that must be understood by anyone reporting MR examinations in children at this age. See Table 3-1 .
TABLE 3-1
Checklist for Normal Myelination: Structures That Should Appear Myelinated by the Specified Age
T1
T2
0–1 Month
Dorsal brainstem
Dorsal brainstem
Inferior and middle cerebellar peduncles
Inferior cerebellar peduncles
Superior cerebellar peduncles and decussation
Superior cerebellar peduncles and decussation
Ventral lateral thalamus
Ventral lateral thalamus
Posterior putamen
Posterior putamen
White matter of pre and postcentral gyri
White matter of pre- and postcentral gyri
Optic tracts
Optic tracts
Posterior limb of internal capsule
Posterior limb of internal capsule (patchy and limited to posterior region)
Central portion of centrum semiovale
Optic radiations
3–4 Months
All of the above
All of the above
All of the cerebellum
Middle cerebellar peduncle
Ventral brainstem
Ventral brainstem
Calcarine fissure white matter
Calcarine fissure white matter
All subcortical motor pathways
Optic radiations
Anterior limb of internal capsule
Splenium of corpus callosum
6 Months
All but subcortical white matter
Centrum semiovale
All of posterior limb of internal capsule
Patchy changes in anterior limb of internal capsule
Splenium of corpus callosum
Patchy changes in genu of corpus callosum
9 Months
Adult pattern
Genu of corpus callosum
Centrum semiovale
12 Months
Adult pattern
All of internal capsule
All of corpus callosum
Paracentral and optic radiations/paracalcarine white matter
18 Months
Adult pattern
Adult pattern except most peripheral cortical white matter
Peritrigonal white matter can return high signal until the fourth decade (terminal myelination zones)
- •
T1-weighted images are best for assessing myelination before the age of 8 months (except brainstem and cerebellum) and T2-weighted images thereafter, although both should be acquired and compared.
The remainder of this chapter demonstrates T1- and T2-weighted images from birth to 18 months in order to show the evolution of myelination.


Related posts:


Stay updated, free articles. Join our Telegram channel

Full access? Get Clinical Tree


