Skeletal Age
Basic Principles
Skeletal age is considered the most important and most representative criterion of biological maturity. Skeletal age determination is carried out for the purpose of evaluating growth in pediatric patients and for the diagnosis of many endocrine disorders and pediatric syndromes. It also allows for growth prediction, so skeletal age determination is important for orthopedic procedures in which it is essential to know the remaining potential for longitudinal growth. In rare cases, skeletal age determination is also required in judicial proceedings to determine, for example, whether a suspect should be charged as a juvenile or an adult. Because radiographs alone do not meet the legal requirement of establishing age with a “probability bordering on certainty,” these cases additionally require a physical and dental examination (including a panoramic radiograph).
When conventional radiographs are used, present skeletal age and predicted adult height can be calculated on the basis of statistical tables. After 2 months of age, these values can be determined on a radiograph of the left hand because the hand bones, with their numerous secondary ossification centers, are considered representative of the skeletal system as a whole. For decades, skeletal maturity was determined by making a visual assessment of the skeletal development of the hand and wrist. With the development and use of digital imaging techniques, there have been increasing attempts to determine the morphologic hallmarks of ossification using computer-assisted techniques to permit a more effective and objective determination. Practical implementation is difficult, however, because of interindividual differences in the rates of bone growth and the variable shape and size of many ossification centers.
Bone Development
The assessment of skeletal maturity is a process that evaluates the size and shape of bones and their degree of mineralization to predict the time remaining to full maturity. This process requires a fundamental knowledge of bone growth. Basically, the development of the skeleton proceeds in three consecutive stages:
Before birth: Ossification of the skeleton begins during the second month of intrauterine development. At birth, the diaphyses of all the tubular bones are present along with the epiphyseal ossification centers of the distal femur, proximal tibia, talus, calcaneus, and cuboid.
After birth: Postnatal longitudinal growth of the tubular bones parallels the ossification of the epiphyses and apophyses. Maturation of the epiphyses and ossification of the epiphyseal plates follows a timetable that is subject to intraindividual and interindividual variations. The first ossification centers in the wrist become radiographically visible during the third month of life. The epiphyses of the radius and short tubular bones do not appear until the second year of life.
Puberty: Skeletal development concludes with epiphy-seal closure during puberty. Sesamoid bones do not appear until after 12 years of age and are variable in their temporal development and number.
Indicators of Skeletal Development in the Hand
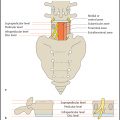
The skeletal development of the hand can be divided into six stages. Specific ossification centers in different age groups are the best predictors of skeletal maturity ( Fig. 17.1 and Table 17.1 ). The various methods of determining skeletal age are based on this developmental pattern. Fig. 17.2 shows the order of appearance of the individual ossification centers, and Table 17.2 lists the ages at which ossification centers appear in the carpals and metacarpals.
Birkner R. Das typische Röntgenbild des Skeletts: Standardbefunde und Varietäten vom Erwachsenen und Kind. 4th ed. Munich: Elsevier; 2009 Schmitt R, Lanz U. Bildgebende Diagnostik der Hand. Stuttgart: Thieme; 2008 Stuart HC, Stevenson SS. Physical Growth and Development. Textbook of Pediatrics, 7th ed. Philadelphia: Waldo E. Nelson; 1959: 12–61
Determination of Skeletal Age
Before Three Months
Given the lack of ossification centers, skeletal maturity before age 3 months is often assessed on a conventional lateral radiograph of the lower leg and ankle. An alternative technique is to scan the ossification centers with ultrasound. The radiograph is used in conjunction with clinically validated nomograms to determine skeletal age. Depending on the method, either age (up to 2 years of age; Hernández method) or body weight (up to 1 year of age; Erasmie method) is used as the starting value:
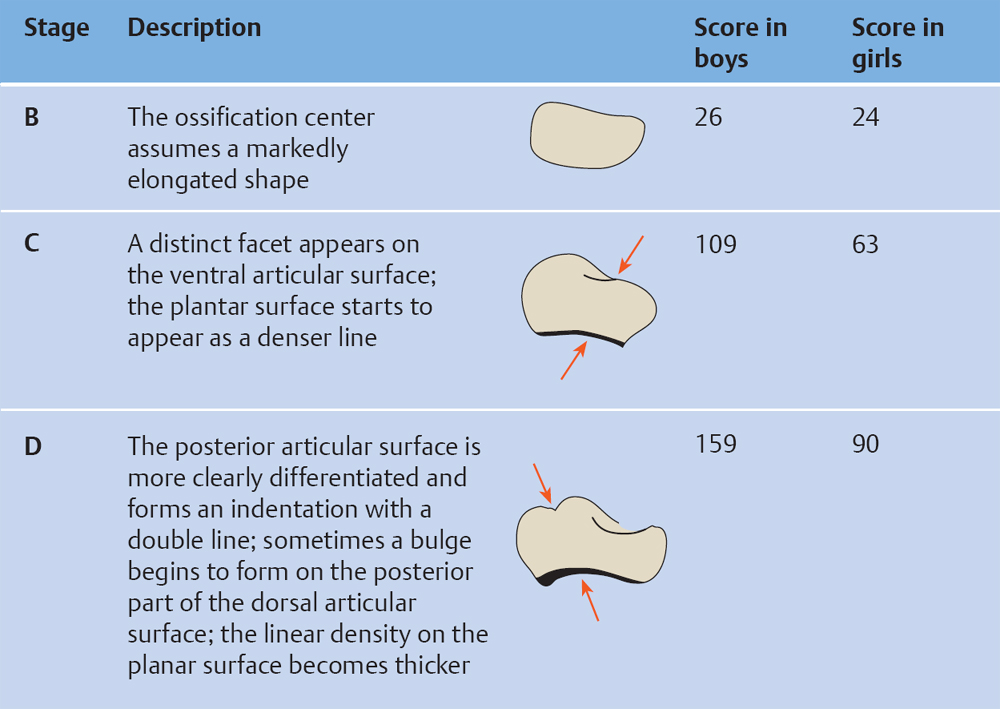
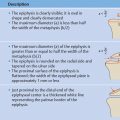
Erasmie method: The sum of the maximum lengths and heights (in mm) of the ossification centers of the talus and calcaneus are calculated as the first step ( Fig. 17.3a ). Next, the ossification centers of the cuboid, third cuneiform, and distal epiphyses of the tibia and fibula and possible accessory ossification centers are graded on a four-point scale. Different scores are assigned based on the maturity of the ossification centers as shown in Table 17.3 , and the point values are added to yield a total score. The graph in Fig. 17.3b is used to determine skeletal maturity. First a vertical line is drawn through the present body weight on the x-axis. Then an upper horizontal line is drawn through the y-axis at the sum of the lengths of the talus and calcaneus. In the lower part of the graph, a horizontal line is drawn through the total maturity score determined for the ossification centers. Each point of intersection with the vertical line indicates the deviation of skeletal maturity from the normal population. This method was evaluated in a total of 115 children.
Hernández method: This is an alternative method for determining skeletal maturity up to 2 years of age by scoring the development of the ossification centers of the calcaneus, cuboid, third cuneiform, distal tibia and fibular epiphysis ( Figs. 17.4 and 17.5 ). The percentile of skeletal maturity for a certain age and gender can then be read from a nomogram based on the determined total sum. This method was validated in Bilbao (Spain) in a series of 1,164 radiographs.
Three Months and Older
A radiograph of the left hand has become the established tool for determining skeletal age in children aged 3 months and older. This method is easy to perform and requires very little radiation exposure. The technical parameters are as follows:
• Free exposure at 30–45 kV and 3–6 mA
• Film-focus distance of 76 cm (prescribed for the Tanner–Whitehouse method)
• Beam centered on the head of the third metacarpal
• Thumb abducted ~ 30°
• Film speed 400
• Small focus
• No grid
The first radiographic atlas based on the principle of ossification centers was created by Todd in 1937. The atlases of Greulich and Pyle and of Thiemann and Nitz are most widely used at present, along with the Tanner and Whitehouse scoring system.

Greulich and Pyle Atlas
Published in 1959, the Greulich and Pyle atlas presents standard radiographic plates of the left hand and wrist obtained from 3 months to 16 years of age. The atlas lists 29 standard radiographs for female infants, children and adolescents and 31 standard radiographs for male infants, children and adolescents. The exact ages of the individual ossification centers are indicated for each radiograph and may deviate slightly from one another. Schmid and Moll created a modified, genderless scheme (see Fig. 17.1 ) for faster reference. The second half of the atlas contains drawings and descriptions that illustrate key maturity indicators for specific bones and epiphyses in the hand. The drawings can improve the accuracy of age determination, especially in cases where different developmental stages are seen in one image. To establish their normal population, Greulich and Pyle used radiographs obtained from white, upper-middle-class boys and girls enrolled in the Brush Foundation Growth Study from 1931 to 1942.
The atlas is used by first comparing the radiograph to be assessed with the standards for age and gender. If differences are noted, the image is compared with the next older and younger standards until the best match is found. If significant differences in maturity are found in different ossification centers, the user should perform separate age determinations for the long tubular bones (radius and ulna) and short tubular bones (carpals and metacarpals). In this “bone-by-bone” method, each epiphyseal center can be individually assessed aided by the drawings and descriptions in the second half of the atlas. The mean value of the individual bone ages equals the skeletal age. This method is very time-consuming, however, and is seldom used.

The speed and simplicity of assigning skeletal age has made the Greulich–Pyle atlas the most widely used reference standard in the world. It should be added, however, that the construction of the Greulich–Pyle atlas is based on the assumption that skeletal maturity is uniform in healthy children, that all bones have an identical skeletal age, and that the appearance and development of all ossification centers follow a fixed pattern. But this disregards the genetic differences and the wide range of variation that exist in the ossification patterns of different bones in the same hand. Another problem with the Greulich–Pyle atlas is that some experience in skeletal age determination is needed to minimize intraobserver and interobserver differences.
Related posts:
Stay updated, free articles. Join our Telegram channel

Full access? Get Clinical Tree


