and Lori Ann Lewis1
(1)
Clinical Research Center of North Texas, Denton, TX, USA
Abstract
Densitometry is primarily a quantitative measurement technique rather than a skeletal imaging technique. Nevertheless, there are unique aspects of skeletal anatomy in densitometry that must be appreciated to properly utilize the technology and interpret the quantitative results as well as the skeletal images. Some of these issues are discussed again in conjunction with performing the various studies in Chap. 4.
Densitometry is primarily a quantitative measurement technique rather than a skeletal imaging technique. Nevertheless, there are unique aspects of skeletal anatomy in densitometry that must be appreciated to properly utilize the technology and interpret the quantitative results as well as the skeletal images. Some of these issues are discussed again in conjunction with performing the various studies in Chap. 4.
The Spine in Densitometry
Studies of the lumbar spine performed with DPA or DXA are generally acquired by the passage of photon energy from the posterior to anterior direction. They are properly characterized as PA spine studies. Nevertheless, these studies are often called AP spine studies, probably because plain films of the lumbar spine are acquired in the AP projection. Compared to plain radiography, however, the beam direction in a DXA study of the spine has less influence on the appearance of the image and little if any influence on the measured BMC or BMD. Studies of the lumbar spine may also be acquired in the lateral projection using DXA. Such studies may be performed with the patient in the supine or left lateral decubitus position, depending upon the type of DXA unit employed.
Vertebral Anatomy
The whole vertebra can be divided into two major components: the body and the posterior elements. The posterior elements consist of the pedicles, the lamina, the spinous process, the transverse processes, and the inferior and superior articulating surfaces. The appearance of the image of the spine on an AP or PA spine study is predominantly determined by the relative density of the various elements that make up the entire vertebra. Figure 3-1A is a photograph of a posterior view of the lumbar spine with the intervertebral discs removed. Figure 3-1B, C demonstrates the appearance of the spine as first the transverse processes, and then the vertebral bodies are removed from the photograph. What remains in Fig. 3-1C is characteristic of the appearance of the lumbar spine on a PA DXA lumbar spine study and consists largely of the posterior elements. The posterior elements form the basis of the DXA lumbar spine image seen in Fig. 3-2. The transverse processes are eliminated from the scan field, and the vertebral bodies are not well seen because they are both behind and equally or less dense than the posterior elements. In a study of 34 lumbar vertebrae taken from ten individuals, aged 61–88, the average mineral content of the posterior elements was 47% of the mineral content of the entire vertebra [1].
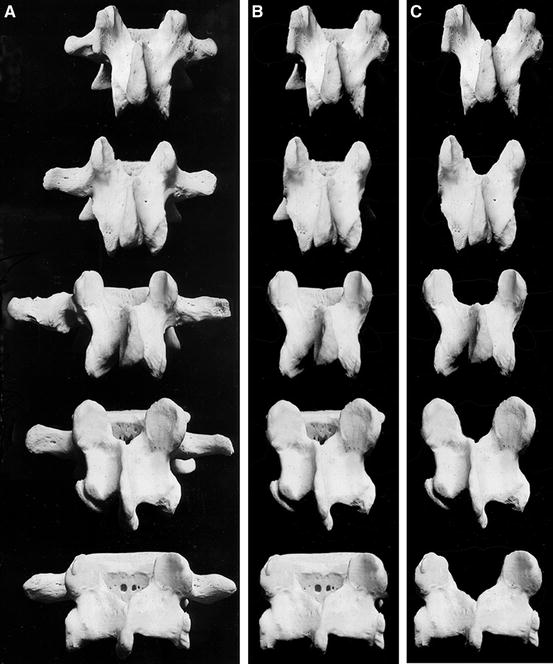
Fig. 3-1.
The lumbar spine in the posterior view. (A) Intact vertebrae. (B) The transverse processes have been removed. (C) The vertebral bodies have been removed, leaving only the posterior elements (Adapted from McMinn RMH, Hutchings, RT, Pegington J, and Abrahams PH. (1993) Colour Atlas of Human Anatomy, 3rd edn, p. 83. With permission from Visuals Unlimited, Hollis, NH, on behalf of RT Hutchings).
Fig. 3-2.
A DXA PA spine study acquired on the GE Lunar DPX. The shapes of the vertebrae in this image are primarily created by the posterior elements. The shapes in this study are classic. The expected increase in BMC and area is also seen from L1 to L4. The increase in BMD from L1 to L3, with a decline from L3 to L4, is also typical.
The unique shapes of the posterior elements of the various lumbar vertebrae can be used as an aid in identifying the lumbar vertebrae. The posterior elements of L1, L2, and L3 have a U- or Y-shaped appearance. L4 can be described as looking like a block H or X. L5 has the appearance of a block I on its side. Figure 3-3 is a graphic illustration of these shapes. Compare these shapes to the actual posterior elements seen in Fig. 3-1C and the DXA lumbar spine study shown in Fig. 3-2. Although the transverse processes are generally not seen on a spine bone density study, the processes at L3 will sometimes be partially visible, since this vertebra tends to have the largest transverse processes. This fact can also be helpful in lumbar vertebral identification. Figure 3-4a, b are the spine images only from the study shown in Fig. 3-2. In Fig. 3-4b, the shapes of the posterior elements have been outlined for emphasis.
Fig. 3-3.
A graphic illustration of the characteristic shapes of the lumbar vertebrae as seen on a DXA PA spine study.
Fig. 3-4.
(a) A DXA PA spine image acquired on the GE Lunar DPX. This is the spine image from the study shown in Fig. 3-2, with the intervertebral disk markers and bone-edge markers removed for clarity. (b) The shapes have been outlined for emphasis.
On PA or AP DXA lumbar spine studies, L1 through L4 are quantified. Although L5 can be seen, it is not usually quantified because of potential interference from the pelvis. In fact, even if labeled on the scan, some software programs will not analyze L5 unless it is deliberately mislabeled L4. L1 frequently has the lowest BMC and BMD of the first four lumbar vertebrae. In a study of 148 normal women aged 50–60, Peel et al. [2] found that the BMC increased between L1–L2, L2–L3, and L3–L4, although the increase between L3 and L4 was roughly half that seen at the other levels as shown in Table 3-1. BMD increased between L1–L2 and L2–L3 but showed no significant change between L3 and L4. The average change between L3 and L4 was actually a decline of 0.004 g/cm2. The largest increase in BMD occurred between L1 and L2. The apparent discrepancies in the magnitude of the change in BMC and BMD between the vertebrae are the result of the progressive increase in area of the vertebrae from L1 to L4. The DXA PA lumbar spine study shown in Fig. 3-2 illustrates the progressive increase in BMC and area from L1 to L4 and the expected pattern of change in BMD between the vertebral levels.
Table 3-1
Incremental change in BMC and BMD between adjacent vertebrae in 148 normal women aged 50–60 as measured by DXA
Vertebrae | Increase in BMC (g) | % increase in BMC | Increase in BMD (g/cm2) | % increase in BMD |
|---|---|---|---|---|
L1–L2 | 2.07 | 13.7 | 0.090 | 7.9 |
L2–L3 | 2.43 | 14.8 | 0.050 | 4.3 |
L3–L4 | 1.13 | 5.0 | −0.004a | −0.8a |
Studies from both Peel et al. [2] and Bornstein and Peterson [3] suggest that the majority of individuals have five lumbar vertebrae with the lowest set of ribs on T12. Bornstein and Peterson [3] found that only 17 % of 1239 skeletons demonstrated a pattern of vertebral segmentation and rib placement other than five lumbar vertebrae with the lowest ribs on T12. Similarly, Peel et al. [2] found something other than the expected pattern of five lumbar vertebrae with the lowest ribs on T12 in only 16.5 % of 375 women. An additional 7.2 % had five lumbar vertebrae but had the lowest level of ribs on T11. Therefore, 90.7 % of the women in this study had five lumbar vertebrae. Only 1.9 % or 7 women out of 375 had 6 lumbar vertebrae. In three of these women, ribs were seen on L1. This was the only circumstance in which ribs were seen on L1. 7.5 % of the entire group had only four lumbar vertebrae. In the majority of cases here, the lowest ribs were seen on T11. Table 3-2 summarizes these findings.
Table 3-2
Percentage of women with various combinations of numbers of lumbar vertebrae and position of lowest ribs
# of Lumbar vertebrae | Position of lowest ribs | % of women |
|---|---|---|
5 | T12 | 83.5 % |
5 | T11 | 7.2 % |
4 | T12 | 2.1 % |
4 | T11 | 5.3 % |
6 | T12 | 1.1 % |
6 | L1 | 0.8 % |
Knowledge of the frequency of anomalous vertebral segmentation, the characteristic shapes created by the posterior lumbar elements on a PA lumbar spine study, and the expected incremental change in BMC and BMD can be used to label the vertebrae correctly. If the vertebrae are mislabeled, comparisons to the normative databases will be misleading. The expected effect of mislabeling T12 as L1 is a lowering of the BMC or BMD at L1, which would then compare less favorably to the reference values for L1. The BMC and BMD averages for L1–L4 or L2–L4 would also be lowered. The degree to which BMC is lowered by mislabeling is substantially greater than BMD as shown in Table 3-3 [2]. The assumption that the lowest set of ribs is found at the level of T12 is often used as the basis for labeling the lumbar vertebrae. As can be seen from Table 3-2, this assumption would result in the vertebrae being labeled incorrectly in 13.3 % of the population. As a consequence, all of the criteria noted above should be employed in determining the correct labeling of the lumbar vertebrae. This should obviate the need for plain films for the sole purpose of labeling the vertebrae in the vast majority of instances. Figure 3-5 is a PA spine study in which the labeling of the lumbar vertebra was not straightforward. The characteristic shapes of the vertebrae are easily seen, but no ribs appear to be projecting from what should be T12. Note the block H shape of the vertebra labeled L4 and the visible transverse processes on the vertebra labeled L3. Statistically, it is likely that there are five lumbar vertebrae here with the lowest set of ribs on T11. The appearance of L3 and L4 would also support this labeling. Plains films,1 acquired for the purpose of diagnosing spine fracture, confirmed that the labeling shown in Fig. 3-5 is correct.
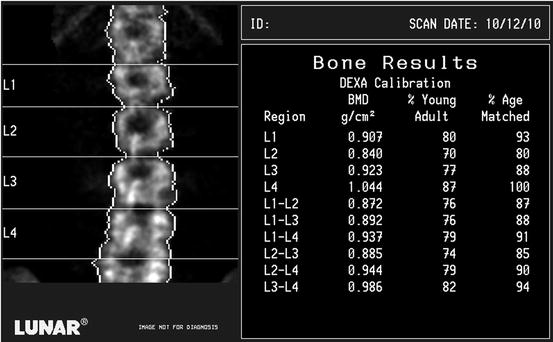
Table 3-3
The effect of mislabeling T12 as L1 on BMC and BMD in AP DXA spine measurements
Measurement | Difference | Mean % underestimate |
|---|---|---|
BMC | ||
L1 | 1.61 g | 11.5 % |
L2–L4 | 3.47 g | 8.4 % |
L1–L4 | 4.8 g | 8.4 % |
BMD | ||
L2–L4 | 0.035 g/cm2 | 3.6 % |
L1–L4 | 0.039 g/cm2 | 3.5 % |
Fig. 3-5.
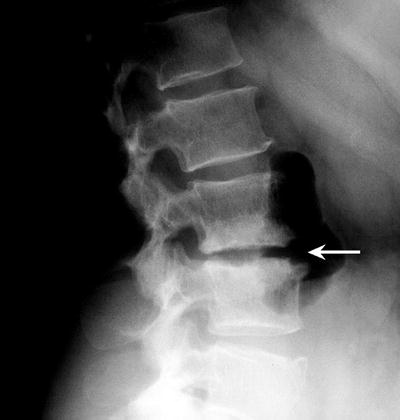
A DXA PA spine study acquired on the GE Lunar DPX. The vertebra labeled L4 has a classic block H or X shape. Although the iliac crests are level, the spine is not straight because of mild rotoscoliosis. This cannot be corrected by the technologist. No ribs are seen, however, protruding from the vertebra that should be T12, making vertebral labeling uncertain. It is far more likely that this represents five lumbar vertebrae with the lowest ribs on T11 than six lumbar vertebrae with the lowest ribs on T12. Also note that the BMD at L1 is higher than at L2, which is unusual. A lateral lumbar spine X-ray of this patient, shown in Fig. 3-7, confirmed a fracture at L1.
Artifacts in PA Spine Densitometry
The PA lumbar spine has been, and continues to be, used extensively in densitometry for diagnosis, fracture prediction, and monitoring. Unfortunately, it is also the skeletal site most often affected by structural changes and artifacts that may limit its utility.
Vertebral Fractures
The BMD of a fractured vertebra will be increased because of the fracture itself. This increase in density could erroneously lead the physician to conclude that the bone strength is better and the risk for fracture, lower, than is the case. Vertebral fractures in osteoporosis frequently occur in the T7–T9 region and in the T12–L2 region [4, 5]. Because DXA measurements of the lumbar spine are often employed in patients with osteoporosis, osteoporotic fractures in the lumbar spine, particularly at L1 and L2, are a common problem, rendering the measurement of BMD inaccurate if the fractured vertebrae are included. An increased precision error would also be expected if the fractured vertebrae were included in BMD measurements performed as part of a serial evaluation of BMD. Although a fractured lumbar vertebra can be excluded from consideration in the analysis of the data, this reduces the maximum number of contiguous vertebrae in the lumbar spine available for analysis. For reasons of statistical accuracy and precision, the BMD for 3 or 4 contiguous vertebrae is preferred over 2-vertebrae averages or the BMD of a single vertebra. Figure 3-6 illustrates a PA lumbar spine study in which a fracture was apparent at L3. Although the BMD at L3 is expected to be higher than either L2 or L4, it is disproportionately higher. The L2–L4 BMD will be increased because of the effect of the fracture on the BMD at L3. In the DXA PA lumbar spine study shown in Fig. 3-5, the image does not as readily suggest a fracture. The BMD at L1, however, is higher than the BMD at L2, which is unusual. A plain lateral film of the lumbar spine of this patient, shown in Fig. 3-7, confirmed a fracture at L1.
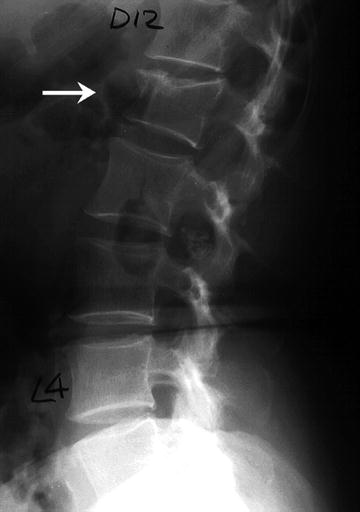
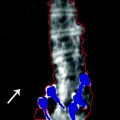
Fig. 3-6.
A DXA PA spine study acquired on the Norland XR-36. The image suggests a loss of vertebral height and increased sclerosis at L3. Although the BMD at L3 is expected to be higher than at L2, the BMD at L3 here is markedly higher. These findings suggest a fracture at this level, but this must be confirmed. In any case, the L2–L4 BMD will be increased by this structural change. Case courtesy of CooperSurgical Norland, Trumbull, CT.
Fig. 3-7.
The lateral lumbar spine X-ray of the patient whose DXA study is shown in Fig. 3-5. A fracture at L1 is indicated by the arrow.
Degenerative Changes and Dystrophic Calcification
Other structural changes within the spine can affect BMD measurements. Osteophytes and facet sclerosis can increase the BMD when measured in the AP or PA projection. Aortic calcification will also potentially affect the BMD when measured in the AP or PA spine because the X-ray beam will detect the calcium in the aorta as it passes through the body on an anterior to posterior or posterior to anterior path. It is therefore useful to note how often these types of changes are expected in the general population and the potential magnitude of the effect these changes may have on the measured BMD in the lumbar spine.
The Effect of Osteophytes on Lumbar Spine BMD
In 1982, Krolner et al. [6] observed that osteophytes caused a statistically significant increase in the BMD in the AP spine when compared to controls without osteophytes. More recently, Rand et al. [7] evaluated a population of 144 postmenopausal women aged 40–84 years, with an average age of 63.3 years, for the presence of osteophytes, scoliosis, and aortic calcification. These women were generally healthy women referred for the evaluation of BMD because of suspected postmenopausal osteoporosis. Table 3-4 lists the percentages of these women found to have these types of degenerative changes. Based on these findings, Rand et al. estimated the likelihood of degenerative changes in the spine as being less than 10 % in women under the age of 50. In 55-year-old women, however, the likelihood jumped to 40 % and in 70-year-old women, to 85 %. Of these types of degenerative changes, however, only the presence of osteophytes significantly increased the BMD. The magnitude of the increase caused by the osteophytes ranged from 9.5 % at L4 to 13.9 % at L1. Cann et al. [8] also estimated the increase in BMD from osteophytes in the spine at 11 %. In 1997, Liu et al. [9] studied 120 men and 314 women, aged 60–99 years. Lumbar spine osteophytes were found in 75 % of the men and 61.1 % of the women. The effect of osteophytes on the BMD was sufficiently great to cause 50 % of the men and 25 % of the women with osteopenia to be misdiagnosed. About 20 % of the men and 10 % of the women with osteoporosis were misdiagnosed because of the effect of osteophytes on the BMD. In Fig. 3-8, osteophytes and endplate sclerosis are clearly visible at L2 on the lateral lumbar radiograph. The appearance of this region on this patient’s DXA PA lumbar spine study in Fig. 3-9 suggests a sclerotic process at this level which is confirmed by the plain X-ray. Osteophytes and endplate sclerosis are also seen on the plain film in Fig. 3-10. The effect on the DXA image of the lumbar spine, shown in Fig. 3-11, is dramatic. There is also a disproportionate increase in the BMD at L2 and L3 compared to L1 and L4.
Get Clinical Tree app for offline access
Table 3-4
Frequency of specific types of degenerative changes in the spines of 144 women aged 40–84
Type of degenerative change | % with change (n) |
|---|---|
Osteophytes | 45.8 % (66) |
Osteochondrosis | 21.5 % (31) |
Vascular calcification | 24.3 % (35) |
Scoliosis | 22.2 % (32) |
Any type | 59.0 % (72) |
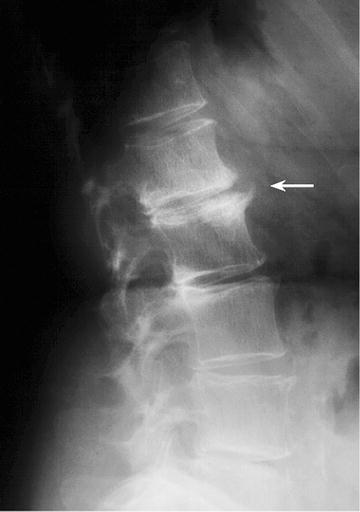
Fig. 3-8.
A lateral lumbar spine X-ray of the patient whose DXA study is shown in Fig. 3-9. The arrow indicates a region of endplate sclerosis and osteophyte formation.
Fig. 3-9.
A DXA PA spine study acquired on the GE Lunar DPX. A sclerotic process is suggested at L2 by the image. The BMD is also increased more than expected in comparison to L1 and is higher than L3, which is unusual. These findings are compatible with the endplate sclerosis and osteophytes seen in Fig. 3-8.
Fig. 3-10.
A lateral lumbar spine X-ray of the patient whose DXA study is shown in Fig. 3-11. The arrow


Related posts:
Stay updated, free articles. Join our Telegram channel
Full access? Get Clinical Tree
