Accurate delineation, diagnosis, and treatment planning of skull base lesions require knowledge of the complex anatomy of the skull base. Because the skull base cannot be directly evaluated, imaging is critical for the diagnosis and management of skull base diseases. Although computed tomography (CT) is excellent for outlining the bony detail, magnetic resonance (MR) imaging provides better soft tissue detail and is helpful for evaluating the adjacent meninges, brain parenchyma, and bone marrow of the skull base. Thus, CT and MR imaging are often used together for evaluating skull base lesions. This article focuses on the radiologic anatomy of the skull base pertinent to MR imaging evaluation.
Accurate delineation, diagnosis, and treatment planning of skull base lesions require knowledge of the complex anatomy of the skull base. Because the skull base is not directly accessible for clinical evaluation, imaging is critical for the diagnosis and management of skull base diseases. Although CT is excellent for outlining the bony detail, MR imaging provides better soft tissue detail and is helpful for evaluating the adjacent meninges, brain parenchyma, and bone marrow of the skull base. Thus, CT and MR imaging complement each other and are often used together for complete evaluation of skull base lesions. This article focuses on the radiologic anatomy of the skull base pertinent to MR imaging evaluation.
Protocol
At the authors’ institution, conventional or fast spin-echo (FSE) T1-weighted (T1W) images in the axial and coronal planes, axial or coronal T2-weighted (T2W) images, and post–contrast-enhanced images (with and without fat suppression) are obtained in all patients with suspected skull base lesions ( Tables 1–3 ). The images are obtained with higher resolution, using a smaller field of view with a slice thickness of 3 mm. Intravenous gadolinium is important to clearly delineate the extent of pathology and to detect intracranial extension, particularly meningeal involvement. Fat-suppressed T1W images can be obtained if the lesion is in the vicinity of fat-containing areas, such as the orbits. However, the skull base region is extremely susceptible to artifacts from tissue inhomogeneity because of air in the adjacent paranasal sinuses. Therefore, fat-suppression technique is not always successful, particularly if the patient also has dental or craniofacial reconstruction hardware causing susceptibility artifacts and distortion. To reduce the acquisition time of these high-resolution images, parallel imaging techniques (if available) can be helpful. A short inversion-time inversion-recovery (STIR) sequence may be used as an alternative to fat-saturated T2W images in patients with extensive maxillofacial facial hardware. STIR provides better fat suppression but takes longer to acquire and is susceptible to pulsatile flow in adjacent vessels.
| Slice Orientation | SAG T1W HEAD | DWI HEAD | AX FLAIR HEAD | COR T2 FS | AX T1 FS W/WO | COR T1 FS W/WO | COR T1 | AX T1 HEAD |
|---|---|---|---|---|---|---|---|---|
| Field of view (mm) | 240 | 230 | 230 | 180 | 190 | 180 | 180 | 240 |
| Matrix | 256/512 | 128/256 | 320/512 | 256/512 | 256/512 | 256/512 | 256/512 | 256/512 |
| No. of slices/location | 23 | 24 | 20 | 40 | 28 | 40 | 40 | 24 |
| Slice thickness/gap | 4/0.5 mm | 4/1 mm | 6/1 mm | 2/default | 2/default | 2/default | 2/default | 6/1 mm |
| Contrast | Pre- | Pre- | Pre- | Pre- | Pre-/Post- | Pre-/Post- | Post- | Post- |
| TE | 10 | 59 | 125 | 90 | 10 | 10.6 | 10.6 | 10 |
| TR | Shortest | Shortest | 11,000 | Shortest | Shortest | Shortest | Shortest | Shortest |
| Flip angle | — | 90 | — | 90 | 90 | 90 | 90 | — |
| Number of Excitations | 1 | 1 | 1 | 3 | 2 | 2 | 2 | 1 |
| Slice Orientation | SAG T1 HEAD | DWI HEAD | AX FLAIR HEAD | AX T2 | AX T1 | POST AX T1 | AX T1 F/S | COR T1 | AX T1 HEAD |
|---|---|---|---|---|---|---|---|---|---|
| Field of view (mm) | 240 | 230 | 230 | 160 | 160 | 160 | 160 | 160 | 240 |
| Matrix | 304/512 | 128/256 | 320/512 | 336/400 | 224/288 | 224/288 | 224/288 | 224/288 | 256/512 |
| No. of slices/location | 21 | 28 | 25 | 34 | 34 | 34 | 34 | 38 | 25 |
| Slice thickness/gap | 5/1 mm | 4/1 mm | 5/1 mm | 4/1 mm | 4/1 mm | 4/1 mm | 4/1 mm | 3/default | 5/1 mm |
| Contrast | Pre- | Pre- | Pre- | Pre- | Pre- | Post- | Post- | Post- | Post- |
| TE | 10 | 59 | 125 | 90 | 9.1 | 8 | 8 | 10.5 | 10 |
| TR | Shortest | Shortest | 11,000 | Shortest | 500 | 590 | 545 | 500 | 500 |
| Flip angle | — | 90 | — | 90 | 75 | 90 | 90 | 90 | — |
| Number of excitations | 1 | 1 | 1 | 1 | 1 | 3 | 2 | 4 | 1 |
| Slice Orientation | SAG T1 HEAD | DWI HEAD | AX FLAIR HEAD | VISTA | AX T2 | AX T1 W/WO | COR T1 | AX T1 HEAD |
|---|---|---|---|---|---|---|---|---|
| Field of view | 240 | 230 | 230 | 180 | 190 | 190 | 200 | 240 |
| Matrix | 256/512 | 128/256 | 320/512 | 360/1024 | 256/512 | 256/512 | 256/512 | 256/512 |
| No. of slices/location | 19 | 28 | 20 | 74 | 18 | 18 | 18 | 25 |
| Slice thickness/gap | 6/1 mm | 4/1 mm | 6/1 mm | 0.3 mm | 2/default | 2/default | 2/default | 5/1 mm |
| Contrast | Pre- | Pre- | Pre- | Pre- | Pre- | Pre-/Post- | Post- | Post- |
| TE | 10 | 51 | 125 | 187 | 90 | 10 | 10.5 | 10 |
| TR | Shortest | Shortest | 11,000 | 1500 | 3000 | 500 | 500 | 500 |
| Flip angle | — | 90 | — | 90 | 90 | 90 | 90 | — |
| Number of excitations | 1 | 1 | 1 | 1 | 3 | 2 | 2 | 1 |
For MR imaging of the cavernous sinuses, the imaging field should extend from the orbital apex to the prepontine cistern. Comprehensive imaging should also include routine T2W/fluid attenuated inversion recovery (FLAIR), and precontrast and postcontrast T1W sequences though the entire brain. Specific sequences through the cavernous sinuses should include 3-mm-thick postcontrast T1W slices in coronal and axial planes, with the fat-saturation technique used in at least one of these planes (see Table 2 ). Individual cranial nerves in the sinuses and adjacent cisterns may be visualized using thin-slice three-dimensional heavily T2W images (such as fast imaging using steady-state acquisition [FIESTA] or, alternatively, constructive interference in steady state [CISS]).
For orbital imaging, phased-array surface coils can be used for detailed imaging of the anterior optic pathway, but these coils do not have enough penetration to image the posterior optic pathway, including the brainstem (which generally requires a standard head coil). Thus a dual-coil approach is often used for orbital MR imaging. Improvements in multichannel head coils and the increasing use of 3T scanners, however, often provide detailed imaging of both the anterior optic pathway and the posterior fossa structures, allowing for the use of a single coil. Most routine orbital imaging protocols include mainly T1W and T2W spin-echo or FSE sequences, all acquired with slice thickness of 3 mm and slice gap of 1 mm. Axial or coronal T2W FSE with fat saturation and axial T1W images are acquired, followed by postcontrast axial and coronal T1W with fat saturation (see Table 1 ). To evaluate the lacrimal system, MR dacryocystography can be obtained through filling the lacrimal sac and nasolacrimal duct with a dilute mixture of gadolinium-containing contrast agent administered typically via cannulation of the lacrimal canaliculi.
MR imaging of the temporal bone always covers imaging of the internal auditory canal, cerebellopontine angle, and the labyrinth (see Table 3 ). Three-millimeter-thick conventional spin-echo or attenuation recovery T1W images provide good imaging of the labyrinth. However, currently 2-mm spin-echo or 1-mm gradient-echo T1W images are used to show different turns of the cochlea, vestibule, semicircular canals, and, in several cases, the endolymphatic sac. Neurovascular structures in the internal auditory canal (IAC) and cerebellopontine angle are well seen on these images. Fat-suppressed coronal T1W spin-echo images can also be used while imaging the temporal bone to eliminate the high T1 signal intensity of the fatty bone marrow in the walls of the internal auditory canal.
For detailed evaluation of the labyrinth, 0.5- to 0.7-mm heavily T2W gradient echo or FSE three-dimensional images are very useful and provide high contrast between the cerebrospinal fluid, intralabyrinthine fluid, nerves, and the bone. These sequences are very useful to evaluate the facial nerve and the three branches of the vestibulocochlear nerves in the internal auditory canal. Submillimeter images can also distinguish between the scala tympani and scala vestibuli/scala media. High-resolution images of both inner ears can be acquired with a good signal-to-noise ratio using a small field of view (95 mm) and a matrix of 192 × 256. Multiplanar three-dimensional reconstructions and virtual images of the fluid-containing membranous labyrinth can be obtained using these small field of view images. Contiguous three-dimensional intraluminal view can be displayed with virtual otoscopy.
Vascular time-of-flight MR angiography images should also be used, particularly in patients with pulsatile tinnitus. On these images, arteries are hyperintense in appearance, whereas the nerves and veins remain hypointense. These images can also be used to show neurovascular conflicts, vascular tumors, or vascular malformations in relation to the temporal bone.
Axial T2/FLAIR images of the brain are also used to complete the study of temporal bone MR imaging, mainly to exclude intra-axial lesions. If a central lesion is suspected as the cause of vertigo or sensorineural hearing loss, 4-mm-thick heavily T2W spin-echo images through the brainstem are also acquired. The myelinated structures can be easily seen on these heavily T2W images, from which the location of the nuclei and the vestibulocochlear pathways can be presumed. The location of the nuclei of other cranial nerves can also be presumed using the same principle.
Anatomy
The anterior, middle, and posterior cranial fossae are the three naturally contoured regions forming the skull base when seen from above. However, no defined boundaries correspond to these fossae when seen from below. The anterior skull base is formed by the frontal bone and sinus, along with the roof of the ethmoid sinuses, nasal cavity, and orbits. The central skull base is formed predominantly by the sphenoid bone, and the posterior skull base is formed by temporal and occipital bones.
Bones forming the skull base contain normal fatty marrow, which appears hyperintense on T1W images without fat suppression, and loses signal on fat-saturated images. The marrow also normally appears dark on fat-saturated T2W images, which increases the conspicuity of the skull base bony lesions. The cortical bones contain nonmobile protons similar to the air in the adjacent paranasal sinuses, hence these appear as signal voids on all of the MR pulse sequences. Although cortical erosion is more confidently diagnosed on CT, infiltration of the marrow spaces is better delineated on MR imaging. CT often underestimates the frequency and extent of skull base involvement. However, the skull base bones may not have a medullary cavity and therefore marrow fat. For example, the orbital roof and ethmoid sinuses do not have marrow cavities, whereas the clivus has a marrow cavity normally containing abundant fat. However, in the pediatric age group, the marrow may still be hematopoietic and not replaced by fat, appearing relatively hypointense on T1W imaging.
Anterior skull base
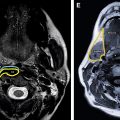
The anterior skull base forms the floor of the anterior skull and includes the roof of the ethmoid sinuses, the nasal cavity, and the orbits ( Figs. 1 and 2 ). Anteriorly, it is bounded by the posterior wall of the frontal sinus and its posterior margin is formed by the lesser wing of the sphenoid bone. Medially along the anterior skull base, the thin cribriform plate of the ethmoid bone and lateral fovea ethmoidalis constitute the roof of the nasal cavity and ethmoid sinuses. The cribriform plate possesses multiple small perforations transmitting olfactory nerves from the nasal mucosa to the olfactory bulb (see Fig. 1 ). The middle nasal turbinate is delicately attached to inferior surface of the cribriform plate. The anterior ethmoid artery enters the anterior cranial fossa from the ethmoid sinus through the lateral lamella of the cribriform plate before reentering the nose. Laterally, the anterior skull base is bounded by the orbital plates of the frontal bone, which form the orbital roof and roof of the ethmoid sinuses. The orbital plate of the frontal bone is actually the largest area of the anterior skull base. Although the cribriform plate forms the weak part of anterior skull base and the site of common bony injuries, erosions, and cerebrospinal fluid (CSF) leaks, the orbital roof is thick and sturdy with relative resistance to these changes.