How to Image the Spine
See spine protocols at the end of the chapter.
- •
Coils and patient position: Phased array spine coils should be used for all spine imaging. Patients are supine in the magnet.
- •
Image orientation ( Box 13-1 ): Sagittal and axial images are acquired in the cervical, thoracic, and lumbar regions. In the axial imaging plane, we obtain stacked cuts that cover an entire block of the spine. Acquiring images angled only through the disks (without obtaining stacked images) is considered inadequate because portions of the spinal canal are not imaged in the axial plane, and sequestered disk fragments and spondylolysis defects are often missed. Sagittal images alone are sometimes inadequate to detect a disk fragment that has migrated from the parent disk. Because sequestered disks are a cause of failed back surgery and persistent symptoms, it is important to identify them on MRI by obtaining stacked axial images in addition to sagittal images through the canal. In the unoperated lumbar spine, we obtain stacked axial images from the middle of the L3 vertebral body to the middle of the S1 vertebral body. In the postoperative spine, stacked axial images (matched images before and after contrast administration) are obtained by centering at the level of the previous surgery. Axial images are often better than sagittal for detecting lesions in the neural foramina. Generally, we consider axial and sagittal planes of imaging to be complementary and do not recommend doing without either. Coronal images may be useful to better define the anatomy in patients with scoliosis.
BOX 13-1
Spinal Structures to Evaluate in Different Planes
Sagittal
- •
Cord
- •
Disk signal, height
- •
Disk contour (±)
- •
Vertebral bodies
- •
Spinous processes
- •
Nerve roots
- •
Neural foramina
- •
Central canal
- •
Ligaments (anterior and posterior longitudinal, interspinous, supraspinous)
- •
Epidural space
Axial
- •
Nerve roots
- •
Cord
- •
Disk contour
- •
Vertebral bodies
- •
Neural foramina
- •
Central canal
- •
Lateral recesses
- •
Ligaments (ligamentum flavum)
- •
Epidural space
- •
Facet joints
- •
- •
Pulse sequences and regions of interest: The pulse sequences are determined by the clinical indications for the examination, based on the following major categories:
- 1.
Degenerative disease (including radicular symptoms)
- 2.
Trauma
- 3.
Cord compression/bone metastases
- 4.
Infection (disk or epidural/intradural lesion)
T1W and fast T2W images are the standard for sagittal imaging in any segment of the spine. Gradient echo sagittal sequences are used when looking for blood in the cord after trauma to take advantage of the blooming effect. A fast STIR sagittal sequence also is useful in trauma patients when looking for ligamentous injury with changes of hemorrhage and edema. Gradient echo axial images are used to detect disk disease in the cervical spine, whereas fast T2W axial images are used in the thoracic and lumbar spine for the same indications. TIW and some type of T2W images are selected in the sagittal and axial planes for most indications. Details are given in the tables of the spine protocols. Slice thickness generally is 3 or 4 mm. Axial gradient echo images through the cervical disks are 2 mm thick. The fields of view are as small as possible; larger ones are required for sagittal than for the axial imaging planes. In the cervical, thoracic, and lumbar spine, the sagittal fields of view are usually 14 cm, 16 cm, and 16 cm; recommended fields of view for the axial images are 11 cm, 12 cm, and 14 cm. Phase and frequency encoding gradients should be reversed for imaging the spine in the sagittal plane so that chemical shift artifacts at the diskovertebral interfaces do not obscure pathology in the vertebral body end plates or disks.
- 1.
- •
Contrast: Contrast medium is always used for postoperative spine imaging, suspected infection, or intradural or nontraumatic cord lesions. If any abnormality is identified in the epidural space when evaluating for osseous metastases or cord compression, gadolinium is given to better show these lesions.
Normal and Abnormal
DEGENERATIVE CHANGES
The most prevalent abnormalities of the spine are degenerative changes of the joints and osseous structures. In the spine, the major joints consist of the paired, freely movable (diarthrodial) synovial facet joints running along the dorsal aspect of the spine and the minimally movable (amphiarthrodial) cartilaginous articulations formed by the intervertebral disks. Primary stability of the spine below C2 is provided by this three-joint complex, composed of the intervertebral disk and paired facet joints at each vertebral level. Anatomic and biochemical changes occur in these joints as the result of aging, but such changes may or may not cause symptoms.
The major focus of spine imaging over the years has been on the mechanical effect that osseous, disk, and joint structures have on adjacent nerves. Although it is important to detect this mechanical effect with imaging, most symptoms of back pain are not related to compression or stretching of an exiting or descending nerve. Pain may arise from the facet joints or disks, regardless of what these structures do to an adjacent spinal nerve root. It has been well established that asymptomatic individuals of all ages have disk abnormalities on imaging studies. The source of a patient’s neck or back pain must be defined carefully by integrating the findings of clinical examination and MRI, often with the aid of diagnostic injections of anesthetic to different spinal structures for confirmation.
Disk Aging and Degeneration ( Table 13-1 )
Features of normal and abnormal disks discussed here apply to disks at any level in the spine because they appear the same whether in the cervical, thoracic, or lumbar regions.
Normal Disk.
Intervertebral disks consist of a central gelatinous nucleus pulposus composed of water and proteoglycans. The nucleus pulposus is surrounded by the annulus fibrosus. The inner portion of the annulus is composed of fibrocartilage, whereas the outer fibers are made of concentrically oriented lamellae of collagen fibers. The annulus is anchored to the adjacent vertebral bodies by Sharpey’s fibers.
On MRI, the ideal normal disk is low signal intensity on T1W images, slightly lower signal than adjacent normal red marrow and very similar to muscle ( Fig. 13-1 ). T2W images show diffuse high signal intensity throughout the disk except for the outer fibers of the annulus, which are homogeneously low signal intensity (see Fig. 13-1 ). Distinction between the nucleus pulposus and the inner annulus fibrosus is impossible by MRI.

Normal disks typically do not extend beyond the margins of the adjacent vertebral bodies; however, diffuse extension beyond the margins by 1 to 2 mm may occur in some histologically normal disks. The posterior margins of disks tend to be mildly concave in the upper lumbar spine, straight at the L4-5 level, and slightly convex at the lumbosacral junction.
Abnormal Nucleus.
With aging and degeneration, the intervertebral disks lose hydration, lose proteoglycans, and gain collagen as they become more fibrous. A horizontally oriented fibrous intranuclear cleft develops in the nucleus.
MRI shows the intranuclear cleft as a horizontal, low signal intensity line that divides the disk into upper and lower halves on T2W sagittal images ( Fig. 13-2 ). Eventually, there is diffuse decreased signal intensity on T2W images from the increased collagen content in the nucleus (see Fig. 13-2 ). The disk progressively loses height with increasing degrees of degeneration.

Abnormal Annulus ( Box 13-2 ).
Aging and biochemical changes in the disks as described earlier are associated with the development of multiple, focal annular tears. Three types of annular tears have been described, but only one type is of practical interest and that is the radial type of tear.
- •
Also called high intensity zones
- •
Often painful
- •
Linear fissures through all or part of thickness of annulus
- •
Run perpendicular to long axis
- •
Usually in posterior annulus of lower lumbar disks
- •
Nerve ingrowth from surface of disk causes pain
- •
Globular or horizontal lines of increased signal in disk substance, T2 and postcontrast T1
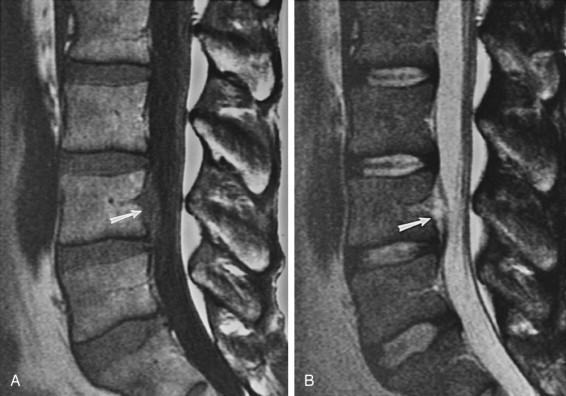
Radial tears (or fissures) involve either part or the entire thickness of the annulus from the nucleus to the outer annular fibers. Radial tears run perpendicular to the long axis of the annulus and occur more commonly in the posterior half of the disk, usually at L4-5 and L5-S1. The radial annular tear is considered by many to be responsible for pain. It may be a pain source because vascularized granulation tissue grows into the tear and causes painful stimulation of nerve endings that also extend into the defect from the surface of the disk; this would result in diskogenic pain. It also may be a pain source because of the instability of the disk that accompanies these fissures and the chemical and mechanical irritation to the nociceptive fibers that normally exist in the annulus. Radial fissures that cause diskogenic pain can be treated by minimally invasive intradiskal therapy (thermal or chemical) or by spinal fusion.
MRI of annular tears shows focal areas of high signal intensity on T2W images or on contrast-enhanced T1W images. Radial tears ( Fig. 13-3 ) may be seen on T2W sagittal images within the posterior annulus as globular or horizontal lines of high signal intensity. On axial images, radial tears may be seen as focal areas of high signal intensity that parallel the outer disk margin for a short distance. Radial tears or fissures on MRI also are referred to as high intensity zones .

Abnormalities in Disk Morphology ( Box 13-3 ).
The terminology for disk abnormalities is confusing and inconsistent in the literature. Many physicians have referred to any and all disk abnormalities that extend beyond the margin of the vertebral body or disk as a herniated disk or herniated nucleus pulposus . The problem with this approach is that most of the abnormalities are of no consequence to the patient and are not associated with symptoms; this explains the high incidence of so-called disk herniations reported in an asymptomatic population. Analogies to this situation would be to call benign bone islands sclerotic foci of undetermined etiology or calcified granulomas in the lungs on a chest x-ray changes of infection . These latter statements are true but of no help to the referring clinician or patient. They do not put the abnormality seen on the imaging study in proper perspective and may be misleading.
Herniated Disk
- •
All-encompassing, nonspecific term to indicate disk extends in some abnormal manner beyond margin of vertebral body
Disk Bulge
- •
Diffuse extension of disk by >2 mm beyond vertebral margin
Disk Protrusion
- •
Focal, small extension of disk beyond vertebral margin
- •
Anteroposterior < mediolateral diameter
- •
No cranial or caudal extension
- •
Usually asymptomatic
- •
Low signal T1 and T2
Disk Extrusion
- •
Greater extension of focal disk material than a protrusion
- •
Frequently symptomatic
- •
Anteroposterior ≥ mediolateral diameter
- •
May migrate craniocaudally, but maintains attachment to parent disk
- •
Decreased signal on T1, decreased or increased on T2
Sequestered Disk
- •
Loss of continuity between extruded disk material and parent disk
- •
Usually symptomatic
- •
Fragment migrates
- •
Cranial or caudal (equally)
- •
Anterior or posterior to posterior longitudinal ligament
- •
Epidural, intrathecal, paraspinous
- •
- •
Contraindication to limited disk procedures
- •
Common cause of failed back surgery, if unrecognized
- •
Decreased signal on T1, decreased or increased on T2 or contrast T1
Most surgeons dealing with spine disorders are starting to use a more standardized nomenclature that helps to distinguish what are likely to be clinically relevant lesions from lesions that probably are not. We use the same terminology as our surgeons to describe abnormalities in disk morphology: diffuse disk bulge, broad-based protrusion, focal disk protrusion, disk extrusion , and sequestered disk ( Fig. 13-4 ). Focal disk abnormalities occur when material from the nucleus extends either partially or completely through radial tears in the annulus. Focal disk abnormalities generally occur in a degenerated disk. The term herniated disk can be used to encompass all of the other, more specific terms outlined here, but in our opinion, it should never be the diagnosis in a report of a spine MRI examination.

When it has been determined that there is a diffuse or focal abnormality in disk contour, we generally try to quantify the abnormality as mild, moderate, or severe in extent. There are no agreed-on definitions for what constitutes these different categories. Our method of quantifying the severity of disk disease is mild if the anterior epidural fat is not obliterated, moderate if the epidural fat is obliterated and the thecal sac is being displaced, and severe if the cord is being effaced or nerve roots displaced.
This is not rocket science. The greatest difficulty is consistency and agreeing to the terms. All we are really evaluating when it comes to abnormalities in disk morphology is whether or not something is sticking out from the normal margin of a disk (like a wart from the skin surface), and by how far (how big the wart is).
Disk Bulge.
A diffusely bulging disk extends symmetrically and circumferentially by more than 2 mm beyond the margins of the adjacent vertebral bodies. This diagnosis is based on axial and sagittal images by comparing the size of the disk with the size of the adjacent vertebral bodies and determining if the central canal and neural foramina are narrowed by the disk ( Fig. 13-5 ). Identifying disk material protruding beyond the vertebral body margins on sagittal images does not clearly define if it is a diffuse or focal disk abnormality. The annulus can be considered lax, and a decrease in disk height and disk signal usually is present on MRI. There are tears in the annulus when there is disk bulging, although they may not be evident on MRI. A long segment of disk tissue that projects beyond the margin of the vertebral body but that does not involve the entire circumference of the disk can be called either a focal bulge or a broad-based protrusion ( Fig. 13-6 ).


Disk Protrusion.
A disk protrusion is a focal, asymmetric extension of disk tissue beyond the vertebral body margin, usually into the spinal canal or neural foramen, that often does not cause symptoms. The base (the mediolateral dimension along the posterior margin of the disk) is broader than any other dimension ( Fig. 13-7 ).

Some of the outer annular fibers remain intact, and some people refer to this as a contained disk . The protruded disk does not extend in a cranial or caudal direction from the parent disk. MRI shows most disk protrusions and their parent disks to have low signal intensity on T1W and T2W images.
Disk Extrusion.
An extruded disk is a more pronounced version of a protrusion and often is responsible for symptoms ( Fig. 13-8 ). There is disruption of the outer fibers of the annulus, and the disk abnormality usually is greater in its anteroposterior dimension than it is at its base (mediolateral dimension). The extruded disk may migrate up or down behind the adjacent vertebral bodies but maintains continuity with the parent disk. These also may be referred to as noncontained disks . MRI shows the described contour abnormalities, and because of a significant inflammatory reaction that may occur in response to the extruded disk material, there may be high signal intensity on T2W and contrast-enhanced T1W images in or surrounding the disk. The typical appearance is the same signal intensity as the parent disk on all pulse sequences.

Lumbar disk extrusions that cause radiculopathy but that are managed nonoperatively have been shown to do well about 90% of the time. Spontaneous reduction in size of disk extrusions and protrusions that were managed conservatively has been well documented with imaging ( Fig. 13-9 ). The regression in disk size may not be the reason for reduction in pain. Much of the pain from extruded disks is probably from the inflammatory response to them rather than from compression of neural elements from the mass effect.

Caution is advised when using the terms extrusion and extruded . Some clinicians use the terms synonymously, whereas others apply the term extruded to indicate a free fragment or sequestration. This differentiation can make a huge difference. We have seen surgeons search needlessly (and without success) for a suspected sequestration because the term extruded was used in describing the disk bulge. Conversely, we have seen sequestrations left behind at surgery because they were called extruded disks , and the surgeon thought this term was referring simply to the extrusion. Because it can be confusing and can result in patient mismanagement, some of us have abandoned the terms extrusion and extruded and replaced them with protrusion and sequestration . Others in our group have adopted the nomenclature initially mentioned, which is recommended by several spine societies.
Sequestered Disk.
When extruded disk material loses its attachment to the parent disk, it is called a sequestered fragment ( Fig. 13-10 ). These fragments may migrate in a cranial or caudal direction with equal frequency and generally remain within about 5 mm of the parent disk. They may be located between the posterior longitudinal ligament and the osseous spine or extend through the posterior ligament into the epidural space. They almost always remain in the anterior epidural space, but occasionally the fragment may migrate into the posterior epidural space. Rarely, sequestered fragments may enter the dural sac or migrate into the paraspinous soft tissues. It is extremely important to recognize these fragments because they may be overlooked at surgery. Some clinicians believe missed sequestrations are the leading cause of failed disk surgery. Sequestrations are a contraindication to chymopapain, percutaneous diskectomy, and other limited disk procedures. The fragment of disk material that migrates from the parent disk often shows peripheral or diffuse high signal intensity on T2W and contrast-enhanced T1W images, caused by the inflammatory reaction within or surrounding it. Otherwise, a low signal intensity mass resembling the signal of the parent disk is seen.

Location of Focal Disk Abnormalities ( Box 13-4 ).
A focal disk abnormality should be defined as to size, contour, location, and relationship to nerves or other important structures. The location of a focal disk abnormality needs to be conveyed accurately so that the surgical approach can be planned properly or so that it can be determined whether symptoms correlate to the anatomic abnormality seen on MRI. Focal disk abnormalities that remain at the level of the parent disk should be described as being central, left or right paracentral, left or right foraminal , or left or right extraforaminal (also called lateral or far lateral ) ( Fig. 13-11 ).
- •
Approximately one third of asymptomatic individuals have focal lumbar disk contour abnormalities on MRI
- •
Only 1% of asymptomatic patients have a disk extrusion by MRI
- •
About 90% of focal disk contour abnormalities occur at L4-5 and L5-S1 in the lumbar region, and at C5-6 and C6-7 in the cervical spine
- •
>90% of focal disk contour abnormalities in the lumbar spine affect the central and paracentral regions.

More than 90% of focal lumbar disk abnormalities affect the spinal canal (central and paracentral regions), whereas approximately 4% occur in the neural foramen, and another 4% occur in the extraforaminal regions. Individuals with symptoms of an L5 nerve abnormality almost always have a disk abnormality in the canal at the L4-5 level in the central or paracentral regions. An extraforaminal (lateral) disk at L5-S1 could cause the same symptoms as a posterior L4-5 disk, however, because it would be impinging on the L5 nerve that already exited.
About 90% of all focal disk abnormalities in the lumbar spine occur at L4-5 or L5-S1. Most focal degenerative disk abnormalities occur at C5-6 and C6-7 in the cervical spine, and very few focal disk abnormalities occur scattered throughout the thoracic spine. It is helpful to describe which nerve is affected by a disk abnormality; cervical nerves exit above the level of their respective disk level until C8, and then the nerves exit below. For example, a right paracentral C4-5 disk extrusion would impinge on the descending C6 nerve; similarly positioned right paracentral disk extrusions at T4-5 and L4-5 would nail the right descending T5 and L5 nerves. Intraforaminal extrusions at C4-5 would affect the exiting C5 nerve, whereas at T4-5 and L4-5 the exiting T4 and L4 nerves would be impinged on.
Significance of Disk Contour Abnormalities ( Box 13-5 ).
MRI is extremely sensitive in detecting abnormalities in the configuration of disks. The problem is that many of these abnormalities do not cause symptoms, or at least not on the basis of nerve compression at that site.
- •
Neural compression
- •
Chemical irritation of nerves
- •
Osseous abnormalities
- •
Segmental instability
- •
Spinal stenosis
- •
Pain
Disk abnormalities are frequent in asymptomatic patients. Twenty percent of patients younger than 60 years old and 36% of patients older than 60 have one or more focal disk abnormalities of the lumbar spine, but no symptoms. If the distinction is made between disk protrusions and extrusions, however, the findings are much more encouraging. Only 1% of asymptomatic patients have evidence of a disk extrusion by MRI. Extrusions are much more likely to be significant and cause symptoms.
Mechanical compression of a nerve by a focal disk abnormality may cause symptoms of dysesthesias and muscle weakness, but not pain symptoms. One theory for back pain is that the body reacts to displaced nucleus pulposus material with a foreign body–type inflammatory reaction. High levels of phospholipase A 2 enzyme have been found in degenerated disk material; this is also the active enzyme in snake venom and in the pannus of rheumatoid arthritis that generates inflammatory mediators, such as prostaglandins, leukotrienes, and platelet-activating factor. It is believed that a severe inflammatory reaction to displaced nuclear material may irritate surrounding nerves and produce pain and radicular symptoms, even in the absence of extension of disk into the spinal canal.
Disk-Related Compressive Myelopathy and Epidural Hematoma.
High signal intensity areas on T2W images can be seen within the spinal cord at the point of spinal stenosis secondary to a disk bulge or extrusion ( Fig. 13-12 ). This high signal intensity may be from focal myelomalacia owing to ischemia to the cord. These cord lesions may or may not disappear after decompressive surgery.

Small spontaneous epidural hematomas sometimes may occur in association with disk herniations from tearing of the fragile epidural vessels. This condition may be impossible to distinguish from a sequestered or extruded disk located posterior to the vertebral body ( Fig. 13-13 ).
Epidural hematomas can be quite large and cause significant acute symptoms similar to those of an acute disk protrusion. They typically resolve rapidly, thus surgery is not performed. In many cases, surgery fails to detect an abnormality because at surgery the blood products are removed by the suction device (blood looks like blood at surgery), and no or only a little abnormal disk material is found. Epidural hematomas have a characteristic appearance on MRI ( Fig. 13-14 ). They are typically large, are retrovertebral, often have some high signal on T1 sequences (blood products), and decrease in size with serial imaging. We often mention that an epidural hematoma should be considered when we see what looks like a large sequestration because the treatment for each is different. With nonoperative treatment, an epidural hematoma resolves.

Disk Mimickers ( Box 13-6 ).
Abnormalities and normal variants may mimic a sequestered disk on MRI; synovial cysts from the facet joints, conjoined nerve roots, arachnoid diverticula, perineural cysts, and nerve sheath tumors arising from the nerve roots may cause confusion. We also have seen bullet fragments and cement from vertebroplasties ( Fig. 13-15 ) within the spinal canal resembling the appearance of a sequestered disk; radiologists need to keep their minds open to the possibilities.
- •
Synovial cyst
- •
Conjoined nerve root
- •
Arachnoid diverticulum
- •
Perineural (Tarlov) cyst
- •
Nerve sheath tumors
- •
Small epidural hematoma

The signal intensity of dilated nerve root sleeves (Tarlov cysts or arachnoid diverticula), which is identical to cerebrospinal fluid (CSF), should allow differentiation from a disk fragment. A conjoined nerve is two nerve roots exiting the thecal sac at the same location; the roots can be seen within the mass on T2W images, and the lateral recess on the side of the conjoined nerve root is enlarged, indicating that this is a long-standing process.
Vacuum Disks and Vertebral Bodies.
Aside from abnormalities in disk contour, another manifestation of disk degeneration occurs from desiccation of the disk with the formation of cracks or clefts in the nuclear material, which may fill with nitrogen that comes out of solution from adjacent extracellular fluid. When this finding is present, it essentially excludes the possibility of superimposed infection or tumor involving the disk. MRI shows the vacuum disk as a horizontally oriented, linear signal void on all pulse sequences ( Fig. 13-16 ).

Cracks in the vertebral body end plates can allow nitrogen from the adjacent vacuum disk to seep into the vertebral body, forming an intraosseous vacuum cleft. This appearance has long been thought to be the result of osteonecrosis; in many cases it is simply a manifestation of degenerative disk disease and osteoporotic fractures combining to create this appearance. The intraosseous vacuum has an appearance similar to the vacuum disk, with linear signal void on all MRI pulse sequences if it is filled with gas, or intermediate signal on T1W and high signal on T2W images if it is filled with fluid (see later).
The presence of a vacuum cleft within a disk or vertebral body tends to occur with extension of the spine. The contents of the clefts may change when the patient is in a supine or flexed position. Within 1 hour of being placed supine in an MRI unit, the nitrogen-filled clefts may be replaced with fluid that is high signal intensity on T2W images ( Fig. 13-17 ; see Fig. 13-16 ). These must not be confused with infection or other pathology.

Calcified Disks.
Intervertebral disks are nourished via a vascular supply to the outermost fibers of the annulus fibrosus, but the bulk of the disk receives nourishment by diffusion through the adjacent end plates, which requires motion and stresses to occur. Calcification of the disks may occur from degenerative changes and aging, limited motion of the spine (ankylosing spondylitis, diffuse idiopathic skeletal hyperostosis, surgical fusion, old trauma, or infection), calcium pyrophosphate dihydrate crystal deposition disease, ochronosis, or hemochromatosis, among others.
MRI may show small amounts of calcium in the disks that are not evident by plain film or computed tomography (CT), which are high signal intensity on T1W images ( Fig. 13-18 ). The appearance on T2W images varies. As more calcium is deposited in the disks, they show low signal intensity on T1W and T2W images (see Fig. 13-17 ).

Osseous Degenerative Changes ( Box 13-7 )
Vertebral Bodies.
The vertebral bodies respond to degenerative changes in the adjacent intervertebral disks in two major ways: (1) formation of osteophytes and (2) marrow changes paralleling the end plates. Osteophytes are the excrescences of bone that occur on the upper or lower margins of vertebral bodies. They occur as disks degenerate and bulge, placing traction stresses on Sharpey’s fibers, which attach the disks to the vertebral bodies. Osteophytes usually are located anteriorly in the lumbar and thoracic spine, but are commonly anterior or posterior in the cervical spine.
Vertebral Bodies
- •
Osteophytes
- •
Marrow changes (Modic)
- •
Focal or diffuse bands parallel to end plates
Type 1: Decreased signal T1, increased signal T2 (inflammatory tissue)
Type 2: Increased signal T1, follows fat on T2 (focal conversion to fat)
Type 3: Decreased signal T1 and T2 (sclerosis)
- •
Facet Joints
- •
Degenerative joint disease
- •
Cartilage loss, subchondral sclerosis, or cysts
- •
Osteophytes with overgrowth of articular processes
- •
Synovial cysts
- •
Buckling of ligamentum flavum into canal
- •
Marrow changes in adjacent pedicles
- •
Posterior Spinous Processes (Baastrup’s Disease)
- •
Associated with lordosis, facet degenerative joint disease, disk degeneration
- •
Breakdown of interspinous ligaments
- •
Bursae form between spinous processes (high signal on T2)
- •
Decreased space between spinous processes
- •
- •
Spinous processes in contact
- •
Subcortical sclerosis, cysts
- •
Faceted appearance
- •
Osteophytes, enthesophytes
- •
In the cervical spine, disk abnormalities so commonly are accompanied by osteophytes that we refer to the combination of osteophytes and disk as disko-osteophytic material . Diffuse disko-osteophytic bulging or focal disko-osteophytic protrusions are common in the cervical spine. MRI of most osteophytes shows low signal intensity cortical margins with fatty marrow centers that follow the signal of fat on all pulse sequences. In the cervical spine, osteophytes may be more diffusely sclerotic (mainly cortical rather than medullary bone) and sometimes difficult to distinguish from disk material. Cervical disks are high signal intensity on gradient echo axial images, but the low signal outer fibers of the annulus and of the posterior longitudinal ligament may be difficult to distinguish from the cortical bone of osteophytes. It is sometimes difficult to determine if there is only a disk protruding into the canal, or if there is an osteophyte as well. On gradient echo axial sequences through the cervical spine, osteophytes are very low signal intensity. There may be blooming artifact from the sclerotic portions of the osteophytes that results in inaccurate overestimation of the size of osteophytes and their effect on the neural foramina or central canal. T1W images may be helpful in more accurately estimating stenosis and in determining what is osteophyte versus disk.
The marrow in vertebral bodies adjacent to degenerated disks may change in response to the disk disease. Parallel bands of abnormal signal in the end plates have been divided into two types by Modic and colleagues, and a third type by other authors; these typically are called Modic type 1, 2 , or 3 changes . These marrow changes may be focal or diffuse along the end plate but tend to be linear and always parallel to the end plates.
Type 1 changes are the earliest marrow changes encountered. These consist of inflammatory and granulomatous tissue in the marrow that is low signal intensity on T1W images and becomes high signal intensity on T2W sequences ( Fig. 13-19 ). This appearance may raise the question of spondylodiskitis, but disk infection has intradiskal high signal intensity on T2W images, whereas it would be unusual to have high signal intensity in an uninfected, degenerated disk adjacent to these osseous changes, making the distinction straightforward. Intact cortical end plates, lack of paraspinous inflammatory change, and preservation of the intranuclear cleft also allow the diagnosis of infection to be excluded with confidence.

Type 2 changes consist of signal intensity typical of fat on all pulse sequences, caused by focal fatty marrow conversion (see Fig. 13-19 ). These findings are common on spine MRI. Type 3 end plate changes result from sclerosis and have low signal intensity on all pulse sequences (see Fig. 13-16 ).
Facet Joints.
The facet joints are formed by the inferior articular process of the vertebra above articulating with the superior articular process of the lower vertebra. The articular surfaces are covered with hyaline cartilage. The osseous structures are enveloped in a joint capsule lined by synovium; these are true synovial joints. The anterior aspects of the facet joints and the laminae are covered by the ligamentum flavum.
These joints frequently undergo degenerative changes, especially in the middle and lower cervical spine and the lower lumbar spine and lumbosacral junction. Degenerative changes of the facet joints manifest as cartilage fibrillation with joint space narrowing, subchondral sclerosis, subchondral cysts, and osteophyte formation that result in overgrowth or hypertrophy of the osseous portions of the joints. Changes in the marrow of pedicles adjacent to facet degenerative joint disease may occur, similar to that seen in vertebral body end plates adjacent to degenerative disk disease, as a result of increased stresses. Synovial cysts may develop from degenerated spinal facet joints and project either anteriorly (through the ligamentum flavum) or posteriorly from the joints. Loss of cartilage from degenerative changes in the facet joints in concert with loss of disk height from degenerative disk disease leads to inward buckling of the ligamentum flavum, which causes narrowing of the neural foramina or central canal.
Symptoms from degenerative changes of the facet joints may result from compression of adjacent neural structures (spinal stenosis) by overgrowth of the bone, inward buckling of the ligamentum flavum, protrusion of synovial cysts into the spinal canal, or the joints themselves being painful. Degenerated facet joints not only can cause local pain at the facet joints but also frequently are responsible for referred pain patterns to the shoulders or interscapular regions from cervical disease or to the buttocks, thighs, and hips from lumbar facet syndromes. As always, the presence of abnormalities on MRI examination does not indicate which, if any, of these joints is responsible for pain in a given patient. Additional work-up with injection of anesthetic into facet joints is the only way to document if a facet joint is responsible for some or all of the symptoms.
MRI of degenerative facet joint disease ( Fig. 13-20 ) is typical of degenerative changes in any joint (subchondral sclerosis is low signal intensity on all pulse sequences; cysts are low signal intensity on T1W and high signal intensity on T2W images). There often are increased amounts of fluid in the joints, seen as high signal on T2W images. The osteophytes and hypertrophic osseous changes create a rounded and enlarged (Portobello mushroom) appearance of the articular processes of the facets on axial images that may affect the appearance of the adjacent spinal canal, lateral recesses, or neural foramina. Signal intensity changes (Modic changes) in the pedicles adjacent to facet joint degeneration may be seen (see Fig. 13-20 ) and sometimes are easier to identify than the degenerative changes themselves. These can be Modic type 1, 2, or 3 signal changes but are most commonly type 2 (fat signal).

Synovial cysts are rounded masses of varying size and sometimes variable signal intensity ( Fig. 13-21 ). They are generally low signal intensity on T1W images, but because of hemorrhage into the cyst or high protein content, they occasionally may be relatively high signal intensity on T1W images. T2W images generally show high signal intensity or mixed signal intensity relating to the presence of calcifications (in ≤30%) and vacuum phenomenon. Contrast-enhanced images show peripheral enhancement with an appearance similar to a sequestered disk. Most sequestered disk fragments are not located posteriorly in the spinal canal or are not diffusely high signal intensity on T2W images, whereas a synovial cyst is. A synovial cyst always lies immediately adjacent to the facet joint, but a communication is not shown on MRI. A synovial cyst can be differentiated from a sequestered disk fragment with certainty by injecting contrast material into the facet joint and showing filling of the cyst under fluoroscopy.

Posterior Spinous Processes.
Degenerative changes of the spinous processes and intervening interspinous soft tissues (kissing spine or Baastrup’s disease) may occur as the result of hyperlordosis in the cervical or lumbar spine or from associated degenerative disk or facet joint disease, which places increased stresses on these posterior structures. Close apposition of adjacent spinous processes causes laxity of the overlying supraspinous ligament and damage to the intervening interspinous ligaments. The interspinous ligament becomes fibrillated and torn, producing spaces in the ligament that may lead to formation of bursae or, eventually, true synovial joints between spinous processes. Breakdown of the interspinous ligaments causes excessive motion and leads to instability with direct contact between spinous processes that may result in eburnation of the bone, a faceted appearance, osteophytes, or degenerative enthesophytes. These changes sometimes cause pain symptoms.
The main appearance to be aware of on MRI is the high signal intensity bursal fluid collections between spinous processes on T2W images ( Fig. 13-22 ). Also, the lack of space between adjacent spinous processes, flattening of the superior or inferior surfaces (faceted appearance), and low signal intensity eburnation (sclerosis) on all pulse sequences are identified. Sometimes, degenerative cysts are noted in the spinous processes where they chronically abut; these cysts have low signal intensity on T1W images that becomes hyperintense on T2W images.

SPINAL STENOSIS ( Box 13-8 )
Spinal stenosis is narrowing of the central spinal canal, neural foramen, lateral recess, or any combination of these anatomic regions, by soft tissue or osseous structures that impinge on neural elements and may result in symptoms. The standard classification for spinal stenosis is based on cause and includes congenital (eg, short pedicle syndrome, achondroplasia) or acquired (usually degenerative) causes. Even if there are congenital abnormalities of the spine that narrow the canal, patients rarely have symptoms of spinal stenosis, unless they have superimposed degenerative changes (acquired stenosis). Among some miscellaneous causes of spinal stenosis are spondylolysis (pars defect) with spondylolisthesis (anterior or posterior subluxation), ossification of the posterior longitudinal ligament, epidural lipomatosis, or osseous abnormalities such as fracture or Paget’s disease, among many others.
Sites of Involvement
- •
Central canal
- •
Neural foramina
- •
Lateral recesses
Causes
- •
Degenerative
- •
Disk contour abnormalities (bulges, herniations)
- •
Vertebral body osteophytes
- •
Degenerative spondylolisthesis
- •
Facet joint degeneration, osteophytes, synovial cysts
- •
Ligamentum flavum buckling
- •
- •
Congenital short pedicles
- •
Usually requires superimposed degeneration to be symptomatic
- •
- •
Any mass arising from bone, disk, or within canal
- •
Osseous tumor, fracture fragments
- •
Spondylolysis, spondylolisthesis
- •
Ossification of posterior longitudinal ligament
- •
Epidural lipomatosis, hematoma, abscess, tumor, scarring
- •
Complications
- •
Pain symptoms
- •
Cord myelomalacia from ischemia
- •
Nerve root edema
Symptoms from multilevel spinal stenosis are often nonspecific and include back pain, intermittent neurogenic claudication, extremity radiculopathy, pain with hyperextension relieved by flexion, and pain on standing relieved by lying down. The presence of imaging findings of spinal stenosis does not indicate that a patient has symptoms from the stenosis. Just as arteriosclerotic calcification of the coronary arteries on a chest CT scan does not confirm that the patient’s chest pain is from angina, abnormalities of the spine on imaging do not indicate the patient must have symptoms relating to the abnormalities. Clinical examination and other tests must be correlated with MRI studies in the spine (and elsewhere) to avoid errors in managing patients.
Spinal stenosis may occur at one or more levels in the spine and almost always is the result of several degenerative processes occurring in concert. When disks degenerate and lose height, and the articular cartilage in the facet joints is lost, there may be motion of one vertebral segment relative to the adjacent one; this motion causes degenerative spondylolisthesis, which results in spinal stenosis. As the spine loses height from these same degenerative changes, the ligamentum flavum buckles inward toward the canal and neural foramina, also resulting in spinal stenosis. Other degenerative changes that lead to spinal stenosis include diffuse or focal abnormalities in disk contour, vertebral body osteophytes, facet joint osteophytes (hypertrophy), and facet joint synovial cysts.
Central Canal Stenosis
Central canal stenosis usually is the result of facet joint osteophytes and inward buckling of the ligamentum flavum posteriorly, with disk bulging anteriorly in the canal. Vertebral body osteophytes (especially in the cervical spine) also may contribute to central canal stenosis, as can postoperative scarring. We do not use measurements to determine if there is central stenosis, but use the shape of the canal and thecal sac instead. Normally, the central canal and thecal sac are round or nearly round (a plump oval) structures on axial images ( Fig. 13-23 ); if they become flattened ovals or triangular in shape, it indicates central stenosis ( Figs. 13-24 to 13-26 ). We quantitate the degree of stenosis as mild, moderate, or severe as part of our dictated report, but there are no universally agreed-on objective definitions for these terms. Severe central stenosis can cause edema in the affected nerve roots, or, in the cervical spine, there may be abnormalities of the cord, probably myelomalacia from ischemia at the site of stenosis, which is high signal intensity on T2W images (see Fig. 13-24 ).


Lateral Recess Stenosis.
Lateral recess stenosis usually is caused by hypertrophic degenerative changes of the facet joints, or less commonly by a disk fragment or postoperative fibrosis. Lateral recesses are located on the medial aspects of pedicles. Nerve roots lie in these recesses after leaving the thecal sac, but before entering the exiting neural foramina. There is a neural foramen bordering the upper and the lower margins of a lateral recess. Measurements are not used to determine if this recess is stenotic. If there is deformity in the shape of the recess, and the descending nerve is displaced or compressed, there is lateral recess stenosis ( Fig. 13-27 ). This space is best evaluated in the axial plane of imaging.

Neural Foramen Stenosis
Neural foramen stenosis occurs as a result of degenerative osteophytes of the facet joints or of the uncovertebral joints in the cervical spine; inward buckling of the ligamentum flavum (which forms the posterior aspect of the foramina); a foraminal disk protrusion, extrusion, or sequestered fragment; a diffuse disk bulge; or postoperative fibrosis. Narrowing of the neural foramina can be evaluated on sagittal and axial images. On sagittal images, the normal neural foramen has the appearance of a vertical oval. If disk material extends into the foramen, the oval narrows inferiorly, creating a keyhole shape ( Fig. 13-28 ). Axial images may be more accurate for diagnosis because they show more of the extent of each foramen ( Figs. 13-29 and 13-30 ).


Related posts:
Stay updated, free articles. Join our Telegram channel

Full access? Get Clinical Tree


