and A. Orlando Ortiz2
(1)
Section of Musculoskeletal Radiology, Department of Radiology, Winthrop-University Hospital, Mineola, NY, USA
(2)
Department of Radiology, Winthrop-University Hospital, Mineola, NY, USA
Keywords
Degenerative disk diseaseGoutHemodialysisNeuropathic osteoarthropathySpine: infection, neoplasm, traumaSpondyloarthropathy: seronegativeSpondylosisLearning Objectives
- 1.
To introduce and describe several pathologic entities with imaging manifestations in the spine that simulate spine infection
- 2.
To learn to identify and discriminate these mimics from spine infection
- 3.
To understand the utility of image-guided percutaneous spine biopsy when indicated to assess for possible spine infection
10.1 Introduction
The diagnosis of spine infection can be challenging on either a clinical basis or even with highly sensitive imaging studies such as magnetic resonance imaging (MRI). With back pain as a very ubiquitous patient complaint, it is not uncommon to encounter clinical situations in which the imaging study shows findings that resemble, but are not, spine infection. The diagnosis of spine infection cannot always be solely based upon imaging findings. It is in the context of this clinical management dilemma that this chapter intends to describe and analyze diagnostic entities that may mimic the imaging presentation of spine infection. In general, the radiologic differential diagnosis for spine infection includes degenerative disk disease, diskectomy, spondyloarthropathy, and, less commonly, trauma and neoplasm. The findings of some of these so-called spine infection mimics simulate the appearance of infection so closely that, in many instances, a spine biopsy is required to exclude the possibility of spine infection. It is important to understand that the clinical management of these entities is different than what would be seen with spine infection. Hence, a spine biopsy may be required in order to facilitate arriving at the correct clinical diagnosis.
Table 10.1
Spine infection: radiologic differential diagnosis
Common | Less common |
|---|---|
Degenerative disk disease Type 1 reactive vertebral endplate changes Schmorl’s nodes | Trauma Spine trauma Osteoporotic vertebral compression fracture Chronic low-grade trauma Neuropathic osteoarthropathy |
Disk intervention Diskectomy Disk injection procedures Other spine surgery | Neoplasm Primary neoplasm (chordoma) Metastatic disease Lymphoma, myeloma |
Spondyloarthropathy Gout Chronic hemodialysis Seronegative spondyloarthritis | Other Sarcoid |
The radiologic differential diagnosis for spine infection includes degenerative disk disease, diskectomy, spondyloarthropathy, and, less commonly, trauma and neoplasm.
10.2 Degenerative Disk Disease
This condition is encountered in the majority of spine imaging examinations that are performed in the adult population. The frequency and severity of imaging findings tend to increase with the age of the patient. Given the increased weight-bearing stress that is placed upon the lumbar spine, degenerative disk disease is often seen within the lower lumbar intervertebral disk spaces, including L4–L5 and L5–S1.One or more of the intervertebral disk space levels may be affected. Disk space narrowing at the affected level is usually present. Anterior spur formation may be seen particularly in elderly patients. A disk bulge, protrusion, or extrusion may also be present. Fibrovascular changes in the adjacent vertebral endplates result in varying amounts of T1 hypointensity and T2 hyperintensity within the affected endplates, the so-called type 1 change (Modic et al. 1988). These MR signal changes may occur in a horizontal band-like or triangular pattern. Because there is altered vascularity within the endplates, contrast enhancement is observed and is more pronounced on fat-suppressed T1-weighted MR images. Intradiskal post-contrast enhancement is distinctly absent. Another pattern (type 2) is due to fat deposition within the affected vertebral endplates resulting in T1 hyperintensity and T2 iso- or hypointensity with no associated contrast enhancement. The degenerative cascade ultimately progresses to osseous growth within the vertebral endplates that is manifested as sclerosis on radiographic or CT examinations and on MRI is hypointense on both T1 and T2 sequences (type 3 change). Thus, it is the type 1 reactive endplate change in degenerative disk disease that can at times be confused for spine infection, especially when the reactive change is exuberant (Fig. 10.1). The disk-endplate margin remains relatively intact in early reactive endplate changes which may help to distinguish this entity from spondylodiskitis. A focal diffusion pattern, or “claw” sign, on MR diffusion-weighted sequences is reported to be present in type 1 reactive endplate change (Fig. 10.1) (Patel et al. 2014). Some authors postulate that disk infection with Propionibacterium acnes bacteria, a low-virulence skin microbe, may play a role in the development of these reactive endplate changes and have reported improvement in low back pain and disability following treatment with antibiotics in a double-blind randomized clinical trial (Albert et al. 2013). In the presence of aggressive reactive endplate changes in patients with degenerative disk disease, if there is a reasonable clinical suspicion for spine infection, then the possibility of a spine biopsy may be considered.

Fig. 10.1
A 75-year-old female with severe mid-back pain. T1-weighted sagittal image (a) shows triangular areas of low signal intensity (arrows) at the T10–T11 level. These show mixed hypo- and hyperintensity (arrows) on the T2-weighted sequence (b) as well as a small disk protrusion (curved arrow). The inversion recovery sagittal image (c) shows focal hyperintensity within the anterior aspect of the disk (arrow). The fat-suppressed contrast-enhanced T1-weighted sagittal image (d) shows enhancement within the anterior disk and in the endplates (arrow). The patient was referred for a spine biopsy for suspected spine infection. A serum infection profile (WBC with differential, ESR, and CRP) was drawn and was normal. Therefore, the MR study was repeated with a diffusion-weighted sequence (e) which shows the presence of a “claw” sign (arrows) – indicating the presence of reactive endplate change. A lateral fluoroscopic image of the thoracic spine (f) shows disk space narrowing (arrow) and endplate sclerosis (curved arrows). An axial CT image (g) in bone window algorithm obtained during a subsequent thoracic epidural steroid injection procedure shows scattered sclerotic foci (arrows)
Type 1 reactive endplate change in degenerative disk disease, consisting of fibrovascular replacement, can at times be confused for spine infection, especially when the reactive change is exuberant.
10.3 Schmorl’s Nodes (Intravertebral Disk Prolapse)
A Schmorl’s node is a focal prolapse of disk material (annulus fibrosis and/or nucleus pulposus) through the superior or inferior vertebral endplate into the vertebral body. Schmorl’s nodes have a bimodal age distribution and are seen in young adolescents and patients in their sixth decade of life and beyond (Stabler et al. 1997). Males are affected much more frequently (76% of cases) than females (Mattei and Rehman 2014). The etiology of this acquired condition is variable and includes trauma, degenerative disk disease, and metabolic and neoplastic disorders. Schmorl’s nodes can be found anywhere along the spinal axis, but are most frequently encountered within the lower thoracic spine and the upper lumbar spine. They are most commonly located within the mid-portion of vertebral body (Mattei and Rehman 2014). When trauma is the precipitating event, an axial loading mechanism is responsible for Schmorl’s node formation (Wagner et al. 2000a). The other etiologic entities are thought to weaken the vertebral endplate, subsequently leading to intraosseous extension of the disk material. Schmorl’s nodes can be associated with focal axial back pain that localizes to the vertebral body level of the Schmorl’s node. Alternatively, they may be incidental findings that are seen during spine imaging examinations performed for other clinical indications.
Regardless of the etiology and the patient’s clinical presentation, Schmorl’s node imaging presentation on MR examinations can be quite striking and may even simulate infection. The prolapsed disk material elicits an inflammatory response in the surrounding bone (Fig. 10.2). This manifests as a zone or band of T1 hypointensity and T2 hyperintensity. There may be alternating zones of inflammation with Schmorl’s node at the center, which may create a target-like appearance. Since the vertebral endplates are vascularized structures, the inflammatory reaction surrounding Schmorl’s node may create a vascular response at the margin of Schmorl’s node. This zone of vascular proliferation will show enhancement on contrast-enhanced MRI studies (Stabler et al. 1997). To a certain extent, there is an overlap in this type of reactive endplate process and what is seen in the degenerative disk reactive endplate change cascade. MR may show Schmorl’s nodes with surrounding fatty replacement or sclerotic reaction (which can also be seen on plain radiographs or CT examinations). Additionally, the two processes, degenerative disk disease and Schmorl’s node formation, may be superimposed. But when there is prominent signal alteration and enhancement within and about the affected disk and Schmorl’s node, the MR imaging findings may mimic spondylodiskitis.

Fig. 10.2
A 78-year-old male with history of prostate cancer. T1-weighted sagittal image (a) shows a Schmorl’s node (curved arrow) involving the inferior endplate of L3. A peripheral zone of T2 hyperintensity (arrow) surrounds the Schmorl’s node (b). The T1 axial image (c) shows a round zone of hyperintensity (arrow) surrounding the Schmorl’s node. The fat-suppressed contrast-enhanced T1-weighted sagittal (d) and axial (e) image shows focal enhancement within the Schmorl’s node and adjacent marrow (arrows). A sagittal CT reformation in bone window algorithm (f) shows the focal endplate defect (curved arrow) and the patchy reactive bone formation (arrow) along the margin of this intravertebral disk protrusion
Fortunately, in the case of Schmorl’s nodes, there are a few imaging findings that may indicate the diagnosis. First, the preponderance of pathologic findings in Schmorl’s node formation is within the affected vertebral endplate and the adjacent portion of the vertebral trabeculae and marrow. This is where the corresponding MR signal and enhancement findings will be encountered with Schmorl’s node formation. In contrast, disk space infection shows signal and enhancement abnormalities within the disk. A target-like pattern of alternating zones of signal change with peripheral enhancement adjacent to the vertebral endplate as seen on multiplanar MR images may also indicate the presence of Schmorl’s node. The focal location within the mid-portion of the vertebral endplate may also suggest the presence of Schmorl’s node. Lastly, Schmorl’s nodes can occur at multiple vertebral levels within the same patient and may also show some variation in MR signal and enhancement characteristics. This constellation of imaging findings with respect to MR signal and enhancement pattern, location, and lesion multiplicity may strongly suggest the diagnosis and obviate the requirement for spine biopsy.
A target-like pattern of alternating zones of signal change with peripheral enhancement adjacent to the vertebral endplate as seen on multiplanar MR images may suggest the presence of Schmorl’s node.
10.4 Disk Intervention
The MR imaging appearance in patients who have recently undergone a diskectomy or disk injection procedure can have features that overlap those that are seen with disk space infection (Fig. 10.3). Patients, who have undergone other spine surgical procedures whether open or percutaneous, may also demonstrate postsurgical imaging findings that can overlap with those of spine infection (Fig. 10.4). The diskectomy procedure is being performed on a disk that has already been injured; fissuring of the annulus fibrosis is associated with protrusion or extrusion of disk material. The herniated disk fragment is resected, a mechanical excision that further disturbs the normal architecture of the disk and vertebral endplate. Therefore, it is expected that the disk signal on T1- and T2-weighted images will be altered as compared to nearby normal disks. Additionally, contrast-enhanced MRI will show focal enhancement at the surgical site. Two thin bands of linear enhancement that extend within the disk annulus parallel to the vertebral endplates, with or without enhancement in the endplates, have been reported in 20% of asymptomatic post-diskectomy patients (Ross et al. 1996). It is when this pattern of signal and enhancement change starts to extend beyond the surgical site that the possibility of infection should be considered (Bittane et al. 2014; Boden et al. 1992).


Fig. 10.3
A 73-year-old male with neck pain. Lateral fluoroscopic image (a) obtained during C4–C5 anesthetic injection (arrow). Patient’s pain improved, and a follow-up MRI for evaluation of prostate cancer shows diffuse-increased signal within the vertebral bodies (large arrows) and C4–C5 disk (small arrow) on the T2 sagittal image (b). The fat-suppressed contrast-enhanced T1-weighted sagittal image (c) shows vertebral body enhancement (arrows) and prevertebral soft tissue enhancement (curved arrow). The patient remained asymptomatic and his serum infection profile was normal
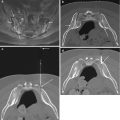
Fig. 10.4
A 70-year-old female with history of osteoporosis and recent lower thoracic vertebral augmentation presents with severe upper thoracic back pain. T1-weighted sagittal image (a) shows round hypointense foci of low signal intensity (large arrows) at T9 and T11 from the recent vertebral augmentation procedures. Additionally, T1 hypointensity (curved arrows) is seen at the T10–T11 endplates. A subtle hypointense band of marrow edema is associated with mild height loss at T6 (small arrow). The T2 sagittal image (b) shows areas of hyperintense signal within the T11 vertebral body, T10–T11 disk, and T10 endplate (large arrows). A hyperintense band of marrow edema (small arrow) is seen within the T6 vertebral body. The signal changes are further accentuated at T10–T11 (arrow) on the STIR sagittal image (c). A lateral fluoroscopic image (d) shows the treated T9 and T11 vertebral compression fractures (arrows); there was no tenderness to palpation on physical examination at these levels. The patient’s back pain was due to the acute T6 vertebral compression fracture
Distinguishing between “normal” post-diskectomy changes and an infected diskectomy site is challenging, the latter being suggested by extensive intradiskal and vertebral endplate enhancement on contrast-enhanced MR images.
10.5 Spondyloarthropathies
10.5.1 Gout
Gout is the most common crystalline type of arthropathy in the United States, and its incidence and prevalence are steadily increasing (Lawrence et al. 2008). Gout typically affects the appendicular skeleton resulting in the deposition of monosodium urate crystals within intra- or extra-articular sites. The intra-articular deposition of these monosodium urate crystals results in an acute inflammatory response; this leads to osseous erosions and progressive destruction of bones and joints. When long-standing and severe, gout can progress to form chalky white tophi (chronic tophaceous gout). When examined under polarized light, urate crystals characteristically demonstrate a needle shape with strong negative birefringence.
Establishing a diagnosis of gout is most commonly performed on the basis of clinical and laboratory findings and is usually straightforward. However, with atypical manifestations, the clinical diagnosis can be delayed, thus affecting patient morbidity (Ning and Keenan. 2010). The most common clinical presentation of an acute gout attack is the rapid onset of a painful mono-arthropathy often in the first metatarsophalangeal joint (podagra). While urate crystal deposition is commonly encountered in the appendicular skeleton, involvement of the axial skeleton is rare but does occur. In one retrospective review, the authors found that approximately 48% of the axial gout patients had involvement of the lumbar vertebrae, 29% involved the cervical spine, 20% involved the thoracic spine, and 8.7% involved the sacroiliac joints (Konatalapalli et al. 2009). Involvement of the spine has been reported to occur in the posterior elements, sacroiliac joints, paravertebral soft tissues, and the intervertebral disk (Popovich et al. 2006). Involvement of the axial skeleton may occur at multiple levels with both osseous and extra-osseous imaging findings. These findings include osseous erosions or destruction as well as paravertebral soft tissue masses. Axial skeleton gouty arthropathy may have a confusing clinical presentation and can be readily mistaken for an infectious or malignant etiology (Fig. 10.5). Therefore, differential diagnostic considerations prior to biopsy would include infection, lymphoma, myeloma, or metastatic disease (Popovich et al. 2006).

Fig. 10.5
A 67-year-old female with history of breast cancer and low back pain. Focal radionuclide uptake (arrow) is seen within the lumbar spine on the static image from the bone scan (a). Coronal CT reformation in bone window algorithm (b) shows focal asymmetric sclerotic change adjacent to a prominent lateral osteophyte at L3–L4 (arrows); this finding is present at other spinal levels. Fluoroscopic frontal projection (c) shows an insert needle (arrow) within the L3–L4 disk. Fluoroscopic frontal projection (d) shows a biopsy needle within an area of sclerosis at L3–L4 (arrow). The disk and endplate biopsies were submitted for both microbiologic and pathologic analysis; the latter showed the presence of urate crystals. A subsequent radiograph of the foot showed the presence of gout
CT is sometimes used to evaluate back pain. Gouty tophus on CT has been measured to be approximately 160 Hounsfield units secondary to the monosodium urate crystals (Gerster et al. 2002). Facet joint erosions in the lumbar spine in a patient with gout should raise suspicion for axial gouty arthropathy (Saketkoo et al. 2009). With the advent and increasing use of dual-energy CT, and with the inherent capabilities of dual-energy CT, it is now possible to distinguish clusters of urate crystals from other calcifications, i.e., hydroxyapatite crystals. Urate crystals can be uniquely color coded, allowing for improved depiction. As such, dual-energy CT may be used in patients with an unclear diagnosis or in excluding gout (Desai et al. 2011). Since dual-energy CT may directly depict urate crystal deposition, it can be specifically used to evaluate for gout regardless of patients’ serum urate levels; as such, dual-energy CT findings can confirm a diagnosis of gout in patients with normal serum urate levels or even exclude it in patients with hyperuricemia (Desai et al. 2011). While MRI maybe helpful in establishing a diagnosis, the overall imaging findings are nonspecific. One study found that 13 patients with axial gout demonstrated lesions to be hypo- to iso-intense on T1- weighted images and variable on T2-weighted images. The degree of T2 signal intensity was thought to be related to the degree of calcium within the tophi (Yu et al. 1997). This study also found that nearly all gouty tophi demonstrated near-homogeneous enhancement on contrast-enhanced MR examinations. It can be difficult to differentiate axial gouty arthropathy from infectious spondylodiskitis as epidural collections have also been reported with gouty arthropathy (Fig. 10.6) (Yen et al. 2005). FDG-PET has recently been reported to be positive in axial gouty arthropathy demonstrating hypermetabolism within the lytic bone lesions and paraspinal masses. The authors postulate that macrophages and other growth factors play a role in the resolution of urate crystals in an acute gouty attack. High uptake of FDG has been correlated with macrophage/growth factor activity accounting for increased FDG uptake (Popovich et al. 2006).