Fig. 1
Estimated number of cancer survivors in the United States from 1971 to 2004. Based on November 2006 SEER data submission
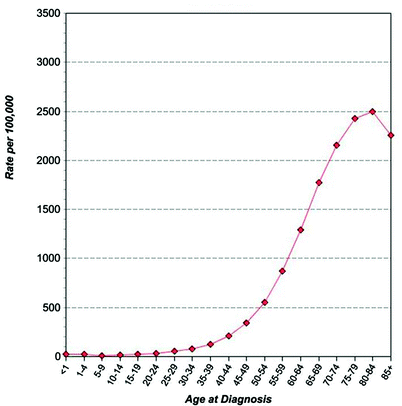
Fig. 2
Age-specific crude SEER cancer incidence rates. For all cancer sites, all ages, all races, both sexes 2000–2005
Demographics, however, do not alone account for the increasing number of cancer survivors. Other factors, including public health successes and medical advances, have also contributed to the rising numbers. As Fig. 3 demonstrates, between 1993 and 2005 the annual age-adjusted cancer death rates have fallen by an average of 1.1 % per year. These statistics reflect incidence rates that have finally plateaued and started to decrease (Fig. 4) due to factors such as lower smoking rates, combined with the growing proportion of patients cured of cancer. Figure 5 shows that in 1975, the 5 year relative survival rate for all cancer patients considered together was about 50 %. By 2000, the 5 year relative survival rate had increased to about 66 %. Effective screening tests which detect cancer at earlier stages are responsible for much of this improvement in survival, but increasingly successful primary and adjuvant treatments also contribute to these increases.
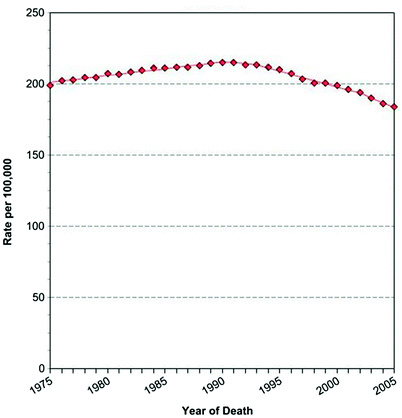
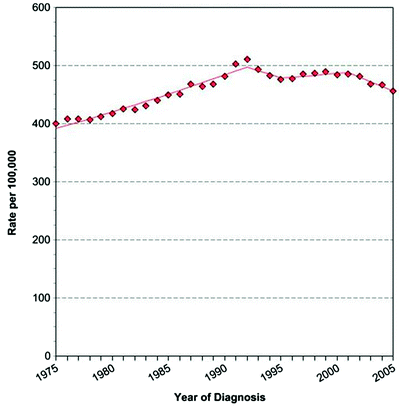
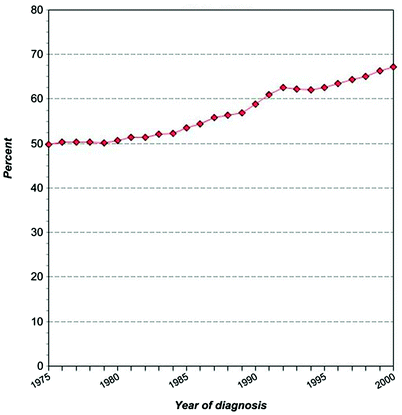

Fig. 3
Age-adjusted U.S. cancer mortality rates. For all cancer sites, all ages, all races, both sexes 1975–2005. Mortality source: U.S. mortality files, National Center for Health Statistics, CDC. Rates are age-adjusted to the 2000 U.S. standard population (19 age groups – Census P25–1130). Regression lines are calculated using the join point regression program version 3.3, April 2008, National Cancer Institute

Fig. 4
Age-adjusted SEER cancer incidence rates. For all cancer sites, all ages, all races, both sexes 1975–2005. Incidence source: SEER 9 areas (San Francisco, Connecticut, Detroit, Hawaii, Iowa, New Mexico, Seattle, Utah, and Atlanta). Rates are age-adjusted to the 2000 U.S. standard population (19 age groups – Census P25–1130). Regression lines are calculated using the join point regression program version 3.3, April 2008, National Cancer Institute

Fig. 5
5 year relative cancer survival rate by year of diagnosis. For all cancer sites, all ages, all races, both sexes 1975–2000. Survival source: SEER 9 areas (San Francisco, Connecticut, Detroit, Hawaii, Iowa, New Mexico, Seattle, Utah, and Atlanta). Survival rates are relative rates expressed as percents. The 5 year estimates are calculated using monthly intervals
The estimated number of cancer survivors by time since initial diagnosis and gender is shown in Fig. 6, with 14 % of all patients having survived for 20 or more years. Breast is the most common primary site (22 %), followed by prostate (19 %), colorectal (10 %), and gynecological malignancies (9 %, Fig. 7); these cancers have relatively high incidence rates and depending on stage, are generally curable. Lung cancer, on the other hand, despite being the most common cancer overall, accounts for only 3 % of survivors because of its generally poor outcomes. Conversely, the proportion of cancer survivors under age 19 is only 1 %, given the rarity of childhood cancers, although these tumors are typically accompanied by high cure rates. The estimated proportion of cancer survivors by current age is shown in Fig. 8, with 60 % of patients over age 65.
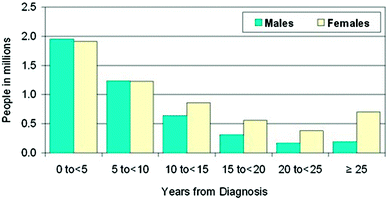
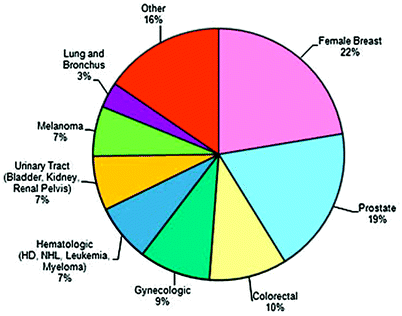
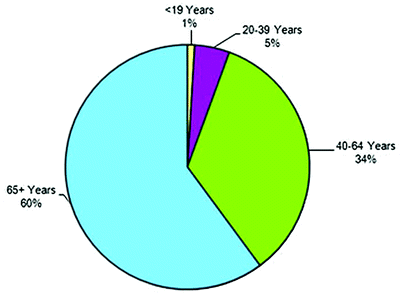

Fig. 6
Estimated number of cancer survivors by time from diagnosis and gender. Estimate for January 1, 2004 based on November 2006 SEER data submission. Invasive/first primary cases only; n = 10.8 million survivors

Fig. 7
Estimated proportion of cancer survivors in the U.S. by site. Based on November 2006 SEER data submission

Fig. 8
Estimated proportion of cancer survivors by current age. Based on November 2006 SEER data submission
3 The Oncology Workforce
As the number of cancer survivors has grown, so has the recognition that the care of the patient requires attention to issues that go well beyond treatment of the cancer itself. The first recommendation in the IOM report was that cancer survivorship should be recognized “as a distinct phase of cancer care.” This viewpoint represented a remarkable shift in thinking. Previously, patients had been viewed as survivors of a specific cancer, sometimes with a narrow spectrum of lasting effects related only to that cancer and/or its treatment. The IOM articulated a view that there are important cross-cutting issues with which all cancer survivors must contend. These include concerns about the following issues: appropriate surveillance for relapse; effects of treatment such as organ damage, mobility, fatigue, fertility, and sexual dysfunction; and the possibility of second cancers either due to shared genetic or environmental exposures that caused the index tumor or that are related to treatment. Other shared issues relate to the following factors: the effect of a cancer history on the ability to obtain health, life, or disability insurance, and related concerns of how insurability might affect employability and finances; and a host of psychosocial effects including fear, altered interpersonal relationships, cosmesis, and cognitive effects (e.g., ‘chemo brain’) stemming from cancer treatment. These domains of concern depend less on the particular type of cancer, and more on therapeutic exposures and individual reactions to them. Moreover, the end of primary treatment for cancer has been called a ‘teachable moment’(Ganz 2005) in recognition that patients may be more receptive to recommendations to change risk behaviors related to diet, exercise, smoking, etc., and messages about general health maintenance (e.g., immunizations, other screenings) around the time of a major health crisis, such as a cancer diagnosis.
This more holistic view of caring for cancer survivors promises to provide them great benefit, but raises questions about how such care can practically be delivered. The demographic trends, which were mentioned previously, predict increasing numbers of cancer patients and survivors who will require ongoing care and monitoring. These statistics prompted the American Society of Clinical Oncology (ASCO) to create in 2005 a Workforce in Oncology Taskforce to study the equilibrium of supply and demand. By gathering information through professional databases and surveys on the demographics and career plans of the current oncology workforce as well as those in training, ASCO was able to project that demand for cancer care is expected to rise 48 % between 2005 and 2020, while the supply of oncologists will grow by only about 14 % (Fig. 9). This is due to a combination of an aging oncology workforce and a limited number of oncology fellowship positions. The Workforce Taskforce concluded that the health care system will likely have major shortages in its capacity to meet future demand for oncology services and that no single action (such as training more oncologists or engaging primary care physicians (PCPs) and physician-extenders in cancer care) will fill the gap between supply and demand. Instead, policymakers will need to employ a multifaceted strategy in meeting this challenge.
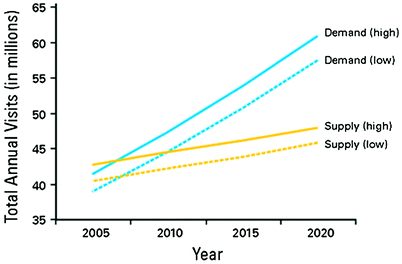

Fig. 9
Baseline projected supply of and demand for oncologist visits, 2005–2020. Reprinted with permission. ©2008 American Society of Clinical Oncology. All rights reserved. Erikson C et al.: J Oncol Practice Vol. 3 (2), 2007:79–86
Stay updated, free articles. Join our Telegram channel

Full access? Get Clinical Tree


