Abstract
The MR signal from spinal cord tissue arises almost entirely from water. T 2 -weighted contrast is determined by tissue water properties and is a valuable tool for qualitative clinical evaluation of the spinal cord. If the full T 2 decay curve is acquired, there is an opportunity to extract quantitative pathological information about the spinal cord. Depending on the physical location of the water molecules, their MR signal will be unique; water in a tightly confined space will have a shorter T 2 relaxation time than water in a less confined space. Different water environments can be identified from the distribution of T 2 relaxation components and parameters such as water content, geometric mean T 2 of intra/extracellular water, and myelin water fraction can be determined. Quantitative assessment of T 2 relaxation has the potential to offer great insight into spinal cord injury.
This chapter provides an overview of T 2 relaxation and its application to both normal and pathological spinal cord. The basic principles of T 2 relaxation are introduced and quantitative methods for accurate T 2 determination are presented, including optimal acquisition and analysis techniques, as well as common challenges. Practical recommendations for implementation are provided. Applications of T 2 relaxation measurement in spinal cord are reviewed and emerging developments are discussed.
Keywords
Demyelination, Myelination, Myelin water, Spinal cord, T 2 measurement techniques, T 2 relaxation
3.5.1
Overview
T 2 -weighted imaging plays a key role in clinical MR imaging of spinal cord. While T 2 weighting is highly sensitive, it is notoriously unspecific as very different pathological conditions can lead to similar increases in water content that result in similar T 2 increases. Therefore, T 2 -weighted imaging should be considered a qualitative clinical tool; however, if the full T 2 decay curve from spinal cord is acquired, there is an opportunity to extract quantitative pathological information about the spinal cord.
This chapter provides an overview of T 2 relaxation and its application to both normal and pathological spinal cord. The aim is to introduce the concept of T 2 relaxation and describe how T 2 can be measured as well as interpreted. We present a summary of significant results obtained from T 2 measurements in the spinal cord and conclude with practical recommendations for the implementation of quantitative T 2 relaxation measurements.
3.5.2
T 2 Relaxation in CNS Tissue
T 2 , the spin–spin relaxation time (or transverse relaxation time), describes the irreversible decay of the MR signal in the transverse plane. Immediately following an excitation pulse (e.g., 90°), the MR signal is maximum because all of the protons are aligned with each other. However, the signal strength decays to zero at a rate (1/ T 2 ∗ ) determined by the magnetic field distribution or the chemical shift distribution of the spins. By following the excitation pulse with a 180° pulse, signal dephasing caused by an inhomogenous magnetic field and/or a chemical shift dispersion can be refocused to produce an echo. The height of this spin echo is determined by irreversible processes; it decreases exponentially with time from the excitation pulse with time constant T 2 .
In this chapter we describe T 2 relaxation in two ways, first presenting an intuitive picture of the T 2 process in tissue and then providing a mechanistic description of T 2 relaxation.
3.5.2.1
Intuitive Description of T 2 Relaxation
The complete MR signal from spinal cord tissue contains contributions from protons in water and from protons in nonaqueous tissue. It has been demonstrated that the signal from water in central nervous system tissue has T 2 relaxation times greater than 10 ms and that the signal from nonaqueous tissue decays to zero in one ms or less. MRI scanners can readily assess signals with T 2 times longer than 10 ms; therefore, it is possible to accurately characterize T 2 relaxation of the water in the spinal cord by measuring the T 2 decay curve.
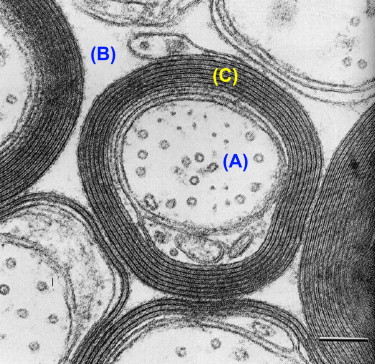
T 2 relaxation in the spinal cord is complicated by the fact that within a typical imaging voxel volume of a few cubic millimeter, structure at a cellular level is inhomogenous. For example, glial cells have single plasma membranes while myelinated neurons contain many membranes in close proximity. This microscopic heterogeneity results in different relaxation behaviors for water protons in different environments within a single voxel. From perusal of high resolution cross-sectional electron micrographs of CNS tissue ( Figure 3.5.1 ), one can visualize three distinct water reservoirs: intracellular water, extracellular water, and water trapped between the bilayers of the myelin sheaths. Because water interactions with nonaqueous tissue are most pronounced in myelin due to the tightly confined space between myelin bilayers, myelin water in spinal cord has a relatively short T 2 time of 10–20 ms. Intra- and extracellular water, which is not in as close association with nonaqueous tissue as myelin water, have a longer T 2 . Although intra- and extracellular spaces are physically different, they have similar T 2 s of around 70–90 ms at 1.5 T and cannot be measured separately. Therefore, T 2 relaxation measurements in spinal cord yield two T 2 components, one at 10–15 ms and one at approximately 80 ms. The fraction of MR signal in the myelin water component is known as the myelin water fraction (MWF). This fraction, as expected, is substantially larger in white matter than gray matter. In previous studies on fixed brain samples, MWF was found to correlate strongly with histological stains for myelin lipids. The MWF in white matter of the spinal cord is approximately twice as large as MWF values in brain, which may reflect physiological variations. The term myelin water imaging has been used to describe quantitative T 2 relaxation studies focused on the myelin water component.
In addition to the presence of multiple water environments, an even further complication in the spinal cord is that boundaries between water environments are blurred due to translational diffusion. Water molecules in pure water or dilute solutions undergo random motion, moving an average distance of R = (6 Dτ ) 1/2 in time τ , where D is the water diffusion coefficient. For a typical MR image obtained with an echo time (TE) = 60 ms, free water in a solution moves over 30 microns. The barriers present in the spinal cord reduce water diffusion coefficients on average to about 1/4 that in free water, and water molecules move on average about 20 microns in 60 ms. Due to diffusion, parameters derived by MR techniques are averaged over their values during the timescale of the measurement. See Chapter 3.1 for more detailed information of diffusion and diffusion anisotropy in the cord.
3.5.2.2
Mechanistic Description of T 2 Relaxation
For a simple spin system consisting of a molecule with a single proton site, T 2 is understood quantitatively in terms of fluctuating magnetic fields produced by adjacent protons undergoing molecular motions. When protons are located on molecules that reorient rapidly due to molecular tumbling and translational diffusion, they produce oscillating magnetic fields. Molecular motions, which are driven by the inherent kinetic energy of the molecules, are characterized by a correlation time, τ c , which is the time required for the molecule to undergo a substantial reorientation. The fluctuating magnetic fields caused by these molecular motions cause T 2 relaxation. The dependence of T 2 on the correlation time of molecular motions and the Larmor frequency is quantitatively expressed in Eqn (3.5.1) . The constant, K , is related to the strength of the interactions between adjacent protons.
1 T 2 = K ( 3 2 τ c + 5 2 τ c 1 + ( ω o τ c ) 2 + τ c 1 + ( 2 ω o τ c ) 2 )
1 / T 1 = K ( τ c / ( 1 + ω o 2 τ c 2 ) + 4 τ c / ( 1 + 4 ω o 2 τ c 2 ) )
). In the presence of slow fluctuations below the Larmor frequency (64 MHz at 1.5 T), T 2 is shorter than T 1 .
The model for relaxation described herein holds for simple spin systems such as water solutions but is unable to quantitatively characterize relaxation in the spinal cord, which contains multiple proton environments. Relaxation times for water in CNS tissue are strongly influenced by interactions between water and nonaqueous protons attached to lipids, proteins, and nucleic acids. In the spinal cord, water protons interact with other protons attached to molecules moving at a wide range of different frequencies (e.g., low frequencies arising from very slow macromolecular reorientations to high frequencies arising from fast small molecule tumbling). As a consequence, T 2 times are shorter than T 1 times.
Related posts:


Stay updated, free articles. Join our Telegram channel

Full access? Get Clinical Tree


