Abstract
The spectrum of temporal bone tumors can be considered to be broad and various, ranging from rather frequent and benign lesions, such as meningioma and vestibulocochlearschwannoma, to rare and malignant lesions, such as sarcomas. These tumors often present a diagnostic challenge to the radiologist on cross-sectional imaging. Imaging is considered to play a crucial role in the diagnosis, treatment planning, and follow-up of these tumors. Radiologists should be aware of the imaging features of these lesions. This chapter provides an overview of the most common tumors of the temporal bone with respect to anatomic location, typical imaging features, and patterns of spread. More rare lesions are also highlighted.
Keywords
Cone-beam computed tomography, Ear, inner, Ear, middle, Magnetic resonance imaging, Skull base, Temporal bone, Tomography, X-ray computed
Introduction
This chapter presents an overview of tumoral lesions of the temporal bone. These lesions can be considered to be rather rare. Imaging plays a crucial role in describing the exact extent of these tumors and can be helpful in specifying some of these lesions.
Classification of temporal bone tumors can be done in various ways. It can be based on the location and origin, age of the patient, histologic findings, and benign or malignant aspect of the lesion. Specific attention should be attributed to the young age group, because several tumoral entities are specific for this age group. Special attention should also be paid to various types of pseudolesions and benign lesions mimicking tumoral pathology. These lesions should definitely not be “touched,” as any treatment might be very harmful to the patient. Recognition of these lesions by the radiologist is of utmost importance.
In this chapter, classification of tumoral lesions is made based on the location of the lesion: external ear, middle ear, or petrous bone/membranous labyrinth. The most common tumoral lesions are discussed. Several rare entities are also highlighted. Petrous bone apex lesions are not discussed because they are the subject of a separate chapter in this book.
Imaging
Introduction
For the evaluation of a suspected tumor of the temporal bone, Computed Tomography (CT) and Magnetic Resonance Imaging (MRI) are used.
CT is used to evaluate the osseous invasion by the tumor. The aspect of bone invasion can provide additional information regarding the type of tumor.
MRI is considered to have a superior contrast resolution. Various pulse sequences can be used. The use of intravenously administrated gadolinium is highly recommended to see the enhancement of the tumor, soft tissues, meninges, and surrounding vascular structures.
The best way to evaluate a tumoral lesion of the temporal bone is MRI—using various pulse sequences—to detect, delineate, and differentiate the tumor in combination with a high-resolution CT (HRCT) in bone algorithm or cone beam CT (CBCT) to see the osseous delineation and eventual osseous lysis and/or sclerosis of the lesion.
High-Resolution CT/Cone Beam CT
Multidetector CT (MDCT) uses a combination of a fan beam X-ray configuration and multiple detector rows to acquire slices and to subsequently reconstruct a volume dataset. From this dataset, multiple reconstructions can be made in different planes with various thicknesses.
CBCT uses a combination of a cone beam X-ray configuration and a flat panel detector to directly acquire a volume dataset from which slices can be reconstructed in different planes and with different fields of view. CBCT delivers high-resolution bone images (usually in slice thickness of 0.1 mm) at a dose that is mostly substantially lower than that of MDCT.
CT is best acquired without intravenously administrated iodinated contrast by means of a high-resolution bone algorithm to see the exact bony delineation of the tumor.
If access to MRI is not available, CT can be performed using intravenously administrated iodinated contrast medium. The dataset should in those cases be acquired in soft tissue as well as high-resolution bone algorithm to allow the evaluation of the soft tissues as well as the bony details of the temporal bone.
Multiplanar reconstructions can give additional information regarding the exact extension of the tumor and the invasion of vascular structures, nerve channels, and the membranous labyrinth.
Magnetic Resonance Imaging
MRI of the temporal bone should be performed using a dedicated multichannel head coil and a high-field-strength MRI system. The authors use a combination of a multichannel head coil with small surface coils placed inside. Depending on the region to be evaluated, the head coil or the small surface coils can be switched on. Both temporal bones should be imaged to compare both sides. The entire skull base should be included. Evaluation of intracranial extension can also be done similarly.
An MRI of the temporal bone should start with an entire brain examination using a T2-weighted fast spin echo (FSE), a turbo spin echo (TSE), or a fluid-attenuated inversion recovery (FLAIR) sequence to exclude associated brain pathologic processes. A heavily T2-weighted sequence, usually a submillimetric three-dimensional (3D) TSE/FSE T2-weighted sequence, is performed to evaluate the fluid content and the signal intensity characteristics in the membranous labyrinth. Thin-slice (2 mm maximum) spin echo T1-weighted sequences are obtained before and after intravenous administration of gadolinium. A complementary axial submillimetric 3D T1-weighted gradient echo sequence is also scanned, to generate the maximum number of slices through the temporal bone. Fat saturation techniques should be applied in one direction after contrast administration.
The acquisition matrix should be at least 512 × 512 with a field of view of 20 cm or less.
Magnetic resonance angiography (MRA) sequences are obligatory in case of a suspected glomus tumor or in the evaluation of a patient with pulsatile tinnitus. A 3D time-of-flight (TOF) MRA sequence before and after gadolinium administration is mandatory to see the small vessels in various vascular malformations and to evaluate the high- and/or low-velocity status of these vessels.
Diffusion-weighted imaging (DWI) sequences, preferably a non-echo planar DWI sequence (non-EP DWI), should definitely be added in case of a suspected tumoral or pseudotumoral lesion of the temporal bone. Using DWI, differentiation between cholesteatomatous (congenital or acquired) lesions or epidermoid cysts can be easily made. In case of lesions with a high cellularity (e.g., lymphoma), DWI can give a clue to the diagnosis by showing a strong diffusion restriction reflected by a very low apparent diffusion coefficient (ADC) value.
Tumor Extension
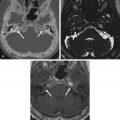
In the temporal bone, specific attention should be paid to tumoral invasion along the facial nerve. Spinocellular and basocellular carcinomas of the external auditory canal (EAC) as well as adenoid cystic carcinomas of the parotid gland have the propensity to spread along the course of the facial nerve ( Fig. 6.1 ). The stylomastoid foramen should always be included in the scanning volume to evaluate its fatty content with the centrally located hypointense facial nerve. Adenoid cystic carcinomas even have the propensity for skip metastases, so careful evaluation of the entire course of the facial nerve is mandatory.

External Ear and External Auditory Canal
Cholesteatoma and Keratosis Obturans
Cholesteatoma and keratosis obturans have been regarded in the past as the same disease process or variations of the same underlying condition. The terms have been used interchangeably in patients presenting with an accumulation of exfoliated keratin within the bony EAC. However, these are two distinct disorders with their own clinical presentations, physical and pathologic findings, and treatment.
Cholesteatomas are most frequently found in the middle ear and mastoid cavity. In rare cases, they originate in the EAC. Typically, this lesion presents in the older age group, is usually unilateral, and is accompanied by a history of chronic ear discharge and otalgia. Several possible causes, such as prior surgery and trauma, have been mentioned. Congenital and acquired cholesteatomas have been reported in cases of congenital stenosis or atresia ( Fig. 6.2 ). Usually external ear canal cholesteatoma requires surgical intervention to remove the cholesteatoma sac and adjacent necrotic bone. Imaging findings are nonspecific, showing a soft tissue mass in the EAC with associated bony erosion on CT. Usually the margins of the bony erosion are sharp and regular. In case of associated periostitis, the margins can become irregular. In these cases, differential diagnosis from a malignant tumor is difficult. It is known that accumulated keratin in a cholesteatoma sac causes clear hyperintensity on a b 1000 DWI MR image ; thus non-EP DWI sequences are mandatory to make the diagnosis.

Keratosis obturans commonly occurs in a younger patient group, often in patients with a history of sinusitis or bronchiectasis. Chronic ear discharge is rare. Symptoms are acute severe otalgia and conductive hearing loss. Contrary to cholesteatoma, keratosis obturans is often bilateral. Keratosis obturans more often causes diffuse widening of the EAC and less bone erosion.
Exostoses and Osteomata
Benign bony tumors of the EAC are exostoses and osteomas. Exostoses are by far more common than osteomas.
Exostoses are broad-based lesions in the medial half of the EAC near the tympanic annulus. There is a clear relationship with a history of repetitive exposure to cold water, as in surfing, swimming, and diving. This entity is hence often referred to as “surfer’s” or “swimmer’s” ear ( Fig. 6.3 ). These lesions are often bilateral and asymptomatic. Occasionally they become large enough to cause obstruction of the EAC with retention of debris. CT demonstrates the broad-based bony lesion nicely and shows the extent of the disease and the eventual retroobstructive pathologic findings in the middle ear. MRI makes little contribution apart from differentiating retroobstructive pathologic findings, such as cholesteatoma and/or inflammation.

Osteomas are much rarer and are situated in the lateral part of the EAC. They occur unilaterally and involve all the layers of normal bone, including bone marrow. Osteomas may also arise in the middle ear and mastoid ( Fig. 6.4 ) and even from the petrous bone pyramid near the porus of the internal auditory canal (IAC). In the middle ear, they can give rise to conductive hearing loss caused by impingement on the ossicles.

Malignant Tumors of the External Ear and External Auditory Canal
Malignant tumors of the external ear or the external auditory canal (EAC) are considered rared. There are a number of malignant neoplasms originating in the EAC or affecting it secondarily. The most frequently encountered primary malignant neoplasms of the external ear are spinocellular carcinomas (SCCs) ( Fig. 6.5 ) and basal cell carcinomas. The most frequently encountered primary malignant tumors of the EAC are SCCs ( Fig. 6.6 ), basal cell carcinoma, adenoid cystic carcinoma, and ceruminous gland carcinoma. Malignant melanoma has been reported to arise on the external ear, secondarily invading the EAC. SCC of the EAC and external ear is usually seen in patients with a prior history of therapy-resistant chronic external and middle ear infection.


It is a tumor of the older generation (50–70 years).
Often, these tumors have a locally very aggressive course, with extensive bone destruction on CT. MRI is superior in demonstrating the exact soft tissue extension.
The most frequently encountered secondary neoplasms are metastatic lesions in the EAC or parotid adenoid cystic carcinoma directly invading the EAC. Breast carcinoma is the most common hematogenous metastatic lesion to occur within the temporal bone.
The prognosis of primary malignant tumors of the EAC depends on the local invasion and the extent of the disease, which can be demonstrated by CT and MRI.
Extension of the tumor depends on its site of origin. Tumors originating in the cartilaginous lateral third of the EAC have little or no barriers to extend.
The extension may be anteriorly to the parotid gland.
Currently, there is no staging system for EAC tumors accepted by the American Joint Committee on Cancer or the International Union Against Cancer. Most frequently, the Pittsburgh staging system is used.
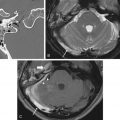
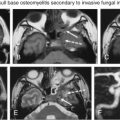
When tumors become large, the exact origin of the lesion may be difficult to determine. When extending into the temporomandibular joint and deep spaces of the neck, differentiation from a necrotizing external otitis on imaging can be difficult ( Fig. 6.7 ). Clinical findings, however, differ completely. Necrotizing external otitis usually occurs in a younger age group than SCCs of the EAC. The extension pattern toward the temporomandibular joint can also be regarded as rather typical for necrotizing external otitis ( Fig. 6.7 ).

In case of skull base osteomyelitis, extension of the pathologic signal intensities on MRI most often spreads toward the skull base rather than to the temporomandibular joint with a low signal on T1-weighted images in the clivus and lateral skull base. Diffusion MRI can in such cases be helpful as ADC values of skull base osteomyelitis are significantly higher than those of tumoral lesions.
Middle Ear and Mastoid
Introduction
The most frequent benign tumor in the middle ear and mastoid is the paraganglioma or glomus tympanicum tumor, followed by facial nerve schwannomas and congenital cholesteatomas. Less frequently adenomatous tumors or adenomas are found. In the entire temporal bone region, the paraganglioma are second in frequency to only vestibulocochlear schwannomas.
Malignant tumoral lesions of the middle ear are rare. The most frequent subtypes are the middle ear adenocarcinoma and squamous cell carcinoma.
Specific attention should be paid to tumoral lesions in children and more specifically to rhabdomyosarcoma, Ewing sarcoma, and Langerhans cell histiocytosis.
Paragangliomas
Paragangliomas arise from the extraadrenal, neural crest-derived paraganglia, the so-called glomus bodies. These glomus bodies lie along the nerves in the inferior temporal bone along the cochlear promontory in the middle ear, giving rise to the glomus tympanicum ( Fig. 6.8 ). They are also situated in the jugular foramen (glomus jugulare), in the common carotid artery bifurcation (glomus caroticum), and along the vagus nerve (glomus vagale). When they involve both the jugular foramen and the middle ear, they are called glomus jugulotympanicum ( Fig. 6.9 ). Most of these jugulotympanic tumors arise in association with the glomus formations of the inferior tympanic branch of the glossopharyngeal nerve (Jacobson nerve) or the mastoid branch of the vagus nerve (Arnold nerve).


Paragangliomas account for 0.6% of all neoplasms in the head and neck region. The majority (80%) are situated in the carotid bodies in the common carotid artery bifurcation and in the jugular foramen.
The peak age of incidence is in the fifth and sixth decades of life, and there is a clear female predisposition (three to one).
Pulsatile tinnitus is the most important and most common clinical symptom. In case of a large bulky tumor in the middle ear, conductive hearing loss can also be found. Sensorineural hearing loss and vertigo can be caused by inner ear involvement. Numerous cranial nerves may be compromised because of the involvement of the jugular foramen (9th, 10th, and 11th cranial nerves) and the hypoglossal canal (12th cranial nerve). Involvement of the seventh cranial nerve is mostly likely caused by the involvement of the mastoid segment of the facial nerve rather than the tympanic, labyrinthine, and IAC segments.
Clinically, the ear, nose and throat (ENT) surgeon will find a blue mass lesion behind the tympanic membrane.
The glomus tympanicum tumor ( Fig. 6.8 ) presents on HRCT/CBCT as a nodular mass lesion situated anteriorly in the hypotympanum against the so-called promontory. The promontory is a bony bulge caused by the cochlea on the medial and anterior hypotympanic wall. The mass lesion can extend into the middle ear cavity, abutting the tympanic membrane. The ossicles are generally spared. If the mass is sufficiently large to fill the epitympanum, attic, and antrum, retention fluid in the mastoid can be found. Bone erosion is usually not present on CT images. Although pulsatile tinnitus is a frequent clinical sign, glomus tympanicum tumors very often cause conductive hearing loss. T1-weighted images show a strongly enhancing mass lesion situated anteriorly in the signal void of the temporal bone pyramid ( Fig. 6.8 ). An appropriate window and level setting makes it possible to situate the lesion against the promotory, even on T1-weighted images. Signal intensities on T2-weighted images may vary but are predominantly intermediate.
In case of a glomus jugulotympanicum tumor, HRCT/CBCT clearly demonstrates the moth-eaten erosive appearance of the jugular foramen with extension of the soft tissue mass to the middle ear ( Fig. 6.9 ). Unenhanced T1-weighted images show the mass lesion in the jugular fossa with its characteristic “salt and pepper” appearance. The “pepper” represents the hypointense dots caused by the signal voids of large feeding arteries, whereas the “salt” is secondary to subacute hemorrhage in the tumor. On an unenhanced 3D TOF MRA sequence, serpiginous high signal intensities can be found in the tumor, representing the high-velocity flow of the large feeding arteries. In the assessment of paragangliomas, the combination of conventional MRI and contrast-enhanced MRA is significantly superior to conventional MR sequences alone. On postgadolinium T1-weighted images, the enhancing mass lesion with its extension to the middle ear can be evaluated ( Fig. 6.9 ).
Care should be taken not to misinterpret normal flow-related signal and enhancement in a large jugular bulb as a meningioma or as a glomus jugulare or jugulotympanicum tumor ( Fig. 6.10 ).

On a clinical basis, it is impossible to make the differentiation between a glomus tympanicum, a glomus jugulotympanicum, and other vascular variants or anomalies, as most of these lesions can present with tinnitus and a retrotympanic bluish or reddish discoloration.
Because a surgical intervention or biopsy can potentially be very harmful in these patients, it is essential that the radiologist is able to recognize these anatomic vascular variants and anomalies.
A mega jugular bulb can, in the case of deficiency of the bony plate, protrude into the middle ear, giving rise to a blue discoloration of the tympanic membrane.
In those cases, tinnitus has been reported as the most frequent symptom. In case of contact with the ossicular chain, this large protruding dehiscent jugular bulb can even cause conductive hearing loss ( Fig. 6.11 ).

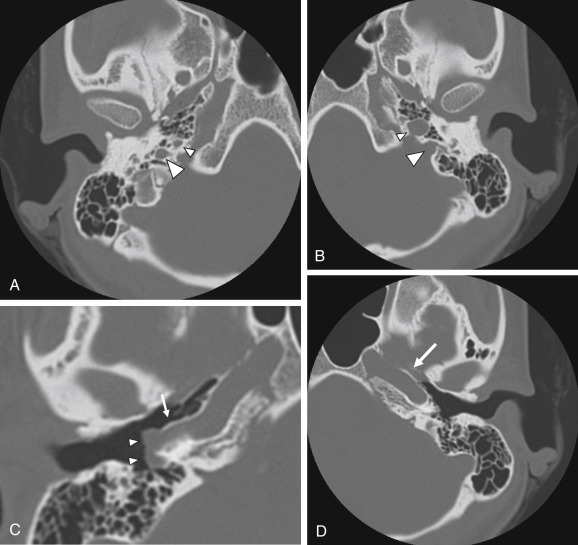
There is also an entity in which an aberrant internal carotid artery can run through the middle ear, presenting as a retrotympanic reddish mass. In this variant, there is an embryologic agenesis of the cervical segment of the internal carotid artery. The embryonic inferior tympanic artery is recruited to bypass the absent carotid segment and runs partially through the middle ear ( Fig. 6.12 ). This hypertrophied vessel may be seen otoscopically and wrongfully considered to be a vascular middle ear tumor.

The persistent stapedial artery is another rare vascular anomaly. Normally, the stapedial artery disappears in the third fetal month; however, it can persist in postnatal life, with the middle meningeal artery arising from it. A persistent stapedial artery originates from the petrous internal carotid artery, enters the hypotympanum in an osseous canal, runs upward between the crurae of the stapes, and then enters the facial canal, running together with the facial nerve ( Fig. 6.13 ) Clinically, it can appear as a reddish retrotympanic pulsatile mass. Its typical course in the middle ear between the crurae of the stapes, together with the absence of the foramen spinosum on imaging, confirms the diagnosis.


Related posts:
Stay updated, free articles. Join our Telegram channel

Full access? Get Clinical Tree


