The Breast Magnetic Resonance Imaging Lexicon was designed to standardize interpretation and reporting of breast magnetic resonance (MR) imaging findings, ultimately improving communication between radiologists and clinicians and facilitating patient care. The lexicon includes 3 lesion types: mass, focus, and non-masslike enhancement. The mass category is analogous to the mass category in the mammography lexicon. Non-masslike enhancement is comparable with calcifications in the mammography lexicon. Unique to the MR lexicon is description of lesion enhancement. In addition, description of background enhancement allows assessment and communication of the sensitivity of the study. The Breast MR Imaging Lexicon is reviewed and images provided to illustrate these descriptor terminologies.
Contrast-enhanced magnetic resonance (CE-MR) imaging of the breast has become an important imaging tool in patients with known or suspected breast cancer. Breast MR images are influenced by a variety of technical factors. The wide range of imaging protocols currently in use throughout the world results in variability in appearances of the imaging findings. The need for standardization of MR breast imaging has been recognized, and consensus has been reached regarding many of the most important technical factors such as minimum field strength, the use of dedicated breast coils, and the need for fat suppression and contrast-enhanced images.
Standardization of breast MR imaging has also included development of the breast MR imaging lexicon. The American College of Radiology developed the Breast Imaging Reporting and Data System (BI-RADS) mammography lexicon in 1996 to standardize and improve mammography interpretation and reporting. BI-RADS provided standard descriptors for mammography findings and improved the communication between radiologists and referring clinicians. Similarly, the lexicon for breast MR imaging was developed to clarify reporting of breast MR imaging findings and to establish definitions of the terminology and the implications of these findings for patient care. The lexicon for breast MR imaging was initially published in 2003, and an updated version will be available in 2010.
Kinetic evaluation
Early efforts in breast MR imaging developed along 2 pathways: 1 focusing on lesion kinetics and making use of high temporal resolution imaging, and 1 focusing on lesion morphology and using high spatial resolution imaging. This divergence was largely the result of the technical limitations of MR imaging at the time. To perform rapid imaging necessary for kinetic evaluation, spatial resolution had to be sacrificed. To achieve high spatial resolution necessary for detailed morphologic evaluation, longer acquisition times were required, precluding kinetic evaluation. More recently, the importance of using both features in lesion evaluation has been recognized, and current MR imaging technology enables the use of imaging protocols adequate for kinetic and morphologic analysis.
Once tumors reach a size of 2 to 3 mm, they must stimulate growth of new vessels to continue to grow. This process is known as tumor angiogenesis. These new tumor-associated vessels tend to be large and leaky. It is therefore expected that malignant lesions with a greater degree of tumor angiogenesis would show rapid and intense tumor enhancement on contrast-enhanced imaging. Benign lesions, on the other hand, would be expected to have slower and less intense enhancement. This principle is the foundation of kinetic analysis in CE-MR imaging and holds true in many cases. In actuality, lesion enhancement on MR imaging is a more complex process, and is affected by many different factors including not only vessel density and vessel permeability but also diffusion rate of contrast material, characteristics of the interstitium, and T1 relaxation time. Observed lesion kinetics are also affected by imaging parameters such as field strength, contrast type, and acquisition time. For adequate kinetic evaluation, dynamic imaging acquisition times should be less than 2 minutes. Invasive malignant lesions tend to reach their peak enhancement within 2 minutes, and longer acquisition times could prevent this peak from being observed.
Kinetics can be quantitatively evaluated in several ways. Parameters such as time to onset of enhancement, rate of enhancement, peak enhancement, and time to peak enhancement have all been studied. Some of these measurements require high temporal resolution imaging protocols, which are not in widespread use. Current practice largely makes use of a semi-quantitative type of analysis in which percent change in signal intensity from the baseline precontrast value is plotted versus time. The resulting kinetic curve is then divided into 2 phases: early and delayed.
The early phase constitutes the first 2 minutes after contrast, when contrast is generally washing into the lesion. The curve during this period demonstrates the rate of uptake of contrast by the lesion, which is described in the lexicon as slow, medium, or rapid. The specific threshold values used for slow, medium, or rapid uptake vary with imaging protocols. Most invasive malignant lesions show rapid, intense uptake of contrast and will have reached their peak enhancement by the end of this phase.
The remainder of the curve is considered the delayed phase. This part of the curve is evaluated in more of a quantitative manner based on the shape of the curve, which can be described in 3 ways according to the lexicon: persistent, plateau, and washout. A persistent curve shows continuously increasing enhancement throughout the dynamic series. A plateau curve then levels off and maintains a relatively constant value throughout the delayed phase. A washout curve reaches a peak at the end of the initial phase, and then enhancement declines throughout the delayed phase.
Early in the development of breast MR imaging, the focus of kinetic analysis was on the uptake rate and degree of enhancement in the early phase. Although malignant tumors did tend to demonstrate more rapid and intense enhancement than benign lesions, a significant overlap in enhancement rates between benign and malignant lesions was observed, resulting in a low specificity. Kuhl and colleagues showed that including evaluation of the shape of the time-signal intensity curve in the delayed phase could increase specificity. In her study, 83% of benign lesions exhibited a persistent curve and 57% of malignant lesions exhibited a washout curve. There was still overlap, with 5% of benign lesions exhibiting a washout curve and 9% of malignant lesions exhibiting a persistent curve. Analysis of curve shape improved specificity from 37% to 83%. In a later study by Schnall and colleagues 45% of lesions with persistent curves were seen in association with cancer, accounting for 26% of cancers evaluated with kinetics. Thus, the presence of persistent kinetics within a lesion does not exclude cancer, and one should not rely on kinetics alone to determine whether or not a lesion is suspicious. Plateau curves may also be suspicious for malignancy with a sensitivity and specificity for malignancy of 42.6% and 75%, respectively.
When evaluating lesion enhancement, care should be taken to place the region of interest on the most rapidly and intensely enhancing portion of the lesion. This problem is obviated at least to some extent with MR imaging computer-aided diagnosis (CAD) systems, which display kinetic features using color-coded overlays. This allows quick visual assessment of curve types throughout the lesion. Assessment should be based on the most suspicious enhancement type demonstrated in the lesion. In a study by Wang and colleagues using CAD, there was a greater difference in kinetic patterns between benign and malignant lesions when the most suspicious curve, rather than the predominant curve type, was analyzed. Kinetic curves are also affected by motion artifact, which can frequently result in artifactual washout curves. This potential pitfall should be kept in mind particularly when evaluating kinetic overlays generated by MR imaging CAD programs.
Background enhancement
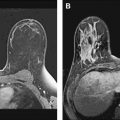
Background breast parenchymal enhancement on CE-MR imaging is analogous to fibroglandular tissue density on mammography. Prominent background enhancement can obscure lesions and thus lower the sensitivity of the study. As such, an assessment of background enhancement should be included in the breast MR imaging report. Background enhancement is described as none/minimal, mild, moderate, or marked ( Fig. 1 ).
The amount of background enhancement does not necessarily correlate with the amount of parenchymal tissue. Mammographically dense breasts may have no or minimal background enhancement, whereas the parenchymal tissues in breasts with scattered fibroglandular densities can have striking enhancement. In addition, there can be significant variations in degree of background enhancement throughout the menstrual cycle. Estrogen causes hyperemia, vasodilatation, and capillary leakiness. This results in increased enhancement of the breast tissue during the first and last weeks of the menstrual cycle, when estrogen is at its peak. Hormonally related parenchymal enhancement can be diffuse, patchy, or focal and nodular, and can sometimes mimic a mass. Benign parenchymal enhancement usually shows persistent or plateau curves, but sometimes washout curves can also be seen. To minimize limitations caused by excessive background enhancement, breast MR imaging should be performed during the second and third weeks of the menstrual cycle when possible.
Background enhancement would also be expected to be increased by other hormonal influences such as hormone replacement therapy and lactation. Tamoxifen therapy would be expected to decrease enhancement. Radiation treatment has been shown to cause parenchyma edema and increased enhancement for at least 3 months following completion of radiation.
Background enhancement
Background breast parenchymal enhancement on CE-MR imaging is analogous to fibroglandular tissue density on mammography. Prominent background enhancement can obscure lesions and thus lower the sensitivity of the study. As such, an assessment of background enhancement should be included in the breast MR imaging report. Background enhancement is described as none/minimal, mild, moderate, or marked ( Fig. 1 ).
The amount of background enhancement does not necessarily correlate with the amount of parenchymal tissue. Mammographically dense breasts may have no or minimal background enhancement, whereas the parenchymal tissues in breasts with scattered fibroglandular densities can have striking enhancement. In addition, there can be significant variations in degree of background enhancement throughout the menstrual cycle. Estrogen causes hyperemia, vasodilatation, and capillary leakiness. This results in increased enhancement of the breast tissue during the first and last weeks of the menstrual cycle, when estrogen is at its peak. Hormonally related parenchymal enhancement can be diffuse, patchy, or focal and nodular, and can sometimes mimic a mass. Benign parenchymal enhancement usually shows persistent or plateau curves, but sometimes washout curves can also be seen. To minimize limitations caused by excessive background enhancement, breast MR imaging should be performed during the second and third weeks of the menstrual cycle when possible.
Background enhancement would also be expected to be increased by other hormonal influences such as hormone replacement therapy and lactation. Tamoxifen therapy would be expected to decrease enhancement. Radiation treatment has been shown to cause parenchyma edema and increased enhancement for at least 3 months following completion of radiation.
Morphologic evaluation
Lesions are assigned to 1 of 3 categories: mass, foci, or non-masslike enhancement.
Masses
The mass category in the MR imaging lexicon is generally the most easily understood, being similar to the mass category in the mammography lexicon. Masses are space-occupying lesions. They have definable shape and definable margins. As such, they may distort or displace the normal breast parenchyma. They may also have different precontrast T1 signal, and therefore may be visible on noncontrast images. Masses always represent pathologic processes, but are not always neoplastic.
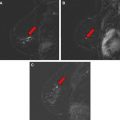
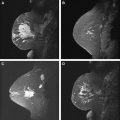
Masses are described by shape and margins. Shape may be round, oval, lobular, or irregular ( Figs. 2–5 ). Lobular masses have gently undulating contours. Any mass that cannot be described as round, oval, or lobular is considered irregular. Mass margins may be described as smooth, speculated, or irregular. The term spiculated refers to fine hairlike projections radiating away from the lesion, and is analogous to spiculated margins on mammography. Any margin that cannot be described as smooth or spiculated is described as irregular. A mass with irregular shape and irregular margins would simply be called an irregular mass. In concordance with the mammography lexicon, round or oval masses with smooth margins are more likely to be benign, whereas irregular masses or masses with spiculated margins are more likely to be malignant.
Related posts:
 Implementing a Breast MR Imaging Program: All Things Considered
 Role of Magnetic Resonance Imaging in Evaluating the Extent of Disease
 MR Imaging of Ductal Carcinoma In Situ
Probably Benign Lesions Detected on Breast MR Imaging
MR Imaging of Ductal Carcinoma In Situ
Probably Benign Lesions Detected on Breast MR Imaging
 A Clinical Oncologic Perspective on Breast Magnetic Resonance Imaging
 MR Intervention: Indications, Technique, Correlation and Histologic
Stay updated, free articles. Join our Telegram channel

Full access? Get Clinical Tree


