Ultrasound assessment of the fetal cardiovascular system is a challenging but very rewarding process. Although the term fetal echocardiography may imply assessment of the fetal heart alone, much information is to be gleamed from a comprehensive look at vascular structures outside of the heart. Hence, in this chapter, the term fetal echocardiography refers to a comprehensive ultrasound assessment of the fetal cardiovascular system. Technical advances and operator skill have improved substantially with an explosion of new knowledge gained in this field. Fetal cardiovascular ultrasonic imaging is currently an excellent means to detect and understand congenital structural defects and complex diseases and observe the course of normal or abnormal human cardiovascular development throughout gestation. As such, it has contributed greatly to the burgeoning field of care and treatment for the human before birth.
How does one wield this powerful tool? In this chapter, we review the current modalities of fetal echocardiography, discuss the conceptual approach to imaging, review the tools used to evaluate functional aspects of the fetal heart and key vascular structures, and discuss the timing of fetal cardiovascular imaging.
What Is Needed, Indications, and Modalities of Fetal Echocardiography
In order to perform fetal echocardiography, a number of technical items, system processes, and knowledge-based skills are required ( Box 3-1 ). Dedicated equipment with an appropriate imaging system and transducers is necessary. Curvilinear transducer probes are optimal in order to provide a wide range of view; however, conventional pediatric imaging probes may be adopted as well. Because the heart is a moving structure, image acquisition must be made over the passage of time. Frame rates of 80 to 100 Hz are frequently needed to view important events occurring at heart rates in excess of 140 bpm. Cardiac structures should be evaluated as they move through the cardiac cycle as well as over multiple cardiac cycles. Still-frame image assessment is appropriate for static structures such as the fetal brain or abdomen, but it is not appropriate when assessing the fetal cardiovascular system. The capacity for cine loop or video review of image change over time is necessary. The capacity for Doppler evaluation of blood flow through pulsed wave techniques as well as color flow imaging is important. Capture and storage of cine loops or video images for analysis and review is essential and can ideally be achieved through digital means, with many good systems currently on the market.
Technical and Programmatic Requirements
- •
Dedicated ultrasound system outfitted for fetal cardiovascular imaging.
- •
Appropriate transducer probes, preferably curvilinear at frequency range 5-8 MHz.
- •
Equipment that allows the capacity to assess cardiac motion over time (still frame assessment is not sufficient).
- •
Capacity for Doppler echocardiography (pulsed wave and color flow imaging).
- •
Record and store system for cine loops or video.
- •
Dedicated sonographer and physician group with specialized knowledge base and skills.
- •
Quality assurance system with regular meetings in place to review imaging and interpretation skills.
Knowledge-based Requirements
- •
Be able to recognize the full spectrum of simple and complex, acquired and congenital, heart disease and its manifestations throughout gestation.
- •
Have the skill and ability to apply all modalities of echocardiography including two-dimensional, M-mode, pulsed wave, continuous wave, and Doppler color flow mapping imaging in recognizing and evaluating both the normal and the abnormal fetal cardiovascular state.
- •
Have knowledge of the anatomy and physiology of the developing cardiovascular system throughout the stages of human development.
- •
Have a thorough understanding of the spectrum of fetal arrhythmias and the ability to utilize the spectrum of echocardiographic modalities for their assessment.
- •
Be knowledgeable in the principles of biological ultrasound instrumentation and its application in human pregnancy.
- •
Have a thorough understanding of maternal-fetal physiology as well as maternal diseases that may affect the developing fetus.
- •
Be familiar with the latest developments in obstetrical diagnostics, which include invasive and noninvasive tests available throughout pregnancy.
- •
Have knowledge of the growing field of invasive fetal intervention and its possible effects on the fetal cardiovascular system.
A number of excellent ultrasound systems are commercially available on the market today. Vendors have responded to input from the medical community, leading to the evolution of a series of systems that provide superb quality imaging. One of the challenges has been optimizing a system for the hybrid needs of the fetal cardiovascular imager. System production has developed into two camps—those dedicated specifically to (1) cardiological assessment primarily targeted toward the adult and child and (2) general body radiological or obstetrical imaging. The needs of the fetal echocardiographer are a combination of these two systems—hardware and software technology that focuses on optimizing obstetrical targets at a distance from the transducer, but yet provides for high frame rates necessary for cardiovascular assessment. Today, these goals can be met by the purchase of an obstetrical ultrasound system outfitted specifically for fetal cardiovascular assessment or a cardiology system outfitted for obstetrical scanning.
Fetal echocardiography is typically performed using ultrasound at frequencies ranging from 4 to 8 MHz. Lower frequencies provide for greater tissue penetration, however, at lower resolution, whereas higher frequencies provide greater resolution but have greater dissipation of energy as the ultrasound beam travels through tissue. Furthermore, lower frequencies provide for optimal Doppler echocardiography and color flow imaging. The 4- to 8-MHz range of frequency used in fetal echocardiography provides for an appropriate balance between ultrasound tissue propagation and image resolution.
In addition to specialized equipment, dedicated operator skills are necessary. Sonographers and physicians who perform fetal echocardiography should be trained specifically to undertake this task. The operator skills necessary are above and beyond those required for pediatric echocardiography or obstetrical imaging alone. Guidelines have been developed by various societies and professional organizations. Fetal echocardiography is of interest to both pediatric cardiologists and maternal-fetal medicine and perinatology specialists and can be performed by highly qualified and skilled professionals from either field. Maintenance of knowledge and specialized skills is required through continuing medical education efforts in order to keep up with rapid developments in the field. The knowledge base to perform fetal echocardiography must include not only information on how to image and diagnose but also a basic understanding of the physiological implications of fetal cardiovascular disease and its impact on the pregnancy. A regular quality assurance system should be in place in order to review image quality and interpretation accuracy. Review sessions are of most benefit if held in a multidisciplinary manner with experts in obstetrical care, maternal-fetal medicine, imaging, and pediatric cardiology in attendance. If counseling is to be performed, additional skills and knowledge are necessary—in particular, knowledge concerning the most recent management strategies, medical or surgical treatments, and outcomes for the disease at hand.
Indications for Fetal Echocardiography
Most forms of fetal congenital heart disease occur in mothers who have no specific identifiable risk factors. Nevertheless, several maternal risk factors as well as fetal risk factors are considered indications for a high-level evaluation of the cardiovascular system through fetal echocardiography ( Table 3-1 ). No doubt, additional risk factors and markers will emerge in the future as work toward understanding the basis for congenital heart disease and its genetic origins continues to progress.
| MATERNAL INDICATIONS | FETAL INDICATIONS |
|---|---|
| Family history of CHD | Abnormal obstetrical ultrasound screen |
| Metabolic disorders (e.g., diabetes, phenylketonuria) | Extracardiac abnormality |
| Exposure to teratogens | Chromosomal or genetic abnormality |
| Exposure to prostaglandin synthetase inhibitors (e.g., ibuprofen, salicylic acid) | Irregular heart rhythm |
| Rubella infection | Hydrops |
| Autoimmune disease (e.g., Sjögren’s syndrome, systemic lupus erythematosus) | Increased first-trimester nuchal translucency |
| Familial inherited disorders (Ellis van Creveld, Marfan’s syndrome, Noonan’s syndrome) | Multiple gestation and suspicion of twin-twin transfusion syndrome |
| In vitro fertilization |
Modalities of Fetal Echocardiography
Ultrasound energy can be transmitted through biological tissue with a wealth of information provided utilizing a variety of different echocardiographic modalities.
Two-dimensional Imaging
Two-dimensional tomographic cuts through structures are displayed in real time. This is the primary modality of fetal echocardiography and allows for identification of fine structures in motion. Myocardial and valvar tissues can be analyzed, dimensions assessed, and their functional aspects evaluated. Through a series of high-resolution two-dimensional sweeps and views, a mental reconstruction of three-dimensional of anatomy takes place.
In general, many factors influence two-dimensional image resolution; however, it is important to recall an essential principle: an ultrasonic beam cannot resolve between two structures in space that are less than the distance of a wavelength of the frequency applied. The relationship between wavelength and frequency is defined as follows: c = f × w, where c = speed of ultrasound in biological tissue, which is 1540 m/sec; f = frequency in cycles/sec (Hz); and w = wavelength. If, for example, one were to apply a frequency of 5 MHz (5,000,000 cycles/sec) in looking at a structure, the wavelength through biological tissue would be 1,540,000 mm/sec divided by 5,000,000 cycles/sec, which is equal to 0.3 mm. Hence, this ultrasound beam would not be able to distinguish structures that are less than 0.3 mm apart from each other, a fundamental limitation based on the ultrasound physics. This is important because operators need to keep in mind the frequency used when very small structures are measured in early gestation, structures that may be only a few millimeters in size.
Two-dimensional resolution is both temporal and spatial. In order to capture events that are occurring over very brief periods of time, rapid sampling and image creation, or fast frame rates, improve temporal resolution. Frame rates are optimized when assessing structures as close as possible to the transducer and when the region of interest is limited in scope. Hence, maneuvering the patient and probe to bring the fetus as close as possible to the transducer is important, as is keeping the sector of imaging limited and focused only on the structures of interest. As the ultrasound beam penetrates tissues, it will best assess structures that are in line with the beam and not lateral to it. Hence, axial resolution, the imaging of structures parallel to the axis of the ultrasound beam, is superior to radial resolution, the imaging of structures that are perpendicular or horizontal to the beam. This principle becomes important when attempting to visualize and measure structures such as the left ventricular outflow tract or the size of a ventricular septal defect. Positioning the structures such that they lie parallel to the beam of ultrasound will improve the accuracy of assessment.
Doppler Echocardiography
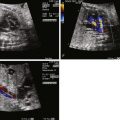
Application of the Doppler principle allows for assessment of velocity and direction of blood flow through the heart and vasculature ( Figure 3-1 ). Transmission of ultrasound at a set known frequency can be directed at a moving target such as blood moving through a vessel. The reflected ultrasound energy will have a different frequency (frequency shift) based on the angle of insonation and the velocity of movement of the blood. Utilizing this relationship, the velocity of blood movement can be identified. Pulsed wave Doppler echocardiography is the process in which packets of ultrasound energy are emitted into a biological field, with transducer piezoelectric crystals alternatively firing and “listening” for a reflective acoustic response. This technique allows for the determination of blood flow direction as well as velocity; however, it is limited in its ability to assess relatively high velocities at a distance from the transducer. Continuous wave Doppler echocardiography is the process in which some piezoelectric crystals are continuously firing sound energy and others are continuously listening. This technique allows for assessment of high velocities at a distance, but one loses the capacity to identify position and location because all velocities within the line of firing will be measured. For purposes of fetal echocardiography, pulsed wave Doppler is most commonly used because velocities are generally low. A region of interest or gate is placed within a cavity or vessel and velocity information is obtained. However, if a high velocity is noted, one may need to switch to continuous wave Doppler to complete the analysis.

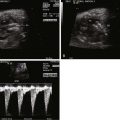
Doppler velocity information is portrayed in a “spectral” manner, with velocity displayed on the y axis and time on the x axis. This provides for a means of assessing the behavior of blood flow within a set region over a cardiac cycle. Normal anticipated patterns of flow have been described for the various structures of the heart and vasculature. Blood flow within a region can be laminar, in which case, blood cells are all moving at the relative same velocity at any one point in time within the cardiac cycle. Laminar flow suggests a normal pattern with no disturbance of blood velocities and is portrayed as a smooth curve on spectral Doppler display. Alternatively, blood flow can be turbulent, in which case, the blood cells within a region of interest are moving at different velocities at any one given point in time. Turbulence occurs when there is a disturbance in blood flow such as in the presence of a valvar stenosis or vascular narrowing. This is portrayed as a filled-in curve on the spectral Doppler display, with varying velocities plotted at any one point in time ( Figure 3-2 ).

Velocity information is of value for a variety of reasons. First, normal velocities of flow through fetal cardiovascular structures are described; hence, velocity measurements noted to be out of the normal range provide insight into a disease state. Second, velocity information can be converted into pressure data. The Bernoulli principle describes the relationship between velocity and pressure differences across a region of interest ( Figure 3-3 ). This principle is of clinical use in many settings. For example, it allows for an estimate of ventricular pressures from the peak velocity of atrioventricular (AV) regurgitant jets. For example, if there is tricuspid regurgitation and the peak velocity of the regurgitant jet is 3 m/sec, by application of the modified Bernoulli equation, the difference between the right ventricular cavity and the right atrium is 4 × 3 2 , or 36 mm Hg. Note that this is not the right ventricular pressure itself, but rather the difference between the ventricle and the atrium. In order to estimate the ventricular pressure, one needs to add an estimate of the right atrial pressure, which in the fetus is approximately 3 to 5 mm Hg. Another example is in the estimation of valvar gradients. A peak velocity of 2.5 m/sec across the aortic valve indicates a 25 mm Hg peak gradient across the valve.

Pulsatile waveforms can be derived from Doppler echocardiography interrogation of vascular structures. Such waveform analysis provides information concerning distal vascular bed impedance or, alternatively, vessel constriction. Arterial waveforms such as those derived from the umbilical artery (UA), renal artery, or ductus arteriosus (DA) typically have both systolic and diastolic components and can be analyzed by a comparison of the relative amounts of diastolic flow to systolic flow. An increased diastolic flow to systolic flow may reflect either (1) a distal low-resistance vascular bed or (2) vessel constriction causing continued persistence of systolic flow into diastole. Examples of increased diastolic flow relative to systolic flow due to low distal impedance include tracings obtained from the UA (due to low placental resistance) or from a vessel leading to an arteriovenous malformation. An example of increased diastolic flow relative to systolic flow due to vessel constriction includes the Doppler signal obtained when sampling a constricted DA. The relative degree of diastolic flow to systolic flow can be characterized and the distal vascular bed impedance can be quantified using a variety of indices ( Figure 3-4 ).
- 1
The peak-systolic–to–end-diastolic velocity ratio (S/D ratio) is a simple ratio of the highest systolic velocity of the waveform to the end-diastolic velocity.
- 2
The resistance index (RI) is the peak systolic velocity (S) minus the end-diastolic velocity (D) divided by the systolic velocity [(S − D)/S]. An RI value = 1.0 reflects the highest resistance possible, with no evidence for diastolic flow.
- 3
The pulsatility index (PI) is the peak systolic velocity (S) minus the end-diastolic velocity (D) divided by the mean velocity (MV) [(S − D)/MV], acquired through a tracing of the waveform. The pulsatility index is one of the more commonly used indices because it is reported to be the least sensitive to variations in angle of Doppler interrogation. Whereas the absolute velocity measures will certainly vary based on angle of interrogation, the ratio of values as calculated through the PI should be the same regardless of the angle.

Color Flow Imaging
Color flow imaging is a form of Doppler echocardiography in which pixels within a region of interest are assigned a color based on the direction and the velocity of blood flow. Shades of red are assigned to blood moving toward the direction of the transducer (maternal abdomen) and shades of blue are assigned to blood moving away from the transducer; the brighter the shade of color, the higher the velocity of blood flow. Laminar, or undisturbed, flow within a region will appear as a single color or a smooth color transition, and turbulent flow will appear as a variety of different colors within a defined region, reflecting the heterogeneity of velocities. Color flow imaging is limited in that it can portray only relatively low velocities with accuracy; high velocities will undergo aliasing in which colors wrap around the spectrum from blue to red or vice versa. When aliasing occurs, pulsed wave or continuous wave Doppler can help identify the peak velocity with greater accuracy.
The Strategy and Approach to Fetal Cardiovascular Imaging
In the child or adult undergoing echocardiography, the position of the subject relative to the imager is known and the approach is sequential, regimented, and standardized. The patient to be examined is lying supine on a table with the chest always facing upward and the spine down. However, in a fetal examination, the position of the subject is variable from patient to patient and, in fact, can change during the course of an individual study. Evaluation of form and function is the goal; however, the order in which structures are assessed will vary from patient to patient. A mental checklist, therefore, is of utmost importance for the operator, so as not to miss important elements of the examination. This is what makes fetal cardiovascular imaging so much fun! Each patient is a challenge, and each is approached in a slightly different manner with the objective of mentally reconstructing the various pieces of imaging data into a comprehensive, logical picture that portrays the cardiovascular state.
The American Society of Echocardiography has established key elements of the fetal heart examination. The order of acquisition of these elements may vary based on fetal position; however, in each study, we strive to obtain a standard set of views and sweeps through tomographic planes that provides for creation of an accurate three-dimensional paradigm of the cardiovascular anatomy. The information from these views/sweeps is incorporated into a cognitive framework referred to as the segmental approach ( Box 3-2 ). Image acquisition itself is not necessarily performed in a segmental manner, but the operator must make certain all of the segments have been inspected and evaluated with confidence before the examination can be considered complete.
Segments to be identified and evaluated:
- •
Systemic veins
- •
Pulmonary veins
- •
Atria
- •
Atrioventricular connections
- •
Ventricles
- •
Outflow tracts
- •
Great vessels
- •
Ductal and aortic arches
- •
Vascular beds (middle cerebral artery and umbilical artery)
Essential components of the fetal examination provide for an assessment of the segments from multiple planes and angles. These essential components are listed in Table 3-2 . Two-dimensional imaging is always performed first. Once a structure is well delineated, color flow imaging may be applied to ascertain a visual sense of the flow characteristics across the structure. Doppler echocardiography is then utilized for interrogation of specific regions of interest and spectral flow patterns are determined, as needed.
| FEATURE | ESSENTIAL COMPONENT |
|---|---|
| Anatomic overview | Fetal number and position in the uterus |
| Establish position of stomach, liver, descending aorta and inferior vena cava | |
| Establish cardiac position and cardiothoracic ratio | |
| Biometric examination | Biparietal diameter |
| Head circumference | |
| Femur length | |
| Cardiac imaging views/sweeps | Four-chamber apical view |
| Apical view angled toward great arteries (five-chamber view) | |
| Long-axis view (left ventricular outflow) | |
| Long-axis view (right ventricular outflow) | |
| Short axis sweep | |
| Caval long axis view | |
| Ductal arch view | |
| Aortic arch view | |
| Doppler examination | Umbilical artery |
| Umbilical vein | |
| Ductus venosus | |
| Inferior vena cava/hepatic veins | |
| Pulmonary veins | |
| Foramen ovale | |
| Atrioventricular valves | |
| Semilunar valves | |
| Ductus arteriosus | |
| Aortic arch | |
| Examination of rhythm and rate | M-mode of atrial and ventricular wall motion |
| Doppler examination of atrial and ventricular flow patterns |
There are a variety of approaches to performance of the fetal echocardiogram. The following is our strategy for the approach ( Figure 3-5 ). These descriptions relate to the anticipated normal position of the cardiac structures, with views and sweeps that will vary based on the findings at hand.


Umbilical Cord, Fetal Biometry, Position of Fetus, Abdominal Situs, Cardiac Position, and Heart Size
Before assessment of the heart, an evaluation of the number of vessels in the umbilical cord should be performed with confirmation of the normal presence of two arteries and a single umbilical vein ( Figure 3-6 ). Doppler assessment of UA and umbilical vein flow patterns are then performed ( Figure 3-7 ). Measures of fetal biometry (e.g., biparietal diameter, head circumference, femur length) are obtained ( Figure 3-8 ) and incorporated into a commercially available algorithm that provides for an estimated fetal weight and gestational age based on weight. This is then compared with the gestational age based on dates of conception in order to determine whether there is appropriate fetal growth. The position of the fetus as either breech, or head down, spine anterior or posterior, should be ascertained such that fetal left and right side relative to maternal left and right can be confirmed. The use of a handheld model such as a doll may be helpful in understanding the position of the fetus. Once fetal left and right are confirmed, the abdominal situs is determined. A transverse view of the abdomen just beneath the level of the diaphragm is obtained. The positions of the stomach (normally on the left), liver (normally on the right), descending aorta (normally to the left of the spine), and inferior vena cava (normally anterior and to the right of the spine) are then identified ( Figure 3-9 ). From the transverse abdominal view, a sweep cephalad is performed. The position of the heart within the chest (normally in the left chest, with apex pointing to the left) is confirmed. The size of the heart in relation to the chest cavity is measured ( Figure 3-10 ). From a quick visual sense of the image, one should normally be able to fit three hearts into the chest cavity in a transverse view. Quantitatively, the cardiothoracic area ratio should be less than 0.4. These elements of the examination are to be determined at the outset of the scan before proceeding any further.


Four-chamber Apical View
In the four-chamber apical view, the longitudinal axis of the heart is displayed with the apex either up or down. The atria, position of the atrial septum (normally bowing right to left), ventricles, and AV valves can be assessed ( Figure 3-11 ). The conotruncus is not seen in the four-chamber apical view. A normal four-chamber view does not rule out the presence of a conotruncal anomaly, an anomaly of the great arteries, or an abnormality of the outflow tracts. From the standard four-chamber view, a sweep posteriorly will demonstrate the coronary sinus and a sweep anteriorly will demonstrate the left ventricular outflow tract and the proximal aorta ( Figure 3-12 ). Posterior and slight superior angulation will provide an image of the entry of the pulmonary veins to the left atrium ( Figure 3-13 ).


Establishment of each ventricle as being either of right or left morphology should be undertaken in this view. The right and left ventricles each have distinctive features, regardless of their spatial position. A ventricle should, therefore, be considered of right morphology even if it is positioned on the left side of the heart or vice versa, as in the anomaly known as corrected transposition of the great arteries (see Chapter 15 ). The morphological right and left ventricles are distinguished from each other by specific features, which are listed in Table 3-3 . The two AV valves, tricuspid and mitral, also have distinctive features. The AV valve’s architecture and anatomy offers clues as to the morphological nature of the ventricle associated. As a rule, the morphological tricuspid valve will drain into a morphological right ventricle, and the morphological mitral valve will drain into a morphological left ventricle.
| PARAMETER | RIGHT VENTRICLE | LEFT VENTRICLE |
|---|---|---|
| Cavity shape and appearance | Triangular. | Bullet shaped. |
| Cavity extension to the cardiac apex | Falls short of the cardiac apex. | Extends to the apex. |
| Ventricular septal surface | Heavily trabeculated with a prominent muscle bundle known as the moderator band. | Smooth-walled, fine trabeculations, no moderator band. |
| Myocardial appearance | Relatively thick and irregularly hypertrophied free wall and septum with variable muscle bundles. | Relatively thin and homogeneous-appearing free wall, no muscle bundles. |
| Atrioventricular valve position | Tricuspid valve annulus plane is slightly offset from center crux of the heart and more apically positioned. | Mitral valve annulus is not offset and is in fibrous continuity with the aortic valve annulus. |
| Atrioventricular valve attachments | Tricuspid valve will have attachments to the ventricular septum. | Mitral valve is free of any attachments to the septum. |
| Atrioventricular valve appearance in cross-section | Tricuspid valve has three leaflets and a single large papillary muscle. | Mitral valve has two leaflets and attaches to two papillary muscles. |
Ventricular Long-axis View and Sweep
Aligning the transducer with the left ventricular outflow tract will provide an image of the long axis of the heart. Assessment of the normal mitral valve–to–aortic valve fibrous continuity can be made as well as an evaluation for any left ventricular outflow tract obstruction. The proximal ascending aorta can also be seen. The ventricular septum is well delineated in this plane and can be inspected for any defects. Sweeping slightly superior allows for visualization of the long axis of the right ventricle outflow with focus on the right ventricular outflow tract and proximal main pulmonary artery with bifurcation into the branch pulmonary arteries ( Figure 3-14 ). This view is helpful in confirming the normal origin of the two great vessels. The larger of the two vessels and one that bifurcates early into branches is the pulmonary artery, which normally arises from the right ventricle; the smaller of the two vessels, which courses for a distance, does not immediately branch and provides the origin for head/upper limb arteries is the aorta, which normally arises from the left ventricle.

Cardiac Short-axis View and Sweep
The short-axis view is obtained at a right angle to the long-axis view of the heart. The landmark for the starting position is the right ventricular outflow tract as it normally wraps around the aorta and left ventricular outflow tract seen arising from the center of the heart ( Figure 3-15 ). The portion of the ventricular septum between the aorta and the pulmonary artery is the conus (infundibulum). Conal deviation such as in tetralogy of Fallot is best appreciated in this view. Conoventricular septal defects are seen in this view adjacent to the tricuspid valve (at 3 o’clock). Slight angulation to the left will allow for visualization of the main pulmonary artery, the branch pulmonary arteries, and the origin of the DA. Sweeping caudad and toward the apex of the heart will demonstrate a short axis of the left and right ventricles, the architecture of the mitral valve, and the ventricular septum ( Figure 3-16 ). In the short-axis view, M-mode sampling through the anterior wall of the right ventricle, right ventricular cavity, ventricular septum, and left ventricular cavity provides important information concerning wall thickness, cavity volumes, and systolic function. Measurements of the ventricular septum can be made and compared against standards for gestational age in order to identify abnormal thickness such as in maternal diabetes or fetal cardiomyopathy. Systolic function of the left ventricle can be measured by calculation of the shortening fraction, which is the end-diastolic diameter minus the systolic diameter divided by the end-diastolic diameter, recorded as a % fraction. Normal left ventricular shortening fraction is greater than 25%.


Stay updated, free articles. Join our Telegram channel

Full access? Get Clinical Tree


