Evaluation of imaging studies of the cerebellum in inherited neurodegenerative disorders is aided by attention to neuroimaging patterns based on anatomic determinants, including biometric analysis, hyperintense signal of structures, including the cerebellar cortex, white matter, dentate nuclei, brainstem tracts, and nuclei, the presence of cysts, brain iron, or calcifications, change over time, the use of diffusion-weighted/diffusion tensor imaging and T2*-weighted sequences, magnetic resonance spectroscopy; and, in rare occurrences, the administration of contrast material.
Key points
- •
Accurate genetic diagnosis of childhood-onset cerebellar ataxia is complicated by both clinical and genetic heterogeneity.
- •
Neuroimaging assessment of the cerebellum should include degree of volume loss, gradient of atrophy, signal intensity, magnetic resonance spectroscopy, and change over time.
- •
Integration of neuroimaging patterns with clinical information is essential to appropriate investigation of childhood-onset cerebellar ataxia.
Introduction
Inherited neurodegenerative disorders resulting from genetic and inborn biochemical defects can affect the cerebellum at any time, either during development and maturation or later in life. The resultant imaging appearance of the posterior fossa structures can reflect growth arrest (prenatal), growth arrest with superimposed atrophy (prenatal and postnatal), or either stable or progressive cerebellar atrophy (postnatal). Imaging features also include swelling or gliosis, calcification, diffusion restriction, enhancement, cysts, or alterations in magnetic resonance (MR) spectra. Additional features (eg, hyperintensity of the dentate nuclei or cerebellar cortex; specific volume loss patterns of the brainstem, vermis, and cerebellar hemispheres; swelling of the cerebellar white matter; change over time; and involvement of the supratentorial compartment) are crucial in narrowing the differential diagnosis. Despite the rapidity with which genetic diagnoses may be made with the decreasing cost and increasing availability of whole-exome sequencing (WES), there are limitations with regard to complete coverage of all coding regions, and difficulties with large genomic rearrangements, trinucleotide repeat sequences, and interpretation of variants. In 2 studies involving pediatric subjects, WES provided genetic diagnoses for 39% and 46% respectively of patients with previously undiagnosed childhood-onset cerebellar ataxia. Diagnosis in the remainder remained occult. In another study of 126 patients referred for progressive cerebellar ataxia, genetic testing was not always positive. Imaging therefore remains an important tool in the diagnosis, staging, and assessment of therapy for neurodegenerative disorders affecting the cerebellum ( Boxes 1 and 2 ).
- •
Image in all 3 orthogonal planes (three-dimensional techniques with multiplanar reconstruction may be used)
- •
Routine T1/T2 with age-appropriate sequence modification; fluid-attenuated inversion recovery (FLAIR)
- •
Diffusion-weighted imaging (DWI) or diffusion tensor imaging (DTI)
- •
Sequence sensitive to calcium, hemosiderin, and brain iron: T2*/Multiplanar Gradient-Recalled/Susceptibility Weighted Imaging
- •
Contrast administration may be helpful if abnormal signal on routine sequences
- •
MR spectroscopy (MRS)
- ○
Supratentorial: deep gray/white matter
- ○
Cerebellum/brainstem
- ○
- •
Degree of volume loss (or gain)
- ○
Vermis, cerebellar hemispheres, interfoliate fissures
- ○
Cerebellar peduncles
- ○
Brainstem
- ▪
Mesencephalon
- ▪
Pons
- ▪
Medulla
- ▪
- ○
Spinal cord
- ○
- •
Gradient of atrophy
- ○
Superior versus inferior vermis predominant
- ○
Vermis versus cerebellar hemisphere predominant
- ○
Cisternal enlargement
- ○
- •
Signal intensity (swelling or gliosis/shrinkage)
- ○
Cerebellar cortex
- ○
Cerebellar nuclei (predominantly dentate)
- ○
Cerebellar white matter
- ▪
Middle cerebellar peduncles
- ▪
Peridentate cerebellar white matter
- ▪
Dentate hilar white matter
- ▪
- ○
Brainstem tracts
- ○
- •
Additional imaging clues
- ○
Diffusion restriction
- ○
Specific supratentorial white matter patterns
- ○
Brain iron (dentate, supratentorial gray matter nuclei)
- ○
Foci of magnetic susceptibility
- ▪
Telangiectasias
- ▪
Hemosiderin
- ▪
Calcifications
- ▪
Brain iron
- ▪
- ○
Other: cysts, enhancement
- ○
Other: chiasmatic enlargement (Krabbe/ GALC ) or atrophy (optic atrophy 1/ OPA1 )
- ○
Other: change over time
- ○
MRS: infratentorial, supratentorial
- ○
Neuroimaging pattern components in the cerebellum
Neuroimaging patterns include combinations of: varying degrees of cerebellar volume loss; gradients of volume loss; signal intensity (swelling or gliosis/shrinkage) of the cerebellar cortex or white matter, dentate nuclei, brainstem tracts, and nuclei; diffusion restriction; enhancement; cysts; brain iron or calcifications; specific supratentorial patterns; and MR spectroscopy (MRS) spectra of the supratentorial compartment, cerebellum, or brainstem. The concept of selective vulnerability, caused by the different affinity of noxious insults to different brain structures at differing developmental stages, remains pertinent when discussing the cerebellum. Thus, the appearance at the time of presentation and any change in pattern with further brain development contribute important clues ( Box 3 ).
- •
Biometry of cerebellum and vermis
- ○
Height: vermis
- ○
Transverse: cerebellum
- ○
Height of superior and middle cerebellar peduncles
- ○
Tegmentovermian angle
- ○
Superior cerebellar peduncle angle
- ○
- •
Biometry of brainstem and cervical spinal cord
- ○
Anteroposterior: mesencephalon, pons, medulla, clava, spinal cord at C2-C3 disc
- ○
Height: pons
- ○
Pontine area on sagittal view
- ○
Biometry
Multiplanar planimetry, assessing regional length, height, and area of the mesencephalon, pons, medulla, and cerebellar peduncles, adds a degree of specificity in baseline and follow-up assessment in patients with inborn errors of metabolism involving the cerebellum. Although measurements of the mesencephalon are slightly less reproducible because of the variability of slice thickness and partial volume averaging with the interpeduncular cistern, measurements performed on a midsagittal view through the pons, medulla, and clava are robust and reproducible. Craniocaudal vermian height measured between culmen and uvula and measurements of the vermian fissures may also be performed on a midline sagittal view ( Fig. 1 ). Additional measurements performed on axial views include maximum peduncular width, pontine width at the level of the trigeminal nerve origins, and width of the medulla through the medullary waist posterior to the olives. Nomograms have been provided for fetal ultrasonography and for MR imaging studies performed throughout life. Volumetric analysis of the cerebellum by automated segmentation allows identification of specific volume loss patterns within lobules of the vermis and cerebellar hemispheres and may be useful in monitoring the course of disease. Loss of craniocaudal vermian height and increase in the apparent size of the cisterna magna commonly occur as cerebellar atrophy progresses in the inherited neurodegenerative disorders of childhood, but are not specific findings. Increase in the tegmentovermian angle between the brainstem and vermis on sagittal view also reflects volume loss with compensatory fourth ventricle enlargement. More specific are findings of volume loss of a portion of the vermis (superior vs inferior gradient of atrophy) or regional brainstem atrophy. Spinal MR imaging is not routinely evaluated in most children undergoing MR imaging for inborn errors of metabolism. However, the upper cervical cord is visualized and may be assessed on images obtained for brain imaging at the C2/C3 disc space level or at a level of the top of the odontoid tip. The measurement at the top of the odontoid tip may be difficult to assess in the youngest patients before fusion of ossification centers of the odontoid peg.
Differentiating inherited and acquired disorders with cerebellar involvement
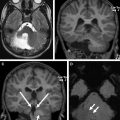
Primary malformative and secondary disruptive disorders may also lead to cerebellar volume deficiencies, but are usually readily identified as such. Many of the hindbrain malformative lesions have specific well-described features. Intrauterine destructive lesions, from TORCH (the acronym for toxoplasmosis gondii, other, rubella, cytomegalovirus, herpes simplex virus-2) infections, pseudo-TORCH disorders, maternal trauma or infection, teratogens, and prenatal or perinatal ischemia may cause developmental arrest or focal volume deficiencies. As cerebellar development and maturation proceeds during the first year of life, developmental arrest and volume loss also occur in survivors of extreme prematurity, most commonly in association with supratentorial complications, such as hemorrhage and periventricular leukomalacia. Specific anterior vermian atrophy in the central region has been shown in cases of profound neonatal hypoxic ischemic insult with thalamic, posterolateral putamina, and Rolandic cortex edema. Postnatal toxin exposures affecting the cerebellum include medically administered medications (anticonvulsant therapy), alcohol, illicit drugs (cocaine, heroin), and environmental exposures (heavy metal, carbon monoxide, manufacturing chemicals, volatile substances, insecticides). These cases are often identified by history or asymmetric findings. Asymmetric cerebellar volume loss only rarely accompanies an inherited disorder for example, with intrauterine or postnatal vasculopathy occurring in COL4A1 mutations ( Fig. 2 ).
Cerebellovermian volume loss: hypoplasia versus atrophy
The cerebellar hemispheres and vermis are usually considered together when discussing volume loss. Volumetric cerebellovermian abnormalities, such as hypoplasia and atrophy, are common in the inherited neurodegenerative disorders. Differentiation between hypoplasia and atrophy can be difficult, as shown by the confusion in the literature. However, there are imaging criteria that can be applied in order to reduce some of the confusion. Cerebellar hypoplasia refers to a cerebellum/vermis with a normal or near-normal shape with normal interfoliate fissures and sulci, but reduced volume ( Fig. 3 ). Causes of cerebellar hypoplasia include aneuploidy, genetic syndromes, and teratogen exposure. There are many genetic syndromes associated with cerebellovermian hypoplasia. Classic examples include CHARGE syndrome ( CHD7 mutation) and Down syndrome/trisomy 21. CHARGE is the acronym for the constellation of coloboma, heart defect, atresia choanae, retarded growth and development, genital and ear abnormalities. Murine models show that deregulated fibroblast growth factor (FGF) signaling, caused by the effect of Chd7 gene dosage on Fgf8 expression, leads to cerebellar hypoplasia in CHARGE ( CHD7 ). Similarly, gene dosage effects from triplicated genes in TsICJe murine models of Down syndrome show a decrease in granule cell proliferation in the newborn cerebellum. In cerebellar atrophy, the vermis acquires a skeleton or branchlike configuration with small folia and large interfoliate fissures and sulci. Change or lack of change may be a helpful feature. A useful clue is imaging documenting a previously normal-sized vermis and cerebellum and progressive loss of volume over time. However, early imaging in asymptomatic infants is rarely obtained. In addition, stability of early-onset cerebellovermian atrophy and gliosis has been noted in some disorders, whereas intrauterine growth arrest and postnatal progression of atrophy occurs in the pontocerebellar hypoplasias (PCHs).
The PCHs are disorders with overlapping features of prenatal growth arrest and subsequent degeneration/atrophy. Head circumference is normal at birth in some patients, but progressive microcephaly develops even when the head circumference is already small. Severe thinning of the brainstem and middle cerebellar peduncles (MCP) occurs both in utero and postnatally. There is specific loss of the basis pons. Severe volume loss of the cerebellar hemispheres leads to enlargement of the fourth ventricle and cisterna magna, which in association with a less shrunken vermis give rise to the dragonfly pattern on coronal images. Eventual supratentorial atrophy occurs with flattening of the caudate nuclei heads ( Fig. 4 ). Initially, 2 subtypes were identified, PCH1 and PCH2, classified by the presence or absence of anterior horn cell degeneration. Subsequently, many more causative gene mutations have been identified and PCH subtypes include PCH1 to PCH10. There is mutation-specific variability in the clinical phenotype. Mutations in genes encoding the transfer RNA (tRNA)–splicing endonuclease complex (TSEN) are found in infants with PCH2A and PCH4 and a single family described as having PCH5. These subtypes are now thought to be on a spectrum with phenotype reflecting the severity of TSEN54 mutation. Patients with homozygous TSEN54 missense mutations typically present with the milder PCH2A phenotype and although they do experience failure to thrive, epilepsy, dystonic attacks, and a reduced lifespan, some make developmental progress. Infants with a common mutation plus either a nonsense mutation or splice site mutation in TSEN54 present with the severe PCH4 phenotype, formerly called olivopontocerebellar hypoplasia. Compound TSEN54 heterozygosity was also found in the family formerly classified as PCH5. Newborns with PCH4 and PCH5 are usually ventilator dependent from birth. Stunted folial outgrowth with variable loss of Purkinje cells and internal granule cells, cystic cerebellar degeneration, fragmentation of the dentate nuclei, progressive loss of the ventral pontine nuclei and transverse fibers, and segmental loss of neurons of the olives and poor myelin have been shown on autopsy in PCH2. More severe findings in PCH4 include regions of afolial cerebellar hemispheres and folial ghosts carrying remnants of preexistent developed cortex. The folial ghosts and persistent fetal pattern of horseshoe-shaped inferior olivary nuclei reflect arrest of development and the onset of degeneration during fetal life.
Cerebellar atrophy, general
Atrophy is the most common cerebellar imaging feature found in the inborn errors of metabolism, although it is usually combined with other imaging determinants that help to narrow the differential diagnosis. Mitochondrial disorders, particularly in patients with respiratory chain defects, are the most common of inborn errors of metabolism presenting with cerebellar atrophy. In one large study of 113 children with mitochondrial disease, 26% showed cerebellar volume loss as the predominant imaging pattern. Mutations in ADCK3 , one of the many genes required for synthesis of coenzyme Q10, are also associated with the cerebellar ataxic phenotype of coenzyme Q10 deficiency.
Macroscopic patterns of cerebellovermian volume loss are important clues in the evaluation of disorders without a clear diagnosis ( Fig. 5 ). Vermian involvement is best evaluated on the sagittal midline view, whereas assessment of the hemispheres and peduncles requires axial and coronal sequences. Predominant corticocerebellar atrophy (CCA) with Purkinje cell loss, spinal cord predominant atrophy with involvement of the Clarke column in the spinal gray matter, and olivopontocerebellar atrophy (OPCA) with loss of ventral pontine nuclei are 3 general patterns based on MR imaging. Progression from the more limited forms to diffuse OPCA may occur over time.
Isolated cerebellar atrophy
Isolated or pure cerebellar atrophy is a common early, but nonspecific, feature in inborn errors of metabolism. In one study, the most subjects in the category of isolated cerebellar atrophy had no known diagnosis. However, most cases have or develop additional useful imaging features. Persistence of the isolated state is rare, because pure cerebellar atrophy frequently reflects an early stage, before the development of additional disease-specific determinants. The prototype disorder with isolated and persistent or pure cerebellar atrophy diagnosis is late-onset GM2-gangliosidosis. GM2-gangliosidosis is a lysosomal storage disorder caused by deficiency of beta-hexosaminidase A, combined beta-hexosaminidases A and B, or the much rarer deficiency of the GM2 activator protein. Patients with a late-onset phenotype may present with cerebellar ataxia, dystonia, psychiatric disturbances, or anterior motor neuron disease. Even in late-onset GM2-gangliosidosis, there are 2 neuroradiological subtypes. The most common shows the classic findings of moderately severe, but isolated, cerebellovermian atrophy ( Fig. 6 ). Imaging in the less common group also has marked supratentorial atrophy and white matter signal increase. Neuropathologic studies show neuronal GM2 storage throughout the neuroaxis and also show marked loss of granule and Purkinje cells in the cerebellum. The extent of loss is reflected by the decreased N -acetylaspartic acid (NAA) level shown on spectroscopy obtained both in the basal ganglia and in the cerebellar hemispheres in both subtypes. In addition, both supratentorial and infratentorial deep nuclear structures lose volume and undergo subtle increased secondary axonal degeneration even in the predominantly infratentorial phenotype, resulting in subtle white matter signal of the centrum semiovale and pontine tracts on studies obtained late in the course of disease. Similar to late-onset GM2 disorders, cases of neuronal ceroid-lipofuscinosis (NCL) presenting after the neonatal period show hypersignal of the cerebellar cortex late in the disease course. Distinctive imaging features in NCL are low-signal (dark) thalami in T2-weighted (T2W) or fluid-attenuated inversion recovery (FLAIR) sequences, mild diffuse secondary demyelination of the peritrigonal optic radiations and posterior limb of internal capsule, and rare corticospinal necrosis ( Fig. 7 ).
Gradients of volume loss add further specificity
Additional inherited neurodegenerative disorders reported to present with isolated cerebellar volume loss or atrophy include ataxia-oculomotor apraxia types 1 and 2 and certain of the autosomal dominant and recessive spinocerebellar ataxias ( CACNA1A , TPP1 , ANO10 , GRM1 , ITPR1 mutations). Helpful refining features related to biometry include: gradient of vermian volume loss; anterior versus posterior, discordant involvement of the cerebellar hemispheres and vermis; and involvement of the brainstem and superior, middle, or inferior cerebellar peduncles. For example, cerebellar atrophy in Marinesco-Sjögren syndrome (MSS/ SIL1 mutation) is more pronounced in the vermis than in the hemispheres, whereas patients with SCA15 caused by ITPR1 mutations show significant vermian atrophy, sparing of the brainstem, and relative cerebellar hemispheric sparing.
The anterior vermian fissures are normally slightly more prominent than the posterior vermian fissures below primary fissure, a finding that increases with aging in adults. The anterior-predominant gradient of volume loss is also common in inherited neurodegenerative disorders involving the vermis. Inferior vermian–predominant or posterior vermian–predominant atrophy is less common than anterior-predominant vermian atrophy. Inferior vermian–predominant volume loss and high signal of the inferomedial cerebellar cortex may be seen in Christianson syndrome ( SLC9A6 ), although involvement of hemispheres and vermis is often more extensive. In addition to cerebellar hemisphere atrophy, posterior vermian volume loss has been described in patients with autosomal recessive cerebellar ataxia related to mutations in GRM1 , which encodes metabotropic glutamate receptor 1 (mGluR1). Congenital disorder of glycosylation, type 1a (CDG1a/ PMM2 ) is only one of the disorders with more pronounced anterior vermian than posterior vermian volume loss. Pronounced anterior vermian atrophy in association with axonal swellings in the posterior lobes suggests progressive degeneration in patients with CDG1a at 1 month of age. Others include Friedreich Ataxia (FRDA; FRDA/ FXN mutation), ataxia telangiectasia (AT/ ATM ), and autosomal recessive spastic ataxia of Charlevoix-Saguenay (ARSACS/ SACS mutation). This anterior gradient may be mild or may be significant, as in ARSACS.
Autosomal recessive spastic ataxia of Charlevoix-Saguenay; a disorder with significant anterior vermian atrophy
Findings in ARSACS, a disorder with ataxia and neuropathy now seen worldwide, include early atrophy of the anterior cerebellar vermis and superior cerebellar peduncles. There is subsequent atrophy of the cerebellar hemispheres and the medulla. The pons and MCP are bulky. The lateral pons and the MCP are also subtly increased in signal intensity. Hypointense linear striations, pontine tigroid hypointensities, are shown on T2 and FLAIR in the base and tegmentum of the pons. Diffusion tensor tractography shows interruption of thin pyramidal tracts by these hyperplastic pontocerebellar fibers at the level of the pons. A rim of T2 hyperintensity around the thalami is a usual feature. The cervical spinal cord atrophies late and spinal radiographs show a straight spine. Thickening of the retinal nerve fiber layer is variable, most commonly seen in Quebecois patients and less commonly in cohorts from Europe or the Middle East, can be seen with retinal examination, but is not identifiable on routine imaging ( Fig. 8 ).
Abnormalities of cerebellar peduncle and brainstem volume
MR planimetry of the brainstem and inspection of the cerebellar peduncles are useful in both early-onset and late-onset disorders. The dentate hilum outflow tract, the dentatorubrothalamic tract, traverses the superior cerebellar peduncles to decussate in the midbrain and extends to the red nucleus and thalamus. The inferior cerebellar peduncles are largely composed of the olivocerebellar and spinocerebellar tract fibers, whereas the MCP comprise the pontocerebellar tract arising from the pontine nuclei and extending topographically to the cerebellar cortex. Pontine and MCP enlargement and marked superior cerebellar atrophy are seen in ARSACS (see Fig. 8 ), whereas loss of volume of the MCP and pons is present in PCH2 and PCH4 ( Fig. 9 ). MCP and pontine volume loss are also seen in cerebellar ataxia type multiple system atrophy (MSA-C), where loss of the transverse pontine fibers and atrophy of the inferior cerebellar peduncles occur. The quarter-note sign, in which an increase in the superior cerebellar peduncle angle obtained at the vertex of the superior cerebellar peduncles on the coronal view reflects degeneration and atrophy of the MCP, is a finding seen with degeneration and atrophy of the basilar portion of the pons. Sparing of the superior cerebellar peduncles in MSA-C helps to differentiate it on imaging from SCA6 ( CACNA1A ), SCA8 ( ATNX8 ), CCA, progressive supranuclear palsy (PSP; PSP1/ MAPT ) and striatonigral or parkinsonian type MSA (MSA-P). Atrophy of the superior cerebellar peduncles and midbrain is notable in PSP1, whereas atrophy of the MCP and pons is more suggestive of MSA-P.
Focal abnormalities of brainstem biometry
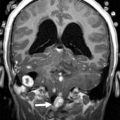
Diffuse brainstem atrophy, which when associated with cerebellar atrophy is part of the OPCA pattern, is often the end stage of several neurodegenerative disorders, including PCH and CDG1a ( PMM2 ). Timely imaging is helpful in identifying specific focal abnormalities. Although midbrain atrophy is common with diffuse brainstem atrophy, severe midbrain atrophy sparing the remainder of the brainstem occurs in early-onset Krabbe ( GALC ). Enlargement of the clava may be the first imaging feature in infantile neuroaxonal dystrophy (INAD; INAD/ PLA2G6 ), even before vermian atrophy, whereas a slender medulla and mild posterior vermian atrophy can be seen in spastic paraplegia 35 ( FA2H ), a disorder with mild cerebellar atrophy, T2 hyperintensity of the internal capsules, periatrial white matter and cerebellum, and globus pallidus brain iron ( Fig. 10 ). The pons is enlarged in ARSACS ( SACS ), whereas pontine volume loss is seen in Wolfram syndrome types 1 and 2 ( WFS1 / CISD2 ), a neurodegenerative disease characterized with diabetes insipidus, diabetes mellitus (in type 1, not type 2), optic atrophy, and deafness (DIDMOAD), whereas flattening of the pons is seen in patients with congenital disorders of glycosylation CDG1a ( PMM2 ) (see Fig. 8 ; Fig. 11 ).
Congenital disorder of glycosylation CDG1a ( PMM2 ): the prototype for disorders with pontine (and cerebellar) atrophy
Cerebellar and brainstem involvement are the most recognized features of PMM2-CDG (CDG1a), the first described and the most frequent of the N -glycosylation disorders. Classic PMM2-CDG findings have shown progressive cerebellar volume loss and hyperintense cerebellar cortex. Rather than true hypoplasia, early neonatal imaging shows normal biometry of the brainstem and cerebellum before the rapid onset of atrophy. Fetal MR imaging in 1 patient showed a normal cerebellum during the second trimester and normal MR imaging at 6 weeks of age with the development of subsequent cerebellovermian atrophy. Onset of cerebellar and brainstem atrophy have been noted as early as 11 days of life and as late as 9 months of age, but are usual after 3 months of age. Anterior vermian volume loss, reduction of pontine protuberance, enlarged cerebellar interfoliate fissures and fourth ventricle, and abnormal signal of the olives and cerebellar cortex progress on serial imaging ( Fig. 12 ). Although pontine flattening is the first notable brainstem feature, there may be eventual atrophy of the entire brainstem. Histopathology shows severe neuronal loss in the pontine nuclei and inferior olives. In keeping with the concept of progressive atrophy, rather than hypoplasia, a fairly intact pons has been shown in an autopsy of a 1-month-old infant with CDG1a ( PMM2-CDG ).
Atrophy of the spinal cord, general
Atrophy of the spinal cord and medulla has also been documented as a minor finding on imaging in several disorders. The presence or absence of it in spinocerebellar ataxia may help in differentiating subtypes. For example, the upper cervical spinal cord and medulla show volume loss in SCA3/Machado-Joseph disease ( ATXN3 ), a disorder in which anterior horn cells, spinocerebellar tracts, Clarke columns, and dorsal columns are known to be involved, whereas SCA6 ( CACNA1A ), has a cerebellovermian predominance and a relative lack of spinal cord involvement on imaging. Spinal atrophy on imaging has been reported with increasing age and markedly reduced body weight and severe growth factor deficiency in AT/ ATM , reflecting anterior horn cell atrophy and demyelination of the spinal cord gracile fascicule.
Friedreich Ataxia is the prototype for neurodegenerative disorders with predominant spinal cord atrophy
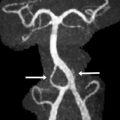
Assessment of the upper cervical cord is predominantly useful in the evaluation of patients with Friedreich ataxia (FRDA/ FXN ), in whom cord thinning caused by neuronal loss in the spinal ganglia and Clarke column may be the first imaging clue to the disorder. Increased intramedullary signal reflects gliosis of the fasciculus gracilis and cuneatus (posterior columns) and of the pyramidal tracts (lateral columns). Scoliosis is common. Although thinning of the cervical cord and medulla, and atrophy of the culmen and declive, may be noted visually on assessment of the midline sagittal view, involvement of the cerebellum was initially considered a rare feature in FRDA. However, volumetric analysis of the cerebellum in FRDA confirms volume loss in the rostral vermis, dorsal medulla, the dentate nuclei, the peridentate white matter, and the associated superior cerebellar peduncle ( Fig. 13 ). Increased iron level has been reported, but is neither universal nor reproducible on imaging in the dentate nucleus of patients with FRDA/ FXN . Cerebellar white matter gliosis and loss of dentate nuclei neurons and of the myelinated fibers in the dentate hila are confirmed on pathologic specimens. Mild loss of Purkinje cells of the cerebellar cortex is reflected in the mild volume loss of the inferomedial cerebellar lobules. Cerebrovascular thrombosis associated with dilated cardiomyopathy in the inherited neuromuscular diseases is considered rare, but does occur. Cardiomyopathy, when present in FRDA, usually consists of a hypertrophic cardiomyopathy, but may progress to a dilated cardiomyopathy ( Fig. 14 ). Stroke is reported as a cause of death in 20% of patients with FRDA with dilated cardiomyopathy, caused by atrial fibrillation or mural thrombus.