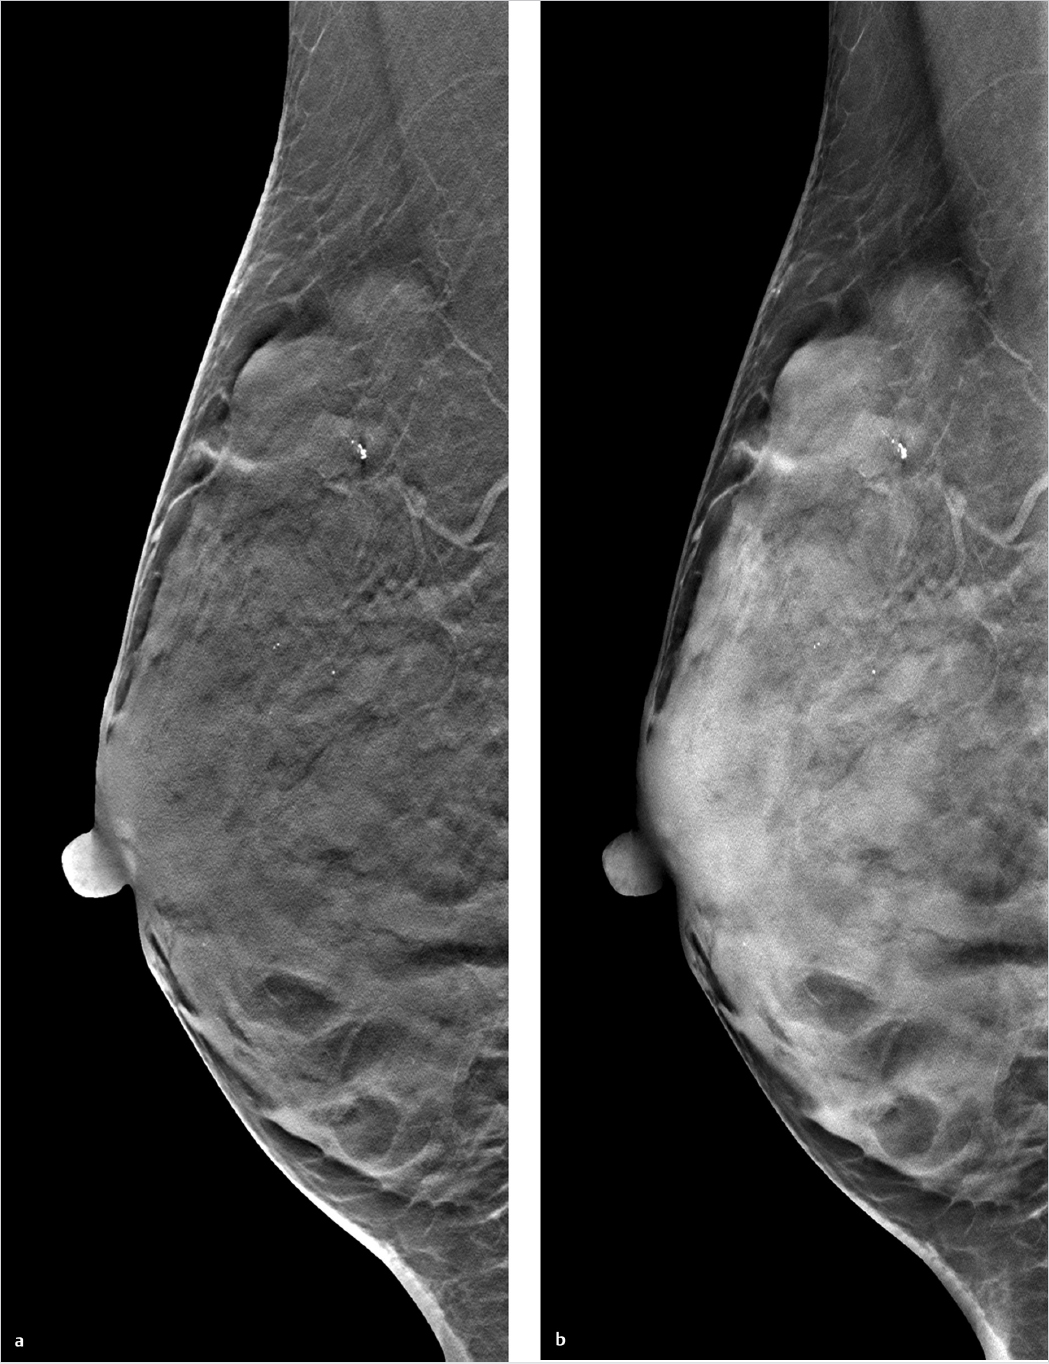
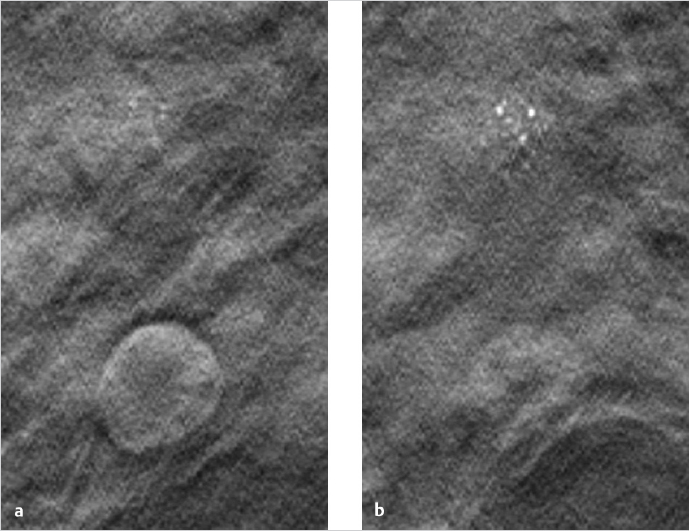
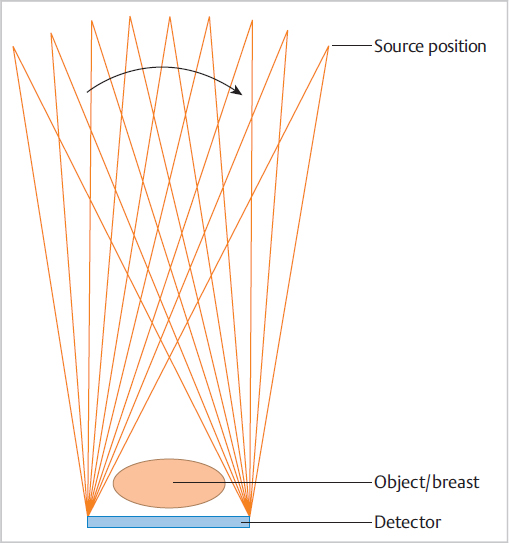
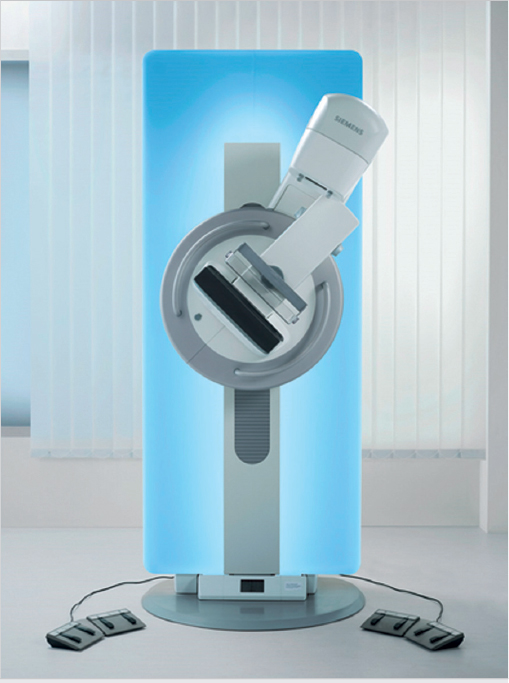
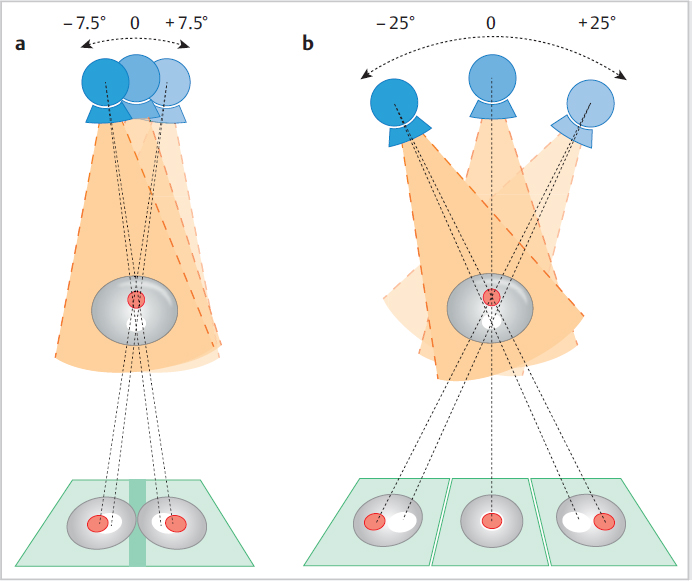
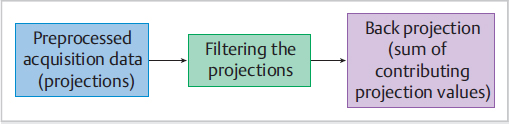
Chapter 2 A few years after the discovery of X-rays by Wilhelm C. Röntgen, researchers began to consider how this radiation might be used not only to create projection radiographs but also to supply three-dimensional (3D) information on the object of interest. Many years passed, however, before this idea became a technical reality. In the first 3D technique, the X-ray source was moved relative to the object, to generate a summation image on the receptor (film) of the X-rays attenuated by the object. In this technique, known as tomography or conventional tomography (Greek tomos = “slice” or “section”), the radiation source moves around a pivot point (fulcrum) in the focal plane. This motion keeps the plane of interest in sharp focus, while blurring out tissues above and below that level. Ziedses des Plantes made the first practical use of linear-motion tomography for imaging the skull.1 The source and detector moved around the fulcrum in a linear fashion. As a result, Ziedses des Plantes is often recognized as the founder of tomography, even though there were many other variants of the technique.2,3 A major disadvantage of conventional tomography was the high radiation dose required, since only one plane was in focus, as determined by the acquisition geometry. Each additional image slice required a different acquisition geometry to define the new plane of interest. This situation did not change until the advent of digital image receptors (flat-panel detectors), which permitted a rapid and distortion-free data readout. The desired image slice could then be reconstructed retrospectively by computer, from the individual stored projection images. This technology provides an obvious reduction in dose, since any desired image plane can be imaged sharply with just one movement of the acquisition system. This technique, in which the X-ray source occupies various imaging positions relative to the object, is called digital tomosynthesis or simply tomosynthesis. Sectional images are reconstructed from a set of individual projection images that are acquired at different angles. This allows the user to “look around” structures within the object to obtain 3D information in the form of individual image slices. The main advantage of tomosynthesis is its ability to select discrete tissue planes. This principle is illustrated in Fig. 2.1, which shows images reconstructed from a breast data set. The image plane in Fig. 2.1a is located 23 mm above the breast support plate (z = 23 mm). It clearly demonstrates a round lesion with smooth margins. The clustered microcalcifications above the lesion are only faintly visible. They are clearly depicted in Fig. 2.1b, however, where the image plane is 27 mm above the support plate (z = 27 mm), whereas the round lesion itself is poorly visualized. This ability to select individual tissue planes could increase both the detection rate and the level of diagnostic confidence. Niklason et al described one of the first applications for breast imaging as early as 1997.4 Fig. 2.1 Magnified views (18 × 29 mm) of two tomosynthesis slices in the breast. (Raw data were provided courtesy of Dr. Ingvar Andersson, Malmö University Hospital, Sweden, and Siemens AG Healthcare Sector.) (a) Image slice at level z = 23 mm. The round lesion is in focus. (b) Image slice at level z = 27 mm. The clustered microcalcifications are in focus. Modified X-ray systems are most commonly used for tomosynthesis. Breast tomosynthesis may employ digital mammographic systems in which the X-ray source can be moved, occupying various positions relative to the imaged object (breast). Tomosynthesis systems can operate in one of two modes. In the sweep mode, the X-ray tube moves continuously and is pulsed at the frame rate of the detector. In the “step-and-shoot” mode, the tube moves to the next position betweeen two aquisitions and transmits the Xray pulse while the tube is stationary. The tube may move in an arc around a point within the object, or at least close to the object, or it may move along a linear path. During scan acquisition, the detector may be stationary (Fig. 2.2) or may move simultaneously with the tube. In the case of a moving detector, the system may have an isocentric C-arm geometry, in which the detector and source both rotate around a common point, or it may have a partial isocentric geometry. In this type of system, the tube and detector move in a synchronous way, but the detector is not rigidly connected to the tube. For example, it may move on a linear path in the receptor plane.5 In most imaging systems, the breast is positioned close to the detector, so there is little or no synchronous movement of the detector (Fig. 2.2). Because each individual projection contributes to forming an image point within the scanned volume (volume element, voxel) during image reconstruction, a tomosynthesis data set can be acquired at approximately the same dose as a two-dimensional (2D) projection radiograph (see Chapter 2.5). The total exposure is distributed over the individual projections, however, so the detector must be able to supply a low-noise signal even at low dose levels. This means that the detector must have high detective quantum efficiency (DQE), even at a very low dose (see Chapter 2.5). Moreover, the detector must have a fast readout and high frame rate, to minimize the scan time and shorten the necessary breast-compression time.6 Both detector requirements pose a significant challenge, given the spatial and contrast resolution required for breast imaging. The scan time can be shortened by “binning” the pixels during detector readout. The associated loss of resolution and possible increase in the signal-to-noise ratio depend on the technical details of the system in use. Fig. 2.2 Tomosynthesis acquisition geometry with a stationary detector and nine source positions or projections. Breast tomosynthesis systems currently on the market (see example in Fig. 2.3) employ direct-conversion detectors based on amorphous selenium with thin-film transistor (TFT) arrays made of amorphous silicon (a-Si-TFT). There is also a system with a scintillator and photodiodes made of amorphous silicon with a-Si-TFT readout arrays, as well as a prototype scanner equipped with silicon direct-conversion line detectors. The X-ray spectrum used for tomosynthesis is either the same as, or similar to, that used in digital mammography, and the tube voltage depends on the thickness of the compressed breast. The X-ray energy, or tube voltage, may be increased slightly to keep the dose as low as possible. Another option is to use more filtering, which increases the mean quantum energy. Tungsten/rhodium (W/Rh) is a typical anode/filter combination. Tungsten/aluminum (W/Al) can also be used. Vertical image resolution and depth of focus depend mainly on the acquisition geometry, i.e., the tomosynthesis angle (Fig. 2.4). The tomosynthesis angle is defined as the angular range over which the X-ray tube is moved relative to the pivot point. The greater the tomosynthesis angle, the better the depth resolution and the smaller the effective slice thickness. This results in less image blurring from adjacent tissues due to out-of-plane artifacts. A large tomosynthesis angle can also improve contrast resolution at low spatial frequencies (i.e., for relatively large objects) because the greater angular range can supply more information, especially at small spatial frequencies (see Chapter 2.3).7,8 It should be added, however, that a stationary detector that does not move simultaneously with the tube will reduce the accessible scan volume, owing to the oblique incidence of the X-ray beams. It is not possible to state an “optimum” angular range, because depth resolution is not the only parameter affected by the tomosynthesis angle. For example, a large tomosynthesis angle prolongs the scan time for a given angular velocity of the X-ray tube, increasing the risk of motion artifacts. Current scanners have tomosynthesis angles between 11 and 60°, all of which yield good results. To date, however, there have been no systematic clinical studies on how the tomosynthesis angle affects the detection of clinically relevant structures (spiculated lesions, microcalcifications) in the breast. Fig. 2.3 Breast tomosynthesis scanner, shown in the medio-lateral-oblique position. In addition to the limited angular range, the limited number of projections (sparse sampling) presents a challenge for 3D scanners. In the imaging of high-contrast objects, undersampling leads to Moiré effects (aliasing), which appear as streak artifacts similar to those seen in computed tomography (CT). The principle is the same in tomosynthesis, where the angular increment between exposures should not exceed several degrees, in order to prevent streak artifacts. In practice, the maximum number of projections is determined by the minimum dose at the detector per exposure to yield a total dose comparable to that of a conventional mammogram. The scan time, which translates to breast-compression time for the patient, depends on the number of projections for a given detector frame rate. Current tomosynthesis scanners, including prototypes, usually acquire between 7 and 30 projections in one examination. Thus, the following quantities depend on acquisition geometry, scan parameters, and system hardware components: • Resolution. • Noise. • Artifact level. • Dose. • Accessible volume. • Examination time. Fig. 2.4 Effect of the tomosynthesis angle on depth resolution. (a) A small tomosynthesis angle gives poorer separation of adjacent object points in the vertical direction. (b) A large tomosynthesis angle provides better separation of adjacent points in the vertical direction. All these quantities require optimization of the entire system. A survey published by Sechopoulos in 20139,10 provides an up-to-date technical review of breast tomosynthesis that covers all aspects of this topic—from acquisition geometry and detector technology, to the X-ray spectrum, dose, and image reconstruction. The article also surveys systems in current use. Fig. 2.5 Flowchart for analytical reconstruction by the filtered back-projection method. In tomosynthesis image reconstruction, the spatial distribution of the n-dimensional attenuation coefficient of the object is computed from (n–1)-dimensional projection images of the n-dimensional object acquired at different angles. Since the acquisition of tomosynthesis data is based on 2D projection images, the 3D attenuation coefficient is computed. Owing to the limited angular range of data acquisition (limited-angle tomography), this problem cannot be solved exactly, but its solution can be closely approximated using mathematical methods. Also, there is no objective, quantitative grayscale unit for the reconstructed slices that is comparable to the Hounsfield unit (HU) used in CT. Moreover, the limited tomosynthesis angle makes it impossible to achieve isotropic resolution. Resolution is lower in the direction of the central ray, hereafter called the vertical or z-axis, than along the x– and y-axes, because projections characterized by an angle larger than the tomosynthesis angle, which carry the additional information necessary for isotropic depth resolution, are not measured. As a result, only image slices that are perpendicular to the vertical axis are reconstructed in tomosynthesis. In systems with a stationary detector, these slices are parallel to the detector plane. In principle, two broad classes of method are available for tomosynthesis reconstruction: • Analytical reconstruction. • Iterative reconstruction. Analytical algorithms for tomosynthesis reconstruction are based on standard algorithms used in CT. Analytical methods employ specially designed reconstruction filters to compensate for scanning over a limited angular range and minimize artifacts. Various algorithms for tomosynthesis reconstruction have been described in the literature.5,11,12 The methods are called “analytical” because the solution is formulated analytically using an inverse Radon transformation. This solution is then fed into a computer and calculated by numerical methods. The basic technique for this type of reconstruction is described next (Fig. 2.5).13 First, the projection images necessary for slice reconstruction are determined from the 2D acquisition data, by taking the logarithm and by normalization with the non-attenuated intensity. According to Beer’s attenuation law, the projections necessary for the inverse Radon transform are represented by the line integrals through the object for rays that connect the X-ray focus to a point on the detector. These 2D projections are transformed with suitable reconstruction filters, to obtain filtered projection values. For better computer efficiency, this filtering is usually done by Fourier transformation in frequency space. The filtered projections are then back projected into the object volume (filtered back projection, FBP). This means that for a given voxel in the object volume, all projection values whose rays run precisely through that voxel, and thus contribute to the image, are summed and then averaged. The filter consists of a ramp filter like that used in CT. It has the property of inverting the ideal 2D CT problem, i.e., compensating for blurring caused by the angular sampling scheme, based on the acquisition geometry. However, because the ramp filter amplifies the high spatial frequencies, it also increases image noise. These high spatial frequencies must therefore be suppressed with a “spectral filter.” CT employs a combination of both filter types (ramp filter and spectral filter) called the Shepp–Logan filter.13 Because the tomosynthesis problem does not have an exact mathematical solution, different FBP techniques use different filter designs, leading to differences in image appearance and artifact suppression.14,15,16,17Fig. 2.6 illustrates how different filter designs can affect the appearance of an image. Fig. 2.6a shows a tomosynthesis slice reconstructed with an edge-enhancing filter, generating an image that resembles a CT scan. Fig. 2.6b shows the same slice from the same data set, reconstructed with adifferent filter. By accentuating the glandular breast tissue, this image looks more like a mammogram. Unlike analytical reconstruction, iterative techniques solve the inverse problem by first formulating the system equation for the relationship between the object and projection data, as an algebraic equation in the form of a large system of equations, and then solving it numerically. Because the system of equations is extremely large, it can only be solved with iterative techniques. As the iterations are carried out, the projection values computed from the object of interest are compared with the measured projection values in each iterative step. Based on the discrepancy, the object distribution is improved in a step-by-step fashion, until the solution fulfills a certain optimality criterion (Fig. 2.7). This can be done by various iterative methods, such as the algebraic reconstruction technique (ART), simultaneous ART (SART),18 or simultaneous iterative reconstruction technique (SIRT). By basing the formulation of the problem on the Poisson statistics for X-ray quanta, a statistical iterative method can be supplied, using a “maximum-likelihood” reconstruction algorithm.19 Additionally, constraints and prior knowledge may be available during the solution process. This yields a more stable solution with low image noise (maximum a posteriori methods or penalized maximum-likelihood algorithms).
The Physics of Tomosynthesis
2.1 Introduction
2.2 Data Acquisition and Scanning
2.3 Image Reconstruction
2.3.1 Analytical Reconstruction
2.3.2 Iterative Reconstruction
Radiology Key
Fastest Radiology Insight Engine