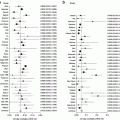
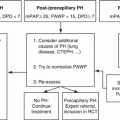
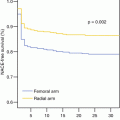
Fig. 3.1
Two pathways leading toward the phenotype of frailty (Adapted from Ref. [1] with permission)
Afilalo et al. wrote in a meta-analysis, that frailty is associated with a two- to threefold increase in the prevalence of coronary artery disease (CAD) and is a powerful predictor of mortality in cardiovascular patients independent of age, underlying disease severity, comorbid conditions and disability [1]. In a recent review article the frequency of frailty was reported to be in a range from 10 to 60 %, depending on CVD (cardiovascular disease) burden and definition of frailty [2]. According to Afilalo, “epidemiological studies have consistently demonstrated that frailty carries a relative risk of >2 for mortality and morbidity across a spectrum of stable CVD, acute coronary syndromes, heart failure, surgical and transcatheter interventions” [1] and in patients with CVD frailty causes a two fold increase in mortality [3] Figs. 3.2 and 3.3.
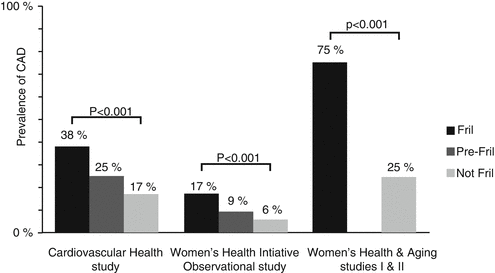
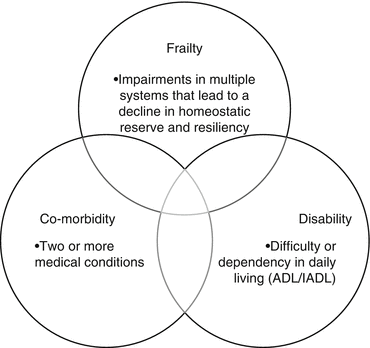

Fig. 3.2
Prevalence of cardiovascular disease stratified by frailty status according to the Fried’s criteria (Adapted from Afilalo et al. [1] with permission)

Fig. 3.3
Overlap between frailty, comorbidity and disability. ADL activities of daily living, IADL instrumental ADL (Adapted from Ref. [1] with permission)
The questions and challenges for interventional cardiologists, treating such patients are:
1.
To which extent will the above mentioned preconditions impact the chosen treatment route for cardiac disease (either medical, interventional or surgical).
2.
If so, then risk assessment for those patients, who are forwarded to PCI appears crucial in order to identify patients at risk and to re-evaluate treatment strategy.
3.
Third and most important, what effect does either therapy or withholding of therapy have in those patients. Does the patient benefit from an intervention or do we cause harm – this question remains unsolved.
Definition and Measurement
According to Morley JE [4], frailty is a syndrome in which a patient has subclinical impairment of routine activities that exceeds normal age related deterioration. Different measurements of frailty were proposed (Tables 3.1 and 3.2). Fried et al. defined frailty having more than three of the following parameters: weight loss, exhaustion, low activity and slowed walking speed [5].
Table 3.1
Components of the Fried frailty scale
Shrinking (weight loss) | Shrinking was defined through self-report as an unintentional weight loss of ≥10 pounds in the last year |
Decreased grip strength (weakness) | Weakness was assessed by grip strength, and was measured directly with a hand-held JAMAR dynamometer (Sammons Preston Rolyan). Three serial tests of maximum grip strength with the dominant hand were performed, and a mean of the 3 values were adjusted by gender and body mass index (BMI).8,9 Weakness was defined as an adjusted grip strength in the lowest 20th percentile of a community-dwelling population of adults 65 years of age and older. Men met the criteria for weakness if their BMI and grip strength were ≤24 and ≤29 kg; 24.1–26 and ≤30 kg; 26.1–28 and ≤31 kg; >28 and ≤32 kg, respectively. Women met the criteria for weakness if their BMI and grip strength were ≤23 and ≤17 kg; 23.1–26 and ≤17.3 kg; 26.1–29 and ≤18 kg; and >29 and ≤21 kg, respectively |
Exhaustion | Exhaustion was measured by responses to the following 2 statements from the modified 10-item Center for Epidemiological Studies–Depression scale [13]: “I felt that everything I did was an effort” and “I could not get going.” Subjects were asked, “How often in the last week did you feel this way?” Potential responses were: 0 = rarely or none of the time (<1 day); 1 = some or a little of the time (1–2 days); 2 = a moderate amount of the time (3–4 days); and 3 = most of the time. Subjects answering either statement with response 2 or 3 met the criteria for exhaustion |
Low activity | Physical activities were ascertained for the 2 weeks before this assessment using the short version of the Minnesota Leisure Time Activities Questionnaire, and included frequency and duration. Weekly tasks were converted to equivalent kilocalories of expenditure, and individuals reporting a weekly kilocalorie expenditure in the lowest 20th percentile for their gender (men, <383 kcal/week; women, <270 kcal/ week) were classified as having low physical activity |
Slowed walking speed | Slowness was measured by averaging 3 trials of walking 15 feet at a normal pace. Individuals with a walking speed <20th percentile, adjusted for gender and height, were scored as having slow walking speed. Men met criteria if height and walk time were ≤173 cm and ≥7 s, or >173 cm and ≥6 s, respectively. Women met criteria if height and walk time were ≤159 cm and ≥7 s, or >159 cm and ≥6 s, respectively |
Table 3.2
Measurement thresholds for frailty criteria according to Fried et al.
Criteria | Threshold for meeting core frailty element | Study prevalence | |
|---|---|---|---|
Exhaustion | Responds “3 or more days in the past week” to how often they felt either of the following: (1) I felt that everything I did was an effort (2) I could not get “going” | 211/595 (35 %) | |
Weight loss | Unintentional weight loss of ≥10 lbs in past year | 47/625 (7.5 %) | |
Women | Men | ||
Physical activity | AMI <270 kcal/weak | AMI <383 kcal/weak | 169/521 (32 %) |
Grip strength | ≤17.0 kg if BMI ≤23 kg/m2 ≤17.3 kg if BMI 23–26 kg/m2 ≤18.0 kg if BMI 26–29 kg/m2 ≤21.0 kg if BMI ≥29 kg/m2 | ≤29.0 kg if BMI ≤24 kg/m2 ≤30.0 kg if BMI 24–26 kg/m2 ≤31.0 kg if BMI 26–28 kg/m2 ≤32.0 kg if BMI >28 kg/m2 | 202/617 (33 %) |
Walk time | ≥7 s if ≤159 cm tall ≥6 s if >159 cm tall | ≥7 s if ≤173 cm tall ≥6 s if >173 cm tall | 249/606 (41 %) |
Up to 20 frailty assessment tools have been developed, with most tools revolving around the core phenotypic domains of frailty: slow walking speed, weakness, inactivity, exhaustion and shrinking – measured by physical performance tests and questionnaires.
Among all these tests, the Fried Scale is predominantly used and best evaluated, including parameters such as slowness, weakness, low physical activity, exhaustion and shrinking (unintentional weight loss) (Ref. [5]).
Another commonly used test is the short physical performance battery (SPPB) [8]. Contrary to the other frailty scales, 5 m gait speed and handgrip strength has been advocated as a single-item measurement of frailty. Especially gait speed seems to have excellent interrater variability [9].
Is it frailty alone, which has to be incorporated into the risk evaluation of patients undergoing coronary intervention or other alternative parameters like gait speed, the “timed-up-and-go-Test” and other specifications like nutritional status, cognition and poor functional status? The extent to which these parameters impact the results, is still under research and consequently needs further evaluation.
Data
Drey et al. investigated whether the Fried frailty criteria could serve as an inclusion criteria for a randomized controlled trial, because these criteria had usually been applied in epidemiological and very rarely in interventional studies [10]. A total of 298 people were screened: among them 181 were not frail, 116 were pre-frail and 1 was diagnosed as frail. The most prevalent criterion was exhaustion (24 % of those screened). The second most prevalent criterion was low handgrip strength (20 %). Low gait speed (8 %), low physical activity (2 %) and weight loss (2 %) had a lower prevalence. According to the Geriatric Depression Scale, 14 % of those who met the criterion ‘exhaustion’ were depressed. With regard to the Minnesota Leisure Time Physical Activity Questionnaire used for the evaluation of ‘physical activity’, only 3 activities among the 18 selected by Fried were applicable to the studied cohort. The authors concluded, that under study conditions, good applicability of the Fried criteria was observed, however further refinement might be expedient in several criteria, especially exhaustion and physical activity in order to enhance clinical usefulness.
In a systematic review article including nine studies and encompassing 54,250 elderly patients with a mean weighted follow-up of 6.2 years, Afilalo et al. investigated the role of frailty in cardiovascular disease in community-dwelling elders [1] Table 3.3.
Cardiovascular disease (CVD) was associated with an odds ratio (OR) of 2.7–4.1 for prevalent frailty and an OR of 1.5 for incident frailty in those who were not frail at baseline. Gait velocity (as a measure of frailty) was associated with an OR of 1.6 for incident CVD. In elderly patients with documented severe coronary artery disease or heart failure, the prevalence of frailty was 50–54 % and this was associated with an OR of 1.6–4.0 for all-cause mortality after the adjustment of potential confounding variables. The authors concluded, that there is a relation between frailty and CVD and that frailty may lead to CVD, just as CVD may lead to frailty. The presence of frailty results to an incremental increase in mortality, consequently implying that the role of frailty assessment in clinical practice might refine estimates of cardiovascular risk, which tend to be less accurate in the heterogenous elderly patient population.
Table 3.3
Milestone studies to evaluate the impact and coincidence of frailty and CAD
Study | Design | n | Population | Key variables |
|---|---|---|---|---|
Fried et al. [5] (2001) | Secondary analysis | 450 | Community dwellers | Frailty (Chin), prevalent CVD, 3-year mortality |
Makary et al. [6] (2010) | Secondary analysis | 4735 | Community dwellers | Frailty (Fried), prevalent CVD, subclinical CVD, 7-year mortality |
Singh et al. [7] (2011) | Secondary analysis | 2962 | Community dwellers | Frailty (Klein), prevalent CVD, 10-year mortality |
Drey et al. [10] (2011) | Secondary analysis | 40,657 | Community dwellers | Prevalent frailty (Fried), incident frailty (Fried), prevalent CVD, 5.9-year mortality |
Munoz-Mendoza et al. [9] (2011) | Secondary analysis | 670 | Community dwellers | Frailty (Fried), prevalent CVD, 3-year mortality |
McNulty et al. [13] (2011) | Prospective cohort | 1332 | Outpatients with chronic heart failure | Frailty (Lachs), 12-year mortality |
Gharacholou et al. [12] (2012) | Prospective cohort | 309 | Inpatients with severe coronary artery disease | Frailty (Fried, Rockwood, gait velocity), 6-month mortality |
Purser et al. [11] (2006) | Prospective cohort | 3075 | Community dwellers | Frailty (gait velocity), incident CVD, 4.9- year mortality |
Ekerstad et al. [14] (2011) | Prospective cohort | 60 | Outpatients with chronic heart failure | Frailty (Fried). 6-min walk test |
Purser et al. tried to characterize physiological variations in hospitalized older adults with severe coronary artery disease (CAD) and evaluate the prevalence of frailty in this sample [11


Stay updated, free articles. Join our Telegram channel

Full access? Get Clinical Tree


