, A. G. Gennari3, R. Angileri3, P. Martingano3, M. Cavallaro3 and E. Quaia3
(3)
Department of Radiology, Cattinara Hospital, University of Trieste, Strada di Fiume 447, 34149 Trieste, Italy
Since its introduction in the early 1970s, computed tomography (CT) has undergone tremendous improvements in technology, performance, and clinical applications. CT has evolved from conventional to spiral and, lastly, to multidetector technology which allows faster scanning and isotropic spatial resolution. Nowadays, multidetector-row CT (MDCT) is considered a well-established modality for the study of the urinary tract allowing a detailed evaluation of the kidneys, renal vessels, pelvis, calyces, ureters, peri- and pararenal spaces, and surrounding organs.
1.1 Technical Developments of MDCT
MDCT involves the use of a multiple-row detector array instead of the traditional single-row detector array used in single-slice spiral CT (Coppenrath and Mueller-Lisse 2006).
In MDCT scanners, each individual detector is segmented in the z-axis direction. Different section width must be available to adjust the optimum scan speed, longitudinal resolution, and image noise for each application. With a single-slice CT detector, different collimated slice widths are obtained by prepatient collimation of the X-ray beam (Flohr et al. 2005). For a very elementary model of a two-slice CT detector consisting of m = 2 or two detector rows, different slice widths can be obtained by prepatient collimation if the detector is separated midway along the z-extent of the X-ray beam (Flohr et al. 2005). For m > 2, this simple design principle must be replaced by more flexible concepts requiring more than m detector rows to simultaneously acquire m slices. Different manufacturers of MDCT scanners have introduced different detector designs (Flohr et al. 2005). Different slice widths can be obtained combining several detector rows electronically to a smaller number of slices according to the selected beam collimation and the desired slice width. The fixed array detector consists of detector elements with equal size in the longitudinal direction. The adaptive array detector comprises detector rows with different sizes in the longitudinal direction, so different slice widths may be obtained by appropriate combinations of the detector rows. Dual-source CT (DSCT) has been recently introduced. It is equipped with two X-ray tubes and two corresponding detectors; using the z-flying spot technique, each detector acquires 64 overlapping 0.6 mm slices per rotation. The main advantage of DSCT is the improved temporal resolution which is particularly useful in cardiac imaging. In abdominal applications, DSCT is beneficial for the examination of obese patients; indeed, its power reserve reaches 200 kW when both acquisition systems are simultaneously used. Additionally, both X-ray tubes can be operated at two different kV and mA settings, allowing the acquisition of dual-energy datasets (Flohr et al. 2006).
Technical specifications of different CT scanner are reported in Table 1.
Table 1
Technical specifications of different MDCT scanners
CT scanner | 4-slice CT | 16-slice CT | 64-slice CT | 256-slice CT | 320-slice CT | Dual-source CT |
|---|---|---|---|---|---|---|
Detector collimation (mm) | 4 × 1 | 16 × 0.5 | 64 × 0.5 | 2 × 128 × 0.6* | 320 × 0.5 | 2 × 32 × 0.6*; 2 × 64 × 0.6* |
4 × 1.25 | 16 × 0.625 | 64 × 0.65 | ||||
16 × 0.75 | 2 × 32 × 0.6* | |||||
Slice width (mm) | 1.3 | 0.8–1.0 | 0.5–0.8 | 0.6 | 0.5 | 0.6 |
Spatial resolution (mm) | 1 | 0.6 | 0.33–0.60 | 0.4 | 0.35 | 0.30–0.33 |
Gantry rotation time (s/rotation) | 0.5 | 1.375–0.420 | 0.28–0.40 | 0.27 | 0.35 | 0.27–0.33 |
Consequently MDCT allows larger volume coverage in shorter scan times and thinner slices with an improved longitudinal resolution along the z-axis (patient axis). Subsecond gantry rotation and large detector size permit rapid volume coverage, not only facilitating multiphase scanning with short breath-holds but also minimizing respiratory motion artifacts. Due to short scan times, the kidneys can be depicted in well-defined (dynamic) phases of contrast enhancement, and renal lesions can be characterized more precisely. Thinner slices allow better spatial resolution. Nevertheless, it is advisable to choose a reconstruction thickness of 3–5 mm as a compromise between spatial resolution and contrast-to-noise ratio. On the basis of radiological findings, reconstructions in other planes and slice thickness, down to the submillimeter range, can be added (depending on scanner type and number of detector rows available).
Narrow collimation, used in most of MDCT scanners, produces isotropic voxel, so the arbitrarily reconstructed planes come close to the image quality in the original scan plane. Thanks to all these improvements, MDCT has further increased the efficacy of CT technique and expanded its applications in the urinary tract. Among these new applications, the evaluation of the urinary tract – MDCT urography – is the most innovative.
CT has been used to effectively evaluate many urinary tract disorders including characterization of renal masses that are indeterminate or suspicious at US, cystic lesions (Bosniak 1991; Curry 1995; Silverman et al. 2008), tumors, pseudotumors, calcifications, urinary tract calculi (Primak et al. 2007; Türkbey et al. 2010), genitourinary trauma (Goldman et al. 2004; Srinivasa et al. 2009), arteriovenous malformations, and renal infection (Dalla Palma et al. 1997). Indications for CT investigation of the kidney include urolithiasis, tumor diagnosis and staging, renal trauma, and vascular disease. In children, special indications for CT of the kidney are polytrauma and tumor staging. MDCT of the kidney has become a very valuable tool in urology, but a careful protocol strategy is mandatory.
1.2 Technical Parameters
1.2.1 Imaging
With the advances in CT technology, the imaging techniques to evaluate the kidneys and urinary tract have progressively changed. State-of-the-art X-ray CT tube/generator (Fig. 1a, b) combinations provide a peak power of 60–120 kW, usually at various user-selectable voltages, for example, 80, 100, 120, and 140 kV. The spatial resolution of the CT images may achieve 24 lines per cm with an image matrix size of 512 × 512, 768 × 768, or 1,024 × 1,024 pixels. Modern MDCT systems use solid-state detectors (Fig. 1c, d) consisting of a radiation-sensitive solid-state material (cadmium tungstate, gadolinium oxide, or gadolinium oxysulfide with suitable dopings), which converts the absorbed X-rays into visible light. The light is then detected by a Si photodiode. The resulting electrical current is amplified and converted into a digital signal. CT detectors must provide different slice widths to optimize scan speed, longitudinal resolution, and image noise for each application.
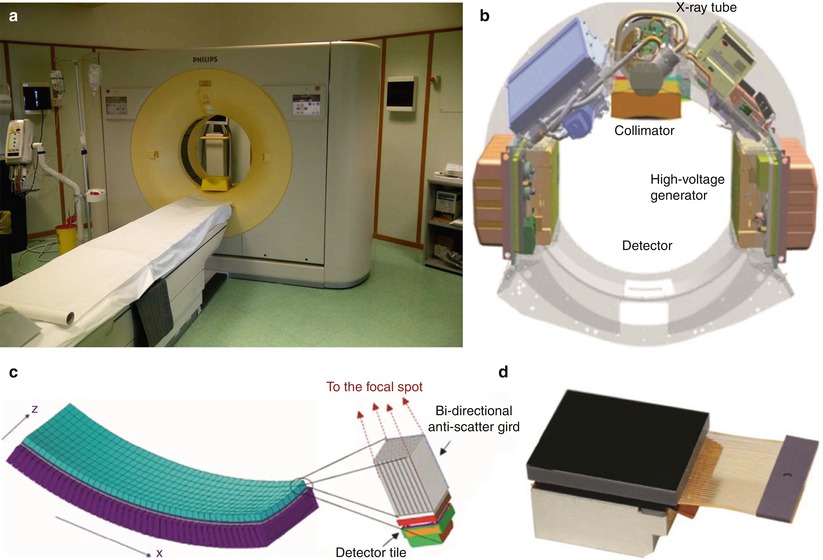
Fig. 1
(a–d) Geometry of the X-ray tube scanning in the multidetector CT (MDCT). (a) Modern 256-row MDCT scanner; (b) basic system components of a modern MDCT scanner. (c) MDCT detector array with evidence of a single detector structure with bidirectional anti-scatter grid; x corresponds to the rotating axis; z corresponds to the patient long axis. (d) A last generation detector with bidirectional antiscatter grid (Courtesy of Philips)
Nowadays, the visualization of the acquired images at the workstation is supported by simple visualization interfaces and the radiologist can review the images on axial, coronal, sagittal, and multiplanar reformation (MPR), which describes the option of arbitrary plane reconstruction from volumetric datasets. These planes can be chosen in an orthogonal plane (sagittal, coronal), in an oblique plane, or even in a curved-planar reconstruction (e.g., for course of vessels). Coronal images are useful in the evaluation of the kidney because they can be depicted in one single image rather than in multiple axial sections. Although normal coronal images cannot depict the entire ureter in a single image, the evaluation of the urinary tract is, anyway, simple. Moreover, the coronal plane is suitable for reconstruction of an “in situ” perspective resembling the view of the abdominal or urologic surgeon. Maximum intensity projection (MIP) images are more indicated in the evaluation of the urinary tract, in relation with its opacification with contrast media. MIP depicts the structures of highest CT density within a volume of interest. Volume rendering technique (VRT) is an image-processing option that emphasizes regions of selected CT density range, thereby accentuating specific tissues or organs.
Image quality of any given CT system is determined by a number of scanning parameters that the user can modify: (a) collimation, (b) pitch (Fig. 2), (c) reconstruction interval, and (d) timing of scanning after contrast injection. Optimizing these parameters to achieve the best possible image quality for a specific MDCT examination requires thorough understanding of their interrelationships. Collimation is related to spatial resolution, image noise, and length of coverage. Spatial resolution may be increased by means of a decrease in the collimator width, but decreased collimator width also results in increased image noise and decreased length of coverage. The reduced coverage encountered with narrow collimation, however, can potentially be overcome with an increase in pitch.
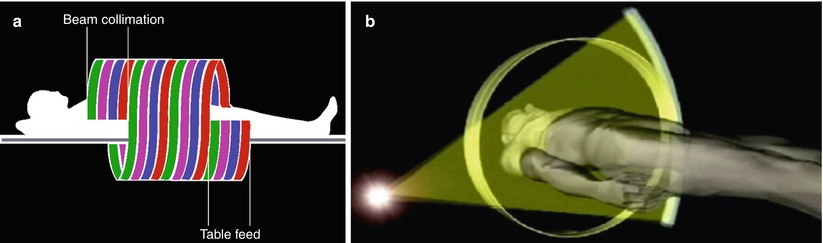
Fig. 2
(a) Scanning geometry of the fan beam produced by the MDCT scanner (courtesy of Toshiba). (b) The concept of pitch that corresponds to the table feed during a 360° rotation of the tube-detector apparatus divided by the collimator width. For single detector computed tomography (CT) scanners, the pitch corresponds to the table feed/collimation. For MDCT, there are two distinct versions of pitch, depending on whether the detector collimation (i.e., beam/4 in 4 detector row multislice CT) or the entire beam collimation is considered
The effective detector row thickness is simply the sum of the widths of the contributing detector rows for each channel. In multidetector-row CT scan acquisitions, the effective detector row thickness of all channels must be identical. Effective detector row thickness is an important parameter because the reconstructed section thickness cannot be smaller than the effective detector row thickness. The term detector configuration describes a given scan acquisition mode in terms of the number of z-axis data channels being used and the effective detector row thickness of each data channel (Saini 2004). The beam collimation is simply the product of the number of data channels being used and the effective detector row thickness (Saini 2004).
In single-slice helical CT, pitch (p) is defined as the table feed during a 360° rotation of the tube-detector apparatus (mm/rotation) divided by the collimator width in millimeter (collimated beam width). It shows whether data acquisition occurs with gaps (p > 1) or with overlap (p < 1) in the longitudinal direction. In MDCT the beam collimation is different from the slice collimation, and the beam collimation depends on the number of detector rows. In particular, in MDCT there are two distinct versions of pitch, depending on whether the entire beam collimation is considered or the “detector” collimation (Fig. 2) (i.e., beam/4 in 4-detector-row MDCT) is used. The selection of pitch for MDCT is affected by several factors such as the required length of coverage, reconstructed section thickness, and image noise. For a given duration of scanning, minimization of collimation (thus, an increase in pitch) will allow a narrow reconstructed section thickness and potentially improve spatial resolution, particularly in nonaxial planes. However, maximization of pitch may also result in a decrease in contrast resolution. Thus, the most appropriate choice of scanning parameters depends on the imaging problem under consideration. For example, since CT angiography (CTA) allows imaging of structures with very high attenuation against a background of much lower attenuation (i.e., high inherent contrast), the loss of contrast resolution caused by maximization of pitch can be disregarded. The smaller the reconstruction interval, the greater the longitudinal (z-axis) resolution, with a resultant loss in z-axis coverage. If multiplanar reconstructions will be required, a small reconstruction interval with overlapping sections is advantageous. With the evolution of CT from single-slice spiral CT to MDCT, the collimation has been reduced from 3–5 mm to 0.5–1 mm of the most recent 64-row MDCT scanner (0.5–0.625 mm). A decrease in pitch from 1–1.5 to 0.75–0.80 has also been achieved. As a consequence, the thickness of the reconstructed images has been decreased from 5 to 0.5 mm. The final result is the “isotropic voxel,” which provides coronal, sagittal, and oblique multiplanar reformats with the same resolution of the original axial CT sections. A further advantage of state-of-the-art MDCT is the short scan time which varies from 0.27 to 0.5 s for a single 360° rotation.
MDCT examination can be performed before and after intravenous contrast administration. Breath-hold images that are essentially free from motion artifact and respiratory misregistration can be quickly obtained during multiple phases of renal enhancement. The preliminary scan without intravenous contrast administration should be performed also without administration of hyperdense oral contrast agents (e.g., Gastrografin), because these might impair visualization of the kidneys or the ureters in MIP images. The timing of peak aortic and hepatic contrast enhancement is primarily dependent on the rate of injection. Rapid or low-volume (shorter-duration) injections produce earlier peak enhancement, whereas slow or high-volume (longer-duration) injections result in later peak enhancement. These factors must be taken into account before a fixed scanning delay is instituted. A preliminary minibolus (5 mL/s for 4 s), with scanning every 2 s beginning 10 s after the injection is started, can be used. The time to peak aortic enhancement is determined from the resultant time attenuation curve and is used to calculate the scanning delay. The scanning delay can also be accurately timed with a bolus tracking software program.
1.2.2 Artifacts
In CT, the term artifact is applied to any systematic discrepancy between the CT numbers in the reconstructed image and the true attenuation coefficients of the object.
Beam hardening: an X-ray beam is composed of individual photons with a range of energies. As the beam passes through an object, its mean energy increases (harder X-ray beam), because the lower-energy photons are absorbed more rapidly than the higher-energy photons (Barrett and Keat 2004). Two types of artifact can result from this effect: the cupping artifact and the appearance of dark bands or streaks between dense objects in the image. Cupping artifact manifests when the X-rays passing through the middle portion of a uniform cylindrical phantom are hardened more than those passing through the edges because they are passing through more material. As the beam becomes harder, the rate at which it is attenuated decreases. So the beam is more intense than expected when it reaches the detectors. Therefore, the resultant attenuation profile differs from the ideal profile that would be obtained without beam hardening. Dark bands or streak artifacts can appear between two dense objects in an image. They occur because the portion of the beam that passes through one of the objects at certain tube positions is hardened less than when it passes through both objects at other tube positions. This type of artifact can occur both in bony regions of the body and in scans where a contrast medium is used (Barrett and Keat 2004).
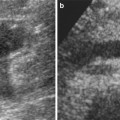
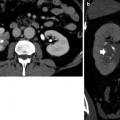
Renal cyst pseudoenhancement: renal cyst pseudoenhancement refers to the artifactual increase in the attenuation (>10 HU) of simple intrarenal cysts surrounded by normally enhancing renal parenchyma, following contrast material administration, even when the effects of partial volume averaging have been removed (Prasad et al. 2008). Pseudoenhancement is a consequence of overcorrection for beam-hardening effects of the enhanced renal parenchyma combined with artifact introduced by the CT image reconstruction algorithm (Abdulla et al. 2002; Coulam et al. 2000). This effect is more pronounced at high levels of renal parenchymal enhancement (Fig. 3) in small intrarenal lesions <2 cm because volume averaging and beam-hardening effects have a higher statistical impact on the measurements within small renal lesions. This problem is magnified by the fact that renal cysts are present in 20–40 % of the population. The differential diagnosis with certain subtypes of renal cell carcinomas, as the papillary one, may be difficult because they both have a weak and homogeneous enhancement. Therefore, pseudoenhancement may lead to mischaracterization of a small renal cyst as an enhancing neoplasm. Lesion characterization using US may solve this problem; US presents the highest accuracy in the differentiation of solid vs. cystic renal masses. A recent report suggests that pseudoenhancement is more common with newer-generation MDCT scanners than with earlier scanners (Wang et al. 2008).
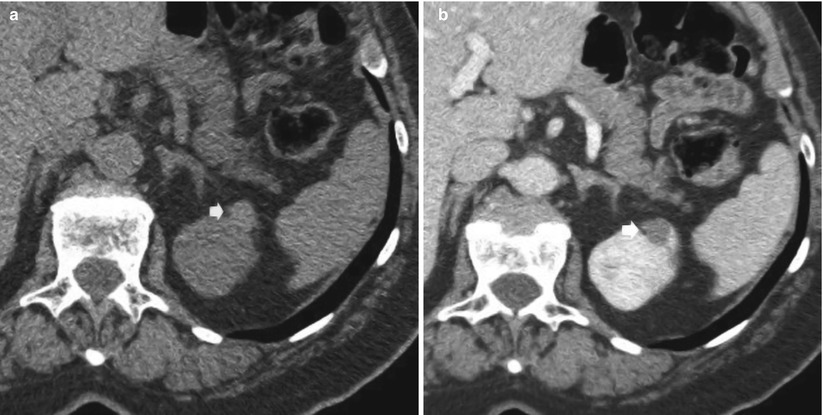
Fig. 3
(a, b) Pseudoenhancement in a small cyst (arrow) of the upper renal pole of the left kidney. Seventy-year-old woman with incidental renal lesion. (a) Unenhanced CT image (collimation, 0.5 mm) shows a 1-cm lesion isodense partially intraparenchymal lesion measuring 20 HU. (b) Nephrographic phase (collimation 0.5 mm, beam pitch 1) of the same lesion in (a). Enhanced attenuation was 50 HU (pseudoenhancement 30 HU). Lesion revealed a cystic pattern on US and was stable for more than 3 years on CT follow-up (not shown)
Partial volume: the partial volume effect represents a separate problem from partial volume averaging, which yields a CT number representative of the average attenuation of the materials within a voxel. There are a number of ways (Figs. 4 and 5) in which the partial volume effect can lead to image artifacts. One type of partial volume artifact occurs when an object (Figs. 4c and 5c) lying off-center protrudes partly into the width of the X-ray beam creating the false impression of contrast enhancement. This type of artifacts can be avoided by using a thin acquisition section width. Small cystic renal lesions with a diameter smaller than 1 cm are more frequently affected by partial volume effect. The distinction between solid and cystic renal lesions, seen at CT, is determined primarily on the evaluation of whether the lesion enhances after the intravenous administration of iodinated contrast material. While this approach is generally robust, the assessment of enhancement in small renal cystic lesions may be unreliable. In some cases, the differential diagnosis between a small renal tumor and a small cystic lesion cannot be established. This is because attenuation measurements for such small lesions may erroneously suggest enhancement. Thin slices (0.5–1 mm) minimize the partial volume effect and allow the measurement of the exact density in Hounsfield units (HU) in most cases. Another type of partial volume artifact occurs when a small cystic renal mass has a diameter smaller than the CT section thickness (Figs. 4d and 5d); its attenuation usually ranges between the HU values of water and HU values of renal parenchyma.
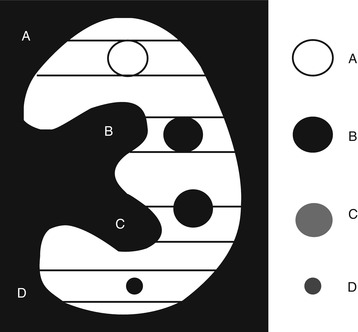
Fig. 4
Scheme showing the partial volume effect on small renal masses. (A) Solid mass completely filling the CT section thickness appearing hyper- or isodense in comparison to the adjacent renal parenchyma; (B) Cystic renal mass completely filling the CT section thickness correctly represented with liquid attenuation; (C) Partial volume effect. Cystic renal mass partly crossing the CT section limits and incorrectly represented with a supraliquid attenuation. (D) Partial volume effect. Cystic renal mass with a diameter smaller than the CT section thickness and represented with an attenuation between the liquid and renal parenchyma
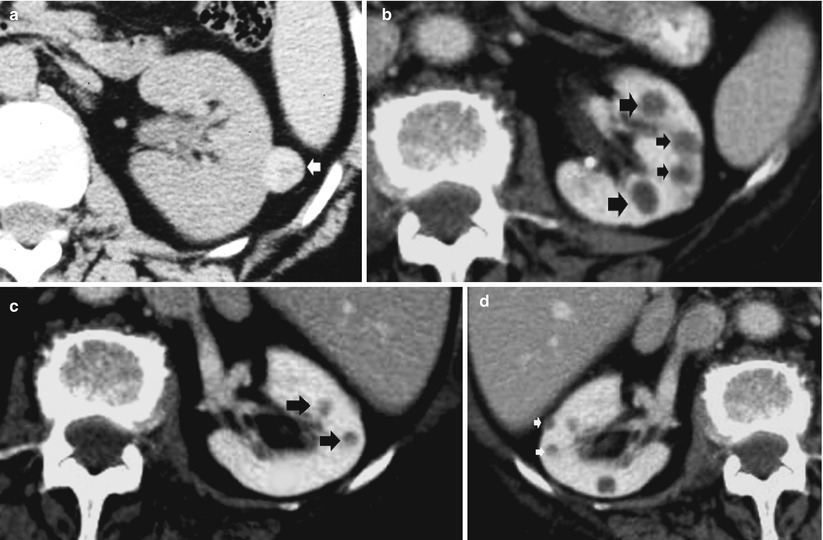
Fig. 5
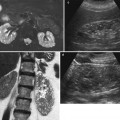
(a–d) Partial volume effect on the renal lesion density. (a) Solid renal mass with hyperdense appearance (arrow); (b) multiple cystic renal lesions correctly represented with a liquid attenuation (arrows); (c) cystic renal lesions (arrows) partly crossing the CT section limits with equivocal density due to partial volume artifact. (d) Small renal cystic lesions (arrows) with a diameter smaller than the CT section thickness with equivocal density due to partial volume artifact
Photon starvation: a potential source of serious streaking artifacts is photon starvation, which can occur in highly attenuating areas such as the shoulders or when the patient’s arms are lying along the body. Studies have shown that X-ray is less attenuated in the anteroposterior direction than in the lateral direction in which insufficient photons reach the detectors. Therefore, at these tube angulations, very noisy projections are produced. The reconstruction process has the effect of greatly magnifying the noise, resulting in horizontal streaks in the image. On some scanner models, the tube current is automatically adjusted during the course of each rotation, in order to maintain a user-specified noise level in the image data. This process is known as milliamperage modulation. Thanks to this technique, sufficient photons pass through the widest parts of the patient without unnecessary dose to the narrower parts.
Cone beam effect (artifact): with the increasing number of sections acquired per rotation, a wider collimation is required and X-ray beam becomes cone shaped rather than fan shaped. As the tube and detectors rotate around the patient (in a plane perpendicular to the diagram), the data collected by each detector correspond to a volume contained between two cones, instead of the ideal flat plane. This leads to artifacts similar to those caused by partial volume around off-axis objects. The cone beam artifacts are more pronounced for the outer detector rows than for the inner ones where the data collected correspond more closely to a plane (Barrett and Keat 2004) and increase with the increase in the number of detector rows. With 4-slice scanners, the cone beam effects were tolerable, and conventional filtered back projection reconstruction was still usable because the total X-ray beam width was sufficiently narrow (e.g., 5-mm wide for four 1.25-mm slices) or else the slices were sufficiently thick (four 5-mm slices). MDCT scanners of later generations required the development of alternate cone beam reconstruction algorithms (Goldman 2008).
1.2.3 Radiation Dose
CT scanning provides high-quality diagnostic information, but it is also usually described as a high-dose procedure (Cohnen et al. 2003). Factors that may contribute to the delivery of high radiation dose related to CT evaluation of the urinary tract include replacement of conventional radiography by CT, need for multiple follow-up CT studies, and need for multiphase CT protocols (Kalra and Singh 2008).
Absorbed dose is defined as the energy absorbed per unit mass and is measured in gray (Gy) and its subunit, the milligray (mGy). The effective dose is defined, by the International Commission on Radiological Protection (ICRP 2007), as a single dose quantity reflecting the overall risk from any radiation exposure to a reference person, where the risk is averaged over all ages and both sexes. Effective dose is calculated by summing the absorbed dose in individual organs, weighted by the radiation sensitivity. It is useful for comparing the risks to a reference patient from different imaging techniques and procedures, even though it should not be used for individual patients or detailed risk assessment. The equivalent dose, measured in sieverts (Sv), accounts for differences in the sensitivity of target organs to radiation damage and is calculated by multiplying the absorbed dose to a specific tissue with the radiation weighting factor, which is equal to 1 for X-rays.
Noise has an important influence on image quality, it is inversely related to the radiation dose, and it represents a limiting factor in the improvement of spatial resolution. CT image noise generally depends on the number of X-ray photons interacting with the detector array (quantum noise), electronic noise of the detectors, and reconstruction kernel (sharper kernels give noisier images). Noise is also dependent on the patient’s individual attenuation, convolution filters, slice thickness, pixel dimension, and radiation dose. The level of noise can be quantified easily from images by positioning a standard region of interest in an anatomical structure of known density and measuring the standard deviation of the HUs values. Reduced dose should always be weighed against diagnostic image quality.
MDCT radiation dose and image quality are also affected by helical pitch (table feed/X-ray beam collimation), and radiation dose is inversely related to the pitch value. The radiation dose decreases proportionally with increasing pitch in CT systems with a single detector row, as the tube voltage and current are kept constant, while for multislice CT scanners the relationship between pitch and radiation dose is nonlinear in ECG-gated acquisition and linear in noncardiac mode. MDCT increases dose as a result of thinner collimation, overbeaming, and overranging effects. For example, in four-row scanners, effective dose is about 30 % higher with a collimation of 1 mm than with a collimation of 2.5 mm.
In current MDCT scanners with more than four rows, which allow for two different collimations (millimeter and submillimeter), radiation dose increases only by about 10 % when the smaller collimation is chosen. In spiral technique, additional tube rotations have to be performed at the beginning and at the end of the scan range because adjacent data from both sides are necessary for image reconstruction (interpolation). Therefore, the scanned volume exceeds the reconstructed volume. Moreover, the number of additional rotations depends on pitch, cone beam correction, and scanner type. The relative effect is high with short scan lengths or when a large collimation and high pitch are combined. The overranging effect (Fig. 6a) may cause considerable increase of dose resulting from the difference between the total table feed (table feed × (scan time/rotation time)) and the scan length as planned. A further problem of MDCT is the width of the fan beam in the z-axis direction. As four or more detector chambers have to be exposed, a broader X-ray beam is used compared with the fan beam in single-slice CT. In order to avoid penumbral effects in the external portions of the detector array, the primary collimation must be made wider than necessary to expose only the detector array.
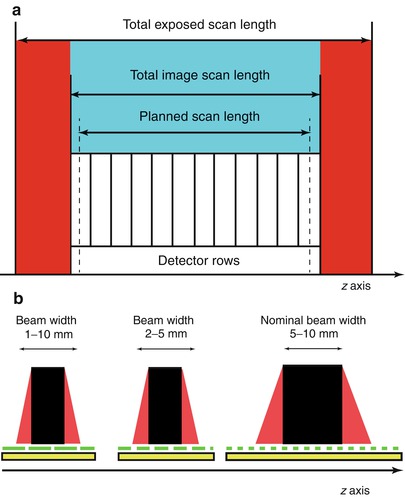
Fig. 6
(a) Overranging effect. In current MDCT scanners with more than four rows, additional tube rotations have to be performed at the beginning and at the end of the scan range because adjacent data from both sides are necessary for image reconstruction (interpolation). Therefore, the scanned volume (red) exceeds the reconstructed volume (blue). The number of additional rotations depends on pitch, cone beam correction, and scanner type. (b) Overbeaming effect. The width of the fan beam in the z-axis direction is broader in MDCT scanner with four or more detector rows, and overbeaming reduces the portion of the beam that is captured by the detector array (beam efficiency). In order to avoid penumbral effects in the outer portions of the detector array (detector area covered by the red area of the fan beam), the primary collimation must be made wider than necessary to expose only the detector array. The wider the incident beam, the smaller the percentage of “wasted” radiation due to overbeaming. Since unused radiation is delivered to the patient owing to overbeaming, when the beam collimation is consequently reduced, for a given z-axis coverage at a constant pitch, the number of rotations will need to be increased, contributing “wasted” radiation
Overbeaming or “penumbra” effect (Fig. 6b) is a specific characteristic of MDCT, which reduces the portion of the beam that is captured by the detector array (beam efficiency) with a consequent increase in noise and decrease in the contrast-to-noise ratio. Even when the incident X-ray beam is collimated to the targeted detector rows, the beam is always slightly wider than the rows. For example, in MDCT, the incident X-ray beam is about 2 mm wider than the selected detector configuration (Saini 2004). Hence, the wider the incident beam, the smaller the percentage of “wasted” radiation due to overbeaming. Since unused radiation is delivered to the patient owing to overbeaming, when the beam collimation is consequently reduced, the number of rotations will need to be increased, contributing “wasted” radiation. Thus, for example, a 16 × 0.625-mm acquisition will require twice as many rotations as a 16 × 1.25-mm acquisition, and, therefore, an approximately 3 % higher radiation dose will be delivered (Saini 2004) (Fig. 6b).
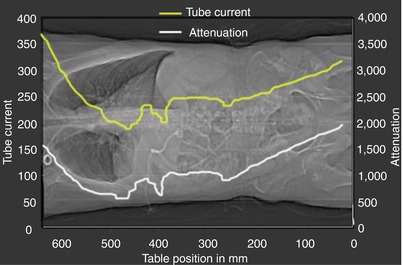
Fig. 7
Automated tube current modulation (ATCM). Dose modulation is based on the principle that decrease in body diameter (i.e., the anteroposterior diameter when compared to the lateral diameter) translates into decrease in radiation necessary to obtain a certain contrast-to-noise ratio in the resulting CT image data. Tube current is in milliampere; attenuation is expressed as the ratio between the incident intensity over the transmitted radiation intensity through a layer of material
Moreover, the bowtie filters are commonly employed in CT scanners to minimize radiation dose by reducing intensity variations across detector elements in the presence of patient anatomy. This filtration modifies a number of X-ray beam properties (effective energy, flux, first- and second-order statistics), making them nonuniform across the fan beam field of view.
Tube load parameters are very scanner specific, and CT dose index (CTDI) and dose–length product (DLP) are better usable entities to indicate the absorbed dose for protocol comparison and optimization. The fundamental parameter of radiation dose is the CTDI measured by a dose phantom in grays (Gy) and represents the integrated dose along the z-axis from a single rotation of the X-ray tube. CTDI can be measured in air or in a perspex phantom of 16 cm (representing head) or 32 cm (representing body) diameter. Measurements are commonly made both at the center and the periphery (1 cm from the surface). The weighted sum of central and peripheral CTDI values is known as the weighted CTDI (CTDIw) and represents the mean dose in the x–y plane. However, the CTDI does not indicate the precise dose for any individual patient but is rather an index of the dose as measured and calculated in a phantom, and it does not take into account patient-associated parameters such as size, shape, and inhomogeneous composition (Lee et al. 2008). Furthermore, in helical scanning, the pitch must be taken into account to give the mean dose within a scanned volume, and the volume CTDI (CTDIvol) corresponds to the weighted CTDI corrected by the pitch factor (dose index divided by pitch). The CTDIvol can be used to express the average dose delivered to the scan volume for a specific examination. This is the mean dose within a scanned medium. Normalized weighted CTDI (nCTDIw) in air is 0.070 mGy/mAs. CTDIw multiplied to a conversion factor (1/0.38) is converted to nCTDIw.
Another parameter used is the DLP, which is related to the total radiation exposure (mGy × cm) and gives an approximation of radiation risk, but it cannot give a direct assessment of the patient dose since it does not take specific organs into account. DLP is calculated from CTDIw as
 where CTDIw is the effective weighted CTDI (mGy); n is tube rotations; N is the number of detectors; and h is the slice thickness (in centimeters). DLP may be calculated also from CTDIvol multiplied by the length of the volume scanned:
Patient effective dose may be calculated by multiplying DLP for a specific coefficient representing typical adult and pediatric patients. This provides sufficiently precise estimation of effective dose for standard protocols and reference patients (Deak et al. 2008; Huda 2007; Shrimpton 1997).
Recent advances in CT technology such as automated tube current modulation, optimizing X-ray tube voltage, and the use of iterative reconstruction have allowed reduced radiation dose preserving good image quality.
The aim of automated tube current modulation, ATCM (Fig. 7), is to adjust radiation dose according to the patient’s attenuation. Dose modulation is based on the principle that decrease in body diameter (i.e., the anteroposterior diameter when compared to the lateral diameter) translates into decrease in radiation necessary to obtain a certain contrast-to-noise ratio in the resulting CT image data. Dose management technology in CT has led to the optimization of CT protocols using in-plane (xy-axes), longitudinal (z-axis), or combined (xyz-axes) modulation of the dose through dedicated automated dose modulation algorithms. It is important to realize that ATCM reduces dose in thinner patients, even though the dose may actually increase in thicker patients to compensate for the increase in image noise (Kaza et al. 2014).
Tube voltage has an exponential effect on radiation dose. At constant milliAmperage (mA), radiation dose decreases by approximately 65 % if the kV are reduced from 120 to 80 kV. The optimal kilovoltage for a CT study should be chosen based on imaging task and the habitus of the patient. Reducing kilovoltage implies an increase of the noise and this is especially evident in obese patients. To compensate for the reduced energy of the X-ray beam, the milliamperage needs to be increased. Iodinated structures have higher HU values at lower energies because the effective energy of the X-ray beam is closer to the k-edge of the iodine. Therefore, lesion characterization based on HU measured on CT scans performed at 120 kV would not be applicable (Kaza et al. 2014).
Iterative reconstructions are iterative algorithms to reconstruct 2D and 3D images. They are used to recognize the factor which contributes to noise development using a statistical model of noise and to remove the noise from the CT images improving the image quality. They provide improved image quality without increasing radiation dose or maintenance of image quality at a lower radiation dose (i.e., low kilovoltage) compared to conventional filtered back projection reconstruction (Kaza et al. 2014; Juri et al. 2013; Vardhanabhuti et al. 2013).
1.3 Unenhanced and Contrast-Enhanced CT
A typical CT examination of the kidneys consists of a multiphasic helical CT protocol. After acquisition of a digital projection radiograph (topogram), an unenhanced CT scan is usually obtained. According to the clinical indications contrast enhanced CT scans can be acquired in different contrast-enhancement phases: arterial, corticomedullary, nephrographic, and excretory phases. Examinations are usually performed from the superior edge of the kidneys, comprising the adrenal glands, to the pubic symphysis and the bladder. Tube current (100–330 mA, with a mean of 150 mA) is adjusted for each examination according to patient body habitus by using automated dose modulation algorithm. Breath-hold scanning is possible in less than 10 s, allowing the acquisition of thin-section images of the organ during the corticomedullary, nephrographic, and excretory phases with little or no respiratory or patient-motion artifacts (Prasad et al. 2008).
1.3.1 Patient Preparation
Sufficient hydration of the patient is essential to guarantee optimal excretion of contrast media during renal CT. This can be achieved by oral or intravenous administration of fluid volume. Nonetheless, concomitant disease, such as cardiac or renal insufficiency, has to be considered. Hydration may also minimize nephrotoxic effects of intravenous contrast media. Simultaneous oral contrast media administration may be useful; however, the application of positive oral contrast could produce interfering effects with CT arteriography or CT urography.
1.3.2 Unenhanced CT
Precontrast Scan
In CT protocols, the unenhanced CT scans are mandatory to:
Locate the kidneys and visualize possible morphological anomalies.
Detect renal or urinary stones (Fig. 8).
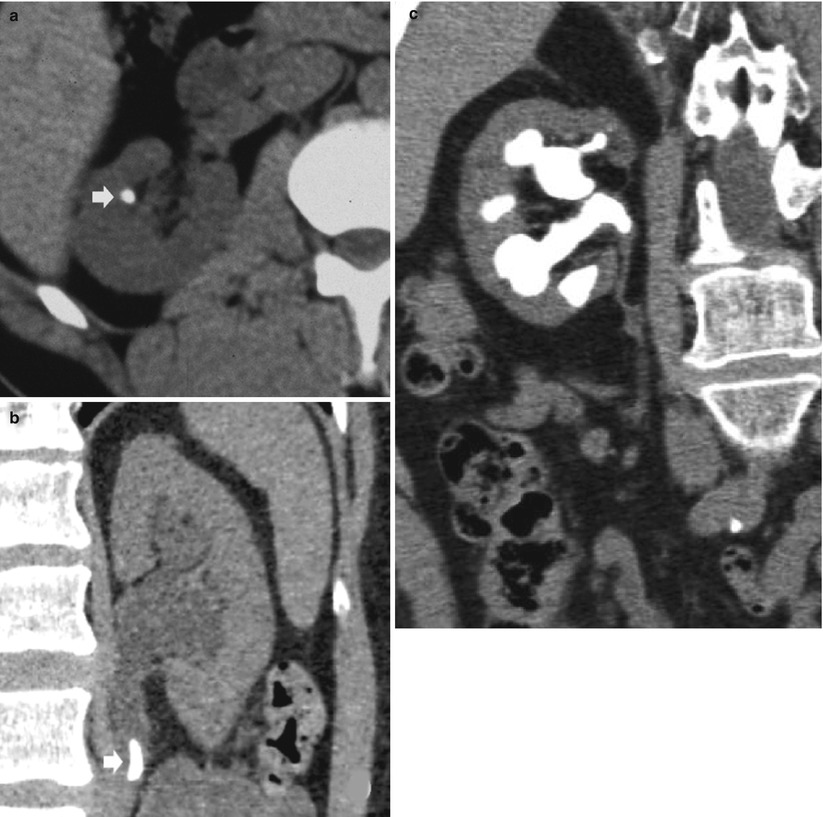
Fig. 8
(a–c) Unenhanced CT. Calcifications due to renal or urinary stones. (a) Axial plane. Renal stone (arrow). (b, c) Coronal reformations. (b) Urinary stone (arrow). (c) Staghorn renal calculosis
Detect calcifications in the renal parenchyma (Fig. 9) or in a complex renal mass (usually previously detected at US) (Fig. 10).
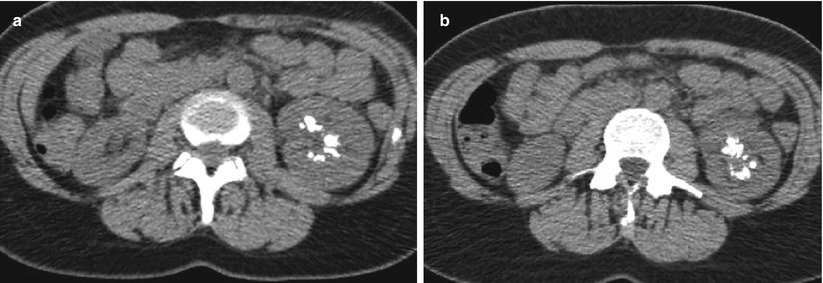
Fig. 9
(a, b) Unenhanced CT. Calcifications in the renal parenchyma. Left medullary nephrocalcinosis with diffuse calcium deposition within the renal medulla of the left kidney
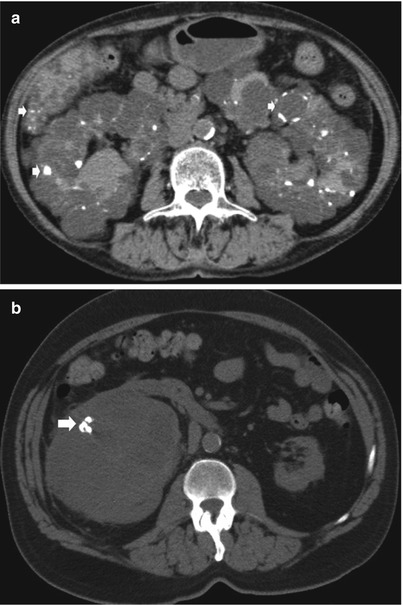
Fig. 10
(a, b) Unenhanced CT. Calcific density. (a) Diffuse pericystic calcifications (arrows) in a polycystic adult kidney involving also the liver (arrow). (b) Intratumoral calcifications in a solid clear-cell-type renal carcinoma (arrow)
Detect hemorrhage in the renal and perirenal collections (Fig. 11a, b) or in solid renal masses (Fig. 11c).
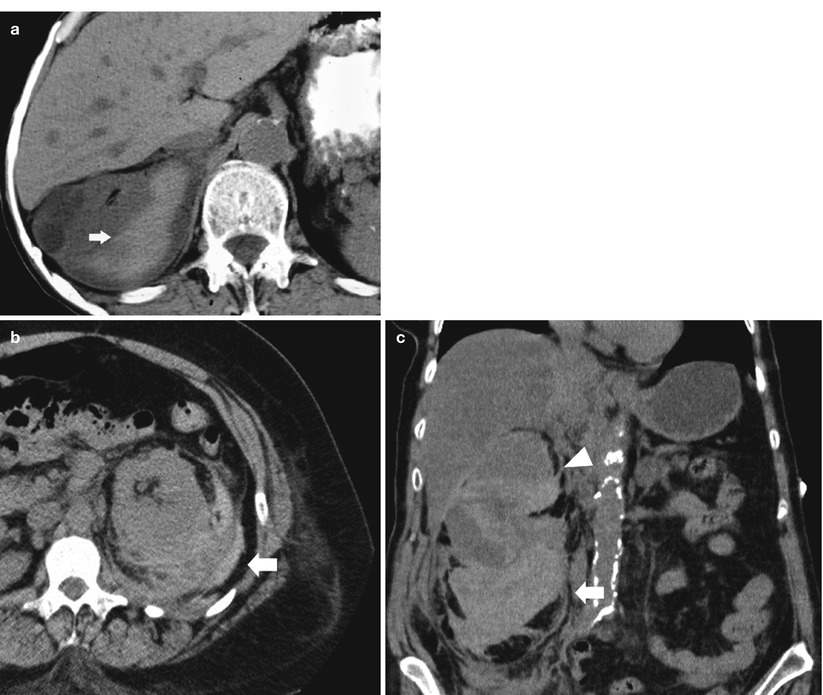
Fig. 11
(a–c) Unenhanced CT. Hyperdensity from hemorrhage. (a) Perirenal hyperdense hemorrhagic collection (arrow) due to renal parenchyma laceration following motorbike accident. (b) Perirenal and renal hematoma (arrow) in a patient who underwent renal biopsy. (c) Perirenal and renal hematoma (arrow) from a hemorrhagic renal cyst (arrowhead)
Detect the macroscopic fat component in a solid renal mass (Fig. 12a).
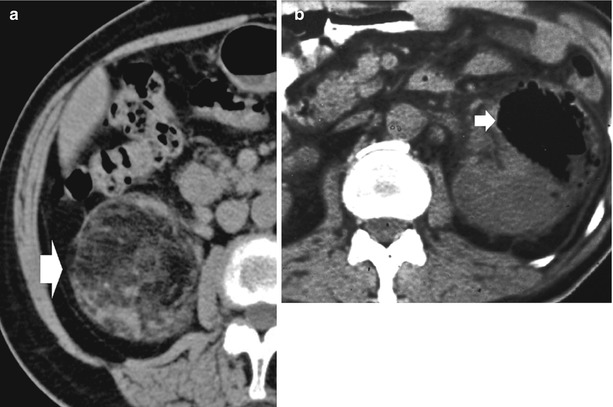
Fig. 12
(a, b) Unenhanced CT, fat and air component. (a) Macroscopic fat component in a renal angiomyolipoma (arrow). (b) Intrarenal air component (arrow) due to emphysematous pyelonephritis in a diabetic patient
Scan patients with acute or chronic renal failure.
Detect air (Fig. 12b) (e.g., in emphysematous pyelonephritis).
Moreover, unenhanced CT scan of the kidneys should be part of every protocol for the evaluation of a suspected renal mass. It provides a baseline from which to measure the enhancement within the lesion after the administration of intravenous contrast material and provides the baseline attenuation value of renal masses (Sheth et al. 2001).
Renal Colic (Acute Flank Pain)
Flank pain is a common complaint of patients presenting to emergency departments. The most common cause of persistent flank pain of sudden onset is acute urolithiasis. Acute urolithiasis is the presence of a stone in the ureter, resulting in partial or complete obstruction. The principal indication for unenhanced CT is the detection of renal stones within the urinary tract in patients with renal colic. Unenhanced spiral or multidetector-row CT is now considered the reference imaging techniques for urolithiasis. In contrast to standard radiography, excretory urography, ultrasonography, and nephrotomography, CT enables to accurately assess location, size, and chemical composition of urinary calculi and allows the differentiation between urinary calculi and other pathologic processes, such as blood clots and tumors (Boll et al. 2009). Unenhanced CT is more effective than intravenous urography (IVU) – now replaced by MDCT urography – in precisely identifying ureteric stones and is equally effective as IVU in the determination of the presence or absence of ureteric obstruction (Worster et al. 2002). Table 2 shows the value of the technical parameters for unenhanced CT for renal colic. The most important factors for the clinical care of patients with urolithiasis are the location, size, and chemical composition of calculi, especially, if extracorporeal shock wave lithotripsy is considered. Size and location of the urinary stones and the anatomy of the urinary tract are of great importance to ensure smooth passage of the fragmented calculi, so a low-dose technique may be applied for this indication.
Table 2
Low- and ultralow-dose unenhanced CT protocol
CT systems | 1 slice | 4 slices | 16 slices | 64 slices |
|---|---|---|---|---|
Peak voltage (kVp) | 120 | 120 | 120 | 120 |
Exposurea | 160 | 70 | 70 | 80 |
30–40b | 30–40b | 30–40b | ||
Collimationc | 3 | 4 × 1 | 16 × 0.75 | 64 × 0.5 |
32 × 0.1 | ||||
Table feed per rotation (mm/rotation) | 5 | 5 | 24 | 32 |
Gantry rotation time (s/rotation) | 0.8 | 0.5 | 0.5 | 0.3 |
Helical pitchd, e | 1.4 | 1.25 | 1–1.4 | 0.9 |
Reconstruction interval (mm) | 3 | 1 | 1 | 0.5–1 |
Reconstruction section thicknessf (mm) | 3 | 3 | 2 |
Unenhanced CT shows direct and indirect findings of colic pain due to stone. The direct finding is the visualization of the calculus itself. Regardless of composition, almost all renal stones are detected at unenhanced CT because the attenuation of stones is higher than that of surrounding tissue, even though the attenuation of uric stones is lower than the attenuation of calcium stones (Taourel et al. 2008). Dual-energy MDCT may simultaneously acquire low- and high-energy attenuation profiles, allowing the development and implementation of pixel-by-pixel postprocessing algorithms. Renal stone characterization with spectral analysis consisting in the assessment of tissue-specific attenuation values at distinct X-ray voltages is now possible by dual-energy MDCT (Boll et al. 2009). Multiplanar reconstruction is indicated in the study of the entire ureter course to identify the exact site of the calcification. Moreover, it allows the urologists to perform an evaluation similar to that obtained by urography. Indirect signs include hydronephrosis (Fig. 8b) and ureteral dilatation (frequency 65–90 %), perinephric and periureteral stranding (36–82 %), rim sign around the ureter (frequency 50–77 %), renal enlargement (frequency 36–71 %), renal sinus fat blurring, and reduced attenuation (>5 HU) of the renal parenchyma (Niall et al. 1999; Sourtzis et al. 1999; Türkbey et al. 2010). However, the reduced attenuation of the renal parenchyma is not specific for the renal colic since it may be caused also by interstitial edema in acute pyelonephritis and by venous congestion in renal vein thrombosis.
Another important task of unenhanced CT is the differentiation of renal colic from other causes of acute flank pain including renal hemorrhage (bleeding from an underlying renal mass, vascular abnormality or renal ischemia, anticoagulation or blood disorders – Fig. 11), renal infections, large renal tumors, diverticulitis or appendicitis, pelvic masses, bowel obstruction, and aortic aneurysm. Most of these pathologic entities may be characterized by unenhanced CT. The addition of intravenous contrast agent can improve the diagnostic skills and prove the diagnosis.
Since the radiation exposure from standard radiography is 0.5–0.9 mSv, from IVU is 1.33–3.5 mSv, and from regular dose CT is 4.3–16.1 mSv, the employment of low-dose unenhanced CT is advocated. With the most recent low-dose CT protocols (Table 2), it is possible to achieve a dose of 0.97–1.35 mSv (Knopfle et al. 2003), while with ultralow-dose CT (20 mAs) a dose of 0.5–0.7 mSv can be obtained (Kluner et al. 2006). Low-dose CT achieves sensitivities and specificities close to those of standard-dose CT in assessing the diagnosis of renal colic, depicting ureteral calculi > 3 mm in patients with a BMI <30, and correctly identifying alternative diagnoses (Poletti et al. 2007). Additional dose reduction may be obtained using iterative reconstruction without affecting image quality and diagnostic confidence (Kulkarni et al. 2012).
1.3.3 Contrast-Enhanced CT
Table 3 shows the value of the technical parameters suggested in contrast-enhanced CT for renal parenchyma examination. After contrast material injection, different phases of contrast uptake can be discriminated. Usually, 80–120 mL (350–370 mg/I) of nonionic contrast medium is administered through an 18–20-G catheter in the antecubital vein at 4 mL/s, followed by 30–40 mL of saline solution at the same injection rate.
Table 3
Contrast-enhanced CT protocol for the renal parenchyma
CT systems | 1 slice | 4 slices | 16 slices | 64 slices |
|---|---|---|---|---|
Peak voltage (kVp) | 120 | 120 | 120 | 120 |
Exposurea | 160 | 180 | 200 | 200–250 |
Collimationb | 5 | 4 × 1 | 16 × 0.75 | 64 × 0.5 |
32 × 1 | ||||
Table feed per rotation (mm/rotation) | 5 | 5 | 24 | 32 |
Gantry rotation time (s/rotation) | 0.8 | 0.5 | 0.5 | 0.3 |
Helical pitchc, d | 1.4 | 1.25 | 1–1.4 | 0.9 |
Reconstruction interval (mm) | 5 | 5 | 3 | 0.5–1 |
Contrast-enhanced CT scans are acquired in different contrast-enhancement phases: arterial phase, corticomedullary phase, nephrographic phase, and urographic phase. Their relative onset times depend on methods of contrast medium administration and patient characteristics. Not all phases have to be acquired and it is important to avoid unnecessary acquisitions to reduce the radiation dose. Imaging of kidneys in the various phases depends on sequential arrival in different parts of the renal parenchyma of blood carrying contrast media (Fig. 13). With normal renal function, iodinated intravascular contrast medium is excreted by passive glomerular filtration. The amount of a substance undergoing glomerular excretion is determined by the product of its “freely filterable” serum concentration and glomerular filtration rate (GFR). GFR is straightly related with weight, age, and gender; it decreases in systemic hypotension, renal vasoconstriction, or glomerulonephritis (decreased number of functional nephrons). Imaging phases have to be selected carefully in accordance with clinical indication. The comprehensive evaluation of renal masses by CT requires a dedicated renal CT protocol including unenhanced, arterial, corticomedullary, nephrographic, and excretory phases. As previously said, unenhanced CT scans are used to detect calcifications and allow quantification of tumoral enhancement on the postcontrast scans (Prasad et al. 2008).
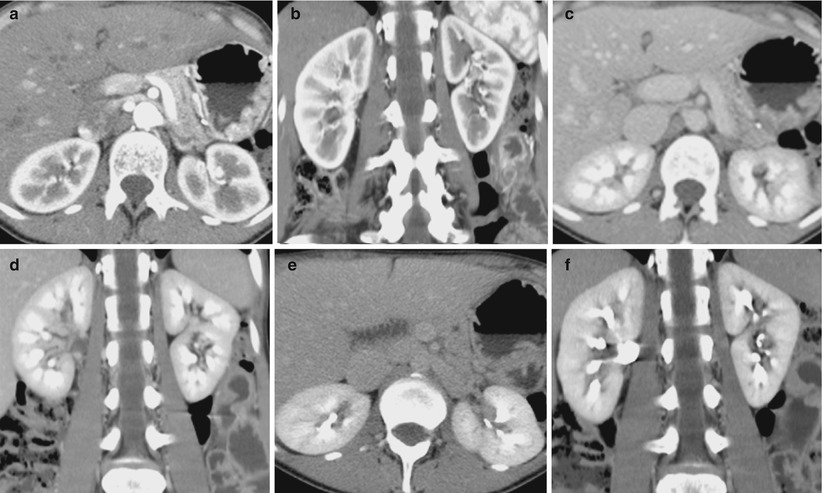
Fig. 13
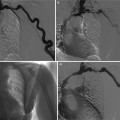
(a–f) Transverse images and coronal reformations of the arterial corticomedullary phase (a, b), the late venous nephrographic phase (c, d), and the delayed excretory phase (e, f), after a split-bolus contrast administration protocol (From Professor Roberto Pozzi Mucelli, University of Verona, Italy)
The arterial CT phase is reached about 15–25 s after intravenous injection of contrast medium (for renal arteriography, a contrast bolus of 3.5 mL/s is desirable). When performing a contrast-enhanced CT of the kidney, it is critical, mainly for the arterial phase, to scan at the peak of contrast enhancement in the renal cortex. Nowadays, this is easily achieved with the “bolus tracking” technique, which has replaced the simple “test bolus” technique. The use of empirical fixed delays (i.e., 25–30 s), with small variations depending upon patient age or body habitus, should be avoided. With state-of-the-art MDCT, the temporal window to perform the acquisition of the examination is very narrow (Bae et al. 2008; Erturk et al. 2008; Kock et al. 2007; Schoellnast et al. 2005; Stacul et al. 2008). Alternatively, a test bolus scan or a bolus tracking program can be applied for optimal start of the arterial scan.
In the arterial phase, renal arterial stenosis or evaluation of stent implantation can be judged, and acute bleeding can be detected or ruled out.
The corticomedullary CT phase (about 25–70 s after i.v. contrast) shows high contrast in the renal cortex (Fig. 13a, b). During the corticomedullary phase, the contrast is located in the capillaries of the renal cortex and peritubular cells, proximal convoluted tubules, and columns of Bertin (Schreyer et al. 2002). The renal cortex becomes clearly distinguishable from the medulla because contrast material fills only the more proximal tubular structures due to greater cortical vascularity. The cortical phase gives a perfect visualization of the cortex (hyperdense) and medulla (hypodense) and, therefore, of the morphology of the kidney. Peak enhancement of the renal vessels during the early corticomedullary phase also provides information on vascular anatomy and patency. Moreover, early opacification of renal veins is also detectable. The optimal delay time for the corticomedullary phase depends on the rate of contrast injection, the amount of contrast material administered, and the patient’s cardiac output (Prasad et al. 2008).
This is the best phase to evaluate the vascularity of a mass. As most renal tumors are hypervascular, this phase is useful in the characterization of renal masses. The corticomedullary phase is also fundamental when evaluating renal arteries (e.g., in patients with hypertension of suspected renovascular origin) and suitable for the depiction of vascular renal anatomy (e.g., aneurysm, arteriovenous malformation, fistula) and the assessment of vessel patency.
The nephrographic (parenchymal) CT phase (80–180 s delay) shows the renal cortex and medulla with equal enhancement due to contrast medium equilibrium between vascular and interstitial compartments entering loops of Henle and collecting tubules. This particular phase may be divided into an early phase and a late phase (Fig. 13c, d), with the latter overlapping the excretory phase. During the nephrographic phase, the renal parenchyma enhances, homogeneously allowing the best opportunity for discrimination between the normal renal medulla and masses. This is the best phase to detect renal masses since all lesions appear hypodense compared to the renal parenchyma. It is also useful for the evaluation of the renal veins and inferior vena cava.
CT examination usually a noncontrast phase followed by the arterial and nephrographic phases. This technique is suggested for the diagnosis of renal tumors, complex renal masses, trauma, and infections. An additional delayed scan in the urographic phase or 3 h after the injection of contrast material may be added to evaluate patients with trauma or infections.
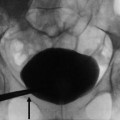
The excretory CT phase (Fig. 13e, f


Related posts:
Stay updated, free articles. Join our Telegram channel
Full access? Get Clinical Tree
