Fig. 1
Normal gallbladder. Axial MSCT contrast-enhanced image obtained during the portal phase shows a normal gallbladder. Its walls are sharply demarcated from the adjacent liver parenchyma and peritoneal fat. Thin homogeneous wall enhancement (arrow) during the arterial or portal phase is a normal finding
2 Staging
2.1 Primary Tumor
The appearance of GB CA on CT depends upon the morphology of the tumor and extent of disease at the time of imaging [8]. GB CA can be divided into five subtypes based on gross morphologic appearance: papillary (best prognosis), nodular, flat, filling, and massive (most common) [7]. Papillary, nodular, and filling tumors share the same imaging feature of an enhancing soft tissue mass protruding into the normally low-density fluid attenuation lumen of the gallbladder (Fig. 2). Flat tumors may present as irregular thickening of the gallbladder wall without a discrete soft tissue mass or nodule (Fig. 3). Detection of wall thickening (>1 cm) with mural irregularity on CT raises the suspicion for malignancy [9]. A large mass that replaces the GB and adjacent liver parenchyma is an imaging feature of the massive type (Figs. 4 and 5). The mass may be iso- to hypoattenuating relative to the liver on the pre-contrast CT examination. The mass attenuation after intravenous contrast increases but may be heterogeneous owing to necrosis.
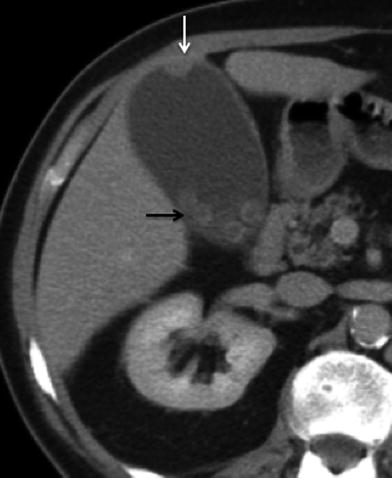
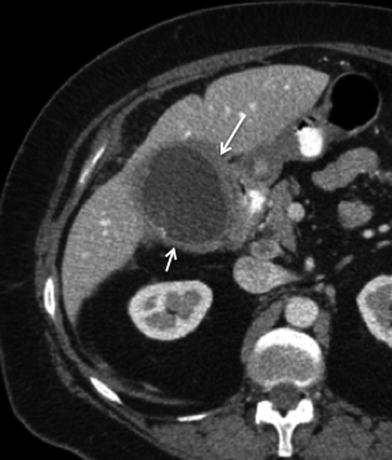
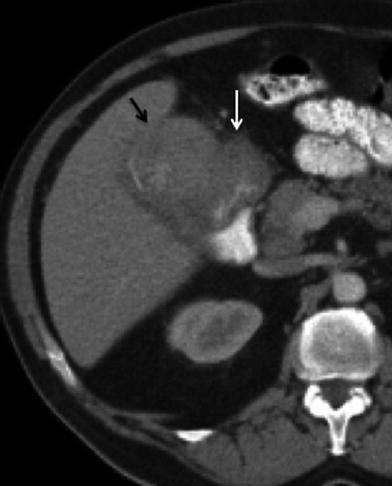
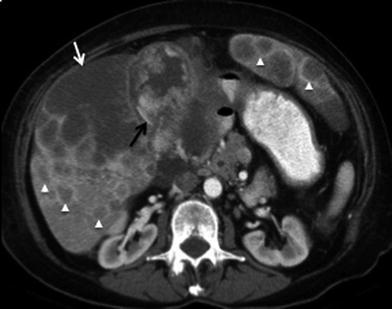
Fig. 2
Papillary gallbladder cancer: 68-year-old male patient with gallbladder cancer incidentally found during evaluation for abdominal pain. Contrast-enhanced MSCT axial image shows a soft tissue mass protruding from the wall (white arrow) into the homogeneous low-attenuation lumen of the gallbladder. Cholelithiasis (black arrow) is also present in this patient
Fig. 3
Flat gallbladder cancer. Axial MSCT contrast-enhanced image of a 72-year-old male patient showing irregular thickening of the gallbladder wall (arrows), representing gallbladder cancer
Fig. 4
Massive gallbladder cancer. 59-year-old female patient presenting with anorexia and weight loss. Contrast-enhanced MSCT axial image shows a large soft tissue mass (black arrow) occupying most of the lumen of the gallbladder. Note is also made for irregular thickening of the proximal duodenum (white arrow), representing neoplastic invasion
Fig. 5
Advanced gallbladder cancer. 60-year-old female patient presenting with jaundice and hepatomegaly. Axial MSCT contrast-enhanced image shows a large heterogeneous mass centered in the gallbladder (black arrow). Associated invasion of the liver with irregular peripheral enhancement and central hypodensity (white arrow), compatible with necrosis. Multiple hypodense masses with peripheral rim enhancement (arrowheads) are appreciated throughout both hepatic lobes, compatible with hematogenous metastases
According to the American Joint Committee on Cancer (AJCC) for GB CA staging criteria, T1 tumor invades the lamina propria of muscle layer. T2 tumor invades the perimuscular connective tissue but does not extend beyond the serosa. T3 tumor perforates the serosa and directly invades the liver (<2 cm) or one other adjacent organ or structure, such as the bile duct, colon, duodenum, or pancreas. T4 tumor invades the liver (>2 cm), the main portal vein or hepatic artery, or multiple (two or more) adjacent organs and structures. Due to spatial resolution limitations, CT is not very useful for T-staging except to discriminate between T3 and T4 tumors. The sensitivity of CT to detect tumor extension is better when there is advanced disease (T4), approaching 100 % [10]. When the stage is T3, the sensitivity decreases to 65–79 % [10]. The addition of multiplanar reconstructions will improve the accuracy of T-staging of GB CA.
2.2 Radial Tumor Growth and Adjacent Organ Invasion
Direct extension to adjacent organs is the most common method of tumor spread. The gallbladder wall has a thin single muscle layer and a narrow lamina propria. The violation of the thin layers of the GB wall will result in liver extension, and lymphatic and vascular spread of disease. The liver is the organ most commonly involved by direct extension (65 % of cases), and tumors of the fundus and body of the gallbladder have a propensity to invade segments IVb and V at an early stage [4, 11, 12]. Hepatic invasion is demonstrated on contrast-enhanced CT as an irregular soft tissue mass disrupting the adjacent liver parenchyma, usually in segments IVb and V (Figs. 5, 6). Radical surgical resection (usually including excision of segments V and IVb) has been shown to improve survival in patients whose tumors are locally confined to the cystic fossa and adjacent hepatic parenchyma [7, 10].
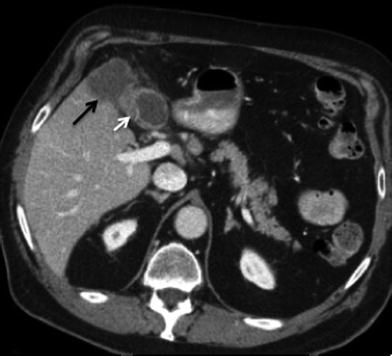
Fig. 6
Invasive gallbladder cancer. Contrast-enhanced MSCT axial image showing irregular gallbladder wall thickening (white arrow), with more than 2 cm of invasion into segment V (black arrow) of the right liver lobe (T4 tumor). Tumor in the gallbladder fundus has propensity for early invasion of segments IVb and V
The criterion for tumor extension to adjacent organs, bile ducts, or vessels is the disruption of fat planes between the tumor and the adjacent structures [13, 14] (Fig. 7). Anatomic structures in the hepatic hilum and in close proximity to the gallbladder can also be involved by direct tumor extension: the bile duct and the portal vein are commonly involved by direct tumor extension of GB CA [15]. Biliary dilatation secondary to GB CA can be seen by CT. This may be a result of tumor spread along the cystic duct or extrinsic mass effect from tumor infiltration or enlarged nodes. The colon and duodenum (Fig. 8) are also frequently involved, followed by the pancreas [15]. Extension into the hepatic flexure of the colon is shown on CT as infiltration of the normal low-density pericolonic fat by soft tissue with obliteration of vessels. Wall thickening with possible luminal narrowing and eventual obstruction may also occur (Fig. 9).
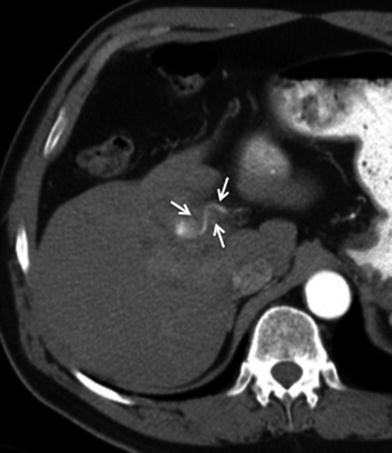
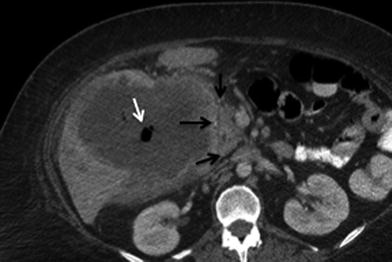
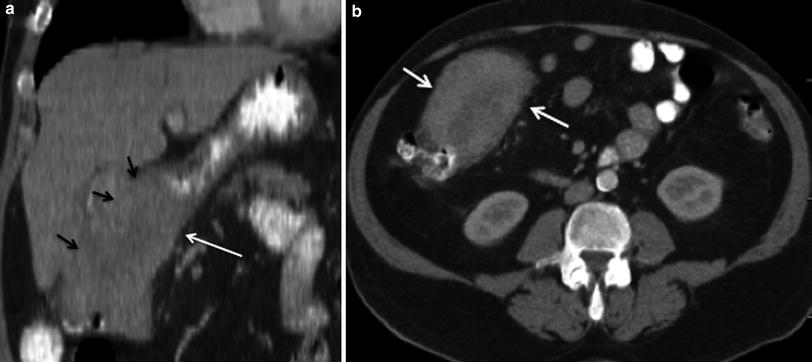
Fig. 7
Vascular involvement of tumor. 68-year-old male with gallbladder cancer. Axial MSCT image in arterial phase shows soft tissue infiltration and encasement (arrows) of the hepatic artery at the hepatic hilum
Fig. 8
Adjacent organ invasion. 44-year-old female patient with gallbladder cancer. Contrast-enhanced MSCT axial image demonstrates a large mass invading the second portion of the duodenum (black arrow). It shows few air bubbles (white arrow) that correlate with fistulous communication
Fig. 9
Adjacent organ invasion. 59-year-old female patient with advanced gallbladder cancer. a Contrast-enhanced MSCT coronal image demonstrates a large mass (black arrows) invading the hepatic flexure (white arrow). b Contrast-enhanced MSCT axial image shows irregular thickening and luminal narrowing (arrows) of the colonic hepatic flexure
2.3 Nodal Disease
The assessment for nodal disease is important for accurate staging. The prevalence of lymphatic metastases in GB CA exceeds 70 % in some series [4, 13]. Lymphatic spread in GB CA occurs first to the cystic, pericholedochal, periportal, hepatic artery, and hepatoduodenal nodes (N1 nodes) (Figs. 10, 11). Disease can then spread to the celiac, superior mesenteric, and peripancreatic nodes, which comprise the N2 nodes (Fig. 12). Attention to the presence of suspicious interaortocaval, left para-aortic, and retropancreatic nodes is important because they may be regarded as distant nodal metastases. The CT detection of metastatic adenopathy will assist in the staging. Detection of nodal involvement on CT is based on size and internal imaging features of the nodes. Nodes >1 cm in short axis are likely malignant [15]. Nodes with a low-attenuation center indicating central necrosis are also likely to harbor metastatic disease [15]. Using the CT criteria for nodes larger than 1 cm, for the presence of malignancy, the sensitivity of CT in the detection of positive nodes in gallbladder cancer is 36 and 47 % for N1 and N2 nodes, respectively [16].
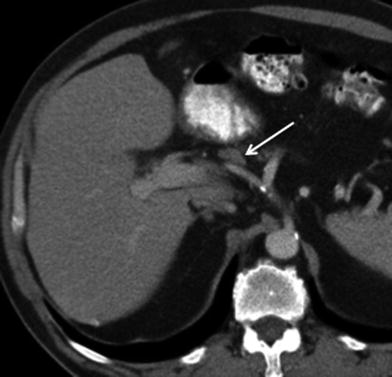
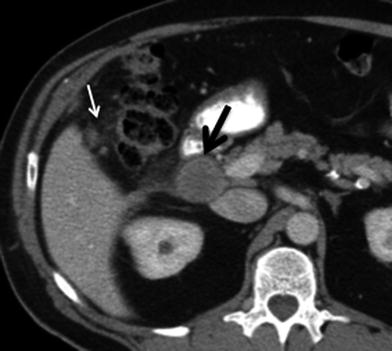
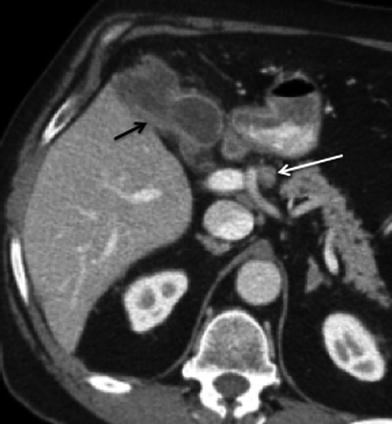
Fig. 10
Lymphatic spread of gallbladder cancer. Contrast-enhanced MSCT axial image shows a lymph node in the hepatic artery nodal station (arrow), consistent with N1 node. Although this node does not exceed 1 cm in short axis diameter, because it is larger than the adjacent nodes and is located along the lymphatic path of spread of gallbladder carcinoma, it is considered suspicious for malignancy
Fig. 11
Lymphatic spread of gallbladder cancer. Contrast-enhanced MSCT axial image shows an enlarged lymph node in the portocaval nodal station (black arrow), consistent with N1 node. Nodes larger than 1 cm in short axis or with central low density (necrosis) are more likely metastatic. There is also nodularity and increased attenuation of the mesocolon adjacent to the hepatic flexure (white arrow), representing peritoneal infiltration
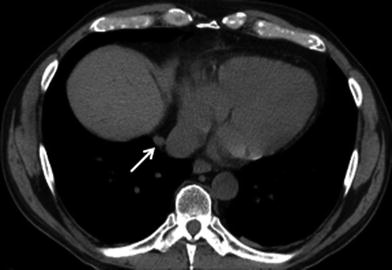
Fig. 12
Lymphatic spread of gallbladder cancer. Axial MSCT contrast-enhanced image shows irregular thickening (black arrow) of the gallbladder wall, compatible with tumor. There is also an enlarged lymph node in the celiac nodal station (white arrow), consistent with a metastatic N2 node
2.4 Metastatic Disease
Hematogenous metastases of GB CA occur most commonly to the liver. They appear as multifocal areas of low attenuation in relation to the adjacent hepatic parenchyma, usually with a peripheral rim of contrast enhancement (Fig. 13). Metastases to other organs, such as the lungs, osseous structures, kidneys, adrenals, and brain, occur less frequently.
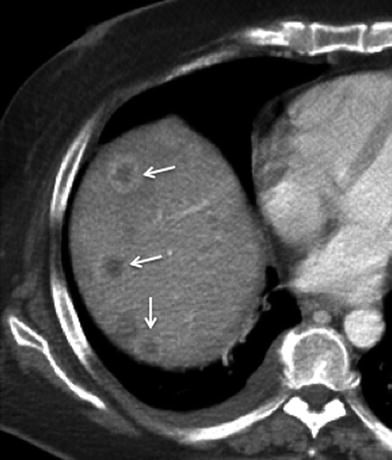
Fig. 13
Hematogenous metastasis in gallbladder cancer; 44-year-old female with advanced gallbladder carcinoma. Contrast-enhanced MSCT axial image shows several masses with central low-attenuation and peripheral rim enhancement (arrows) in the right hepatic lobe, representing hematogenous metastases
GB CA spread into the peritoneum is also common. The imaging features of peritoneal deposits are discrete nodules and fat stranding of the low-attenuation peritoneal fat (Figs. 11, 14). The detection of peritoneal disease may be challenging [11].
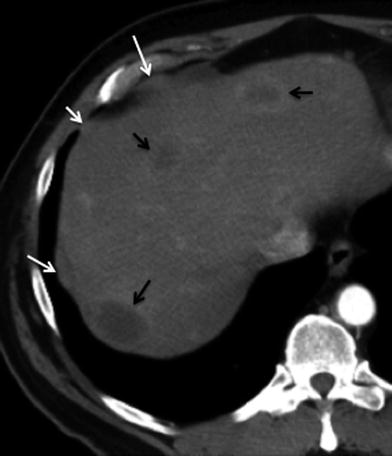
Fig. 14
Peritoneal metastasis; 70-year-old male with advanced gallbladder carcinoma. Axial contrast-enhanced MSCT image shows few areas of nodular soft tissue thickening in the perihepatic sub diaphragmatic wall (white arrows), consistent with metastatic deposits. Multiple rim-enhancing liver lesions (black arrows) are also present, representing hematogenous metastases
Resectability of GB CA depends on multiple factors. In the assessment of resectability, MSCT has been found to be an accurate technique to determine resectability of GB CA when factors such as vascular invasion, adjacent organ invasion, and metastases are considered [17].
2.5 Differential Diagnosis
There are several conditions that may mimic GB CA on imaging studies, such as acute and chronic cholecystitis, adenomyomatosis, and polyps. Gallstones and GB CA may coexist, making differentiation more problematic (Fig. 15). Enhancement of the liver parenchyma adjacent to the cystic fossa has been reported in acute cholecystitis and should not be misjudged as a focal hepatic lesion. Also, tumors arising in the neck of the gallbladder not uncommonly may cause obstruction of the cystic duct and present clinically as acute cholecystitis.
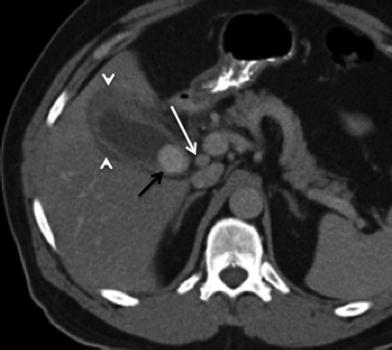
Fig. 15
Cholelithiasis and gallbladder cancer; 65-year-old female with gallbladder carcinoma presenting with chronic right upper quadrant pain. Contrast-enhanced MSCT axial image shows a large intraluminal calcified stone (black arrow), compatible with cholelithiasis. Irregular thickening (>1 cm) of the gallbladder wall seen as well, consistent with tumor. Associated hypodensity in the adjacent liver parenchyma (arrowhead), representing liver invasion (T3, <2 cm extension). A lymph node in the portocaval nodal station (white arrow), representing metastatic N1 node
Imaging features of adenomyomatosis on CT include focal or diffuse cystic-appearing thickening of the gallbladder wall (Fig. 16) [18]. Although it is not possible to reliably differentiate GB CA from this condition in all cases, the presence of cystic-appearing spaces in the thickened gallbladder wall allows the diagnosis of adenomyomatosis to be made with reasonable confidence [18].
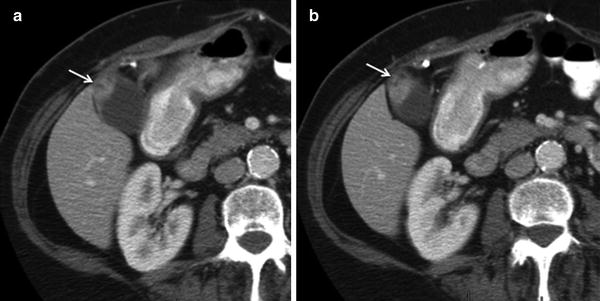
Fig. 16
Gallbladder adenomyomatosis. Sequential contrast-enhanced axial MSCT images show focal thickening with cystic spaces in the gallbladder fundus (arrows). Note the thin homogeneous enhancement of the remaining gallbladder wall
Cholesterol polyps may be single or multiple and represent approximately 50 % of all polypoid lesions in the gallbladder; they have no malignant potential [19]. Cholesterol polyps may be rarely apparent on contrast-enhanced scans due to vascularity within the polyp (Fig. 17).
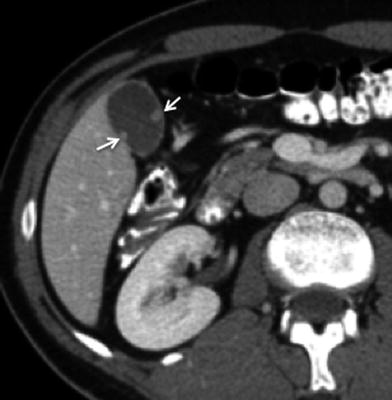
Fig. 17
Gallbladder polyps. Axial contrast-enhanced MSCT image shows two subcentimeter nodular-enhancing lesions in the gallbladder wall (arrows), protruding into the lumen. Note the thin homogeneous enhancement of the remaining gallbladder wall
There are other benign tumors that are reported in the literature that may involve the gallbladder and biliary tract. For example, adenoma of the gallbladder is found in approximately 0.5 % of cholecystectomy specimens. Only a small proportion of gallbladder adenomas progress to carcinomas. With contrast-enhanced CT, gallbladder adenoma presents as an enhancing intraluminal soft tissue mass or nodule that may be iso- or hypoattenuating relative to the liver [12].
2.6 Treatment Response and Recurrence
CT is used to monitor patients following treatment for GB CA. After therapy, careful assessment should be made not only for evidence of residual disease, but also for any evidence of complications from therapy. A nonenhancing fluid collection may be seen at the resection margin after surgery (Fig. 18). This fluid collection usually decreases in size after 3–6 months but may never completely disappear. If a catheter is left in the surgical bed, small pockets of air may be present and not necessarily imply infection. Increasing amounts of fluid and gas, development of a thick rim of peripheral enhancement, and progressive stranding of the adjacent fat are signs of abscess formation (Fig. 19). Differentiating an abscess from a postoperative seroma or hematoma requires correlation with clinical suspicion and can be challenging during the perioperative period.
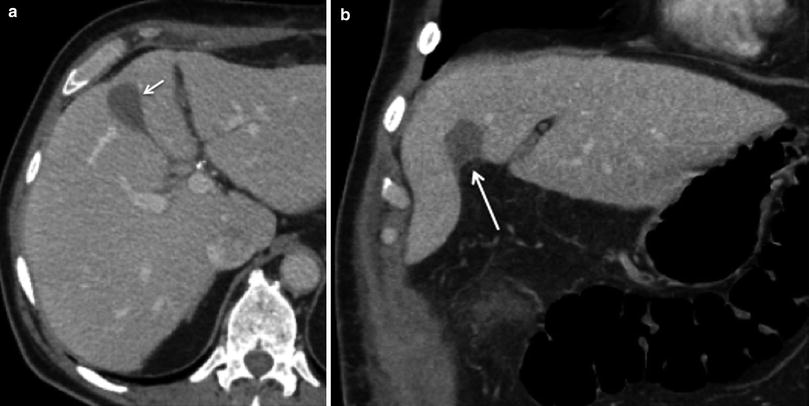
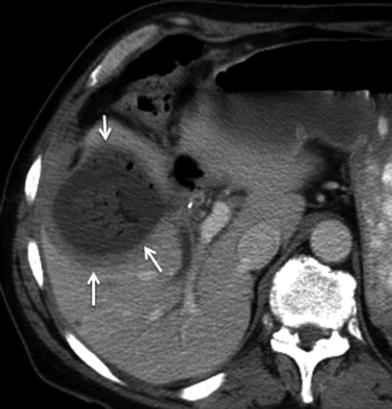
Fig. 18
Postoperative seroma following surgery for gallbladder cancer. 68-year-old male’s status postsurgery for gallbladder cancer on routine follow-up. a Axial and b coronal images from contrast-enhanced MSCT reveals a small fluid collection without peripheral enhancement in the surgical bed (arrows), compatible with seroma. Close follow-up study is required to document involution of the fluid collection, as well as correlation with clinical signs of infection, such as fever and leukocytosis, to exclude the possibility of abscess
Fig. 19
Postoperative abscess following surgery for gallbladder cancer. 67-year-old male’s status postsurgery for gallbladder cancer with fever and leukocytosis. Axial contrast-enhanced MSCT image reveals a fluid collection with a thick rim of peripheral enhancement and internal gas bubbles in the surgical bed (arrows), compatible with abscess
Normal postsurgical findings such as infiltration of the peritoneal fat in the operative bed and focal areas of fat necrosis should not be misinterpreted as recurrent disease. The degree of soft tissue attenuation that increases in size 3–6 months following surgery is concerning for peritoneal metastasis and needs to be followed closely on subsequent imaging studies (Fig. 20). Careful attention to the detection of soft tissue nodules at the resection margin in the liver, at the tract of previous drainage catheters, at the laparoscopic ports tracts, and at the abdominal wall wound is essential for the detection of residual disease and peritoneal metastasis (Fig. 21) [13].
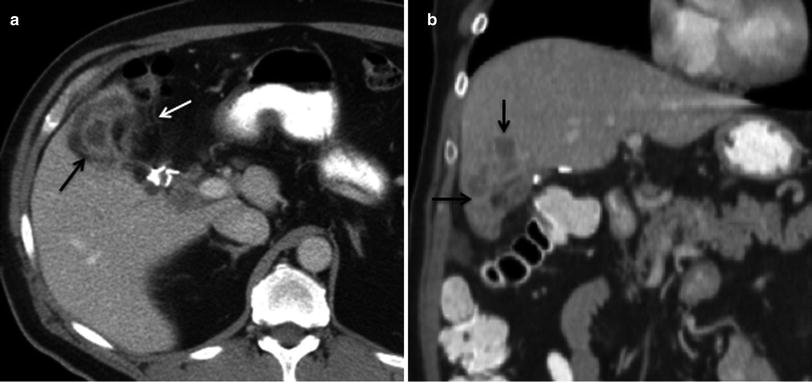
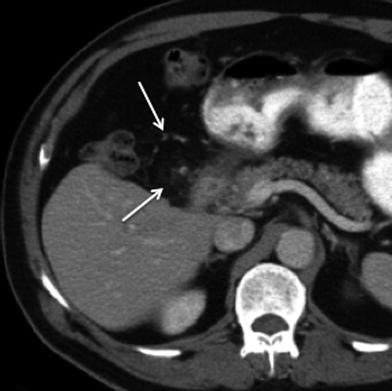
Fig. 20
Recurrent disease after surgery for gallbladder cancer. a Axial contrast-enhanced MSCT image shows heterogeneous enhancement in the surgical bed (black arrow), with associated fat stranding and nodular thickening of the adjacent peritoneal fat (white arrow), consistent with tumor recurrence. b Coronal contrast-enhanced MSCT image reveals invasion of segment V at the resection margin of the liver (black arrows)
Fig. 21
Recurrent gallbladder cancer; 68-year-old male with surgery for gallbladder cancer 1 year prior to the study. Axial contrast-enhanced MSCT image demonstrates subtle nodularity and increased fat attenuation near the gallbladder fossa and in the gastroepiploic region (white arrow), worrisome for peritoneal neoplastic infiltration
3 Intrahepatic Cholangiocarcinoma
3.1 Epidemiology
Intrahepatic cholangiocarcinoma (ICC), also called peripheral cholangiocellular carcinoma, is a primary malignant tumor arising from intrahepatic bile duct epithelium. It is thought to arise from the secondary bile duct or proximal branches of the intrahepatic bile ducts. ICC accounts for 8 % of all cholangiocarcinomas [20]. The estimated annual incidence in the United States is 1 per 100,000 persons. ICC is the second most common intrahepatic primary liver cancer (7–10 %), with HCC being first [21]. Mixed tumors of cholangiocarcinoma and hepatocellular carcinoma components may be seen in approximately 2–6 % of primary malignant liver tumors, called combined HCC-ICC (cHCC-ICC) [22]. ICC occurs most commonly in the 6th and 7th decades with male-to-female predominance of 3:2. The incidence and age-adjusted mortality have increased in the last 3 decades [23]. The 5-year survival is <10 % and approaches 0 % when there are intrahepatic metastases. Surgery offers the best outcome [24]. The risk factors for ICC are shared with other cholangiocarcinomas [25].
3.2 Clinical Presentation
The clinical symptoms of ICC are nonspecific. Patients can present with general malaise and discomfort, weight loss, abdominal pain, or nausea [26]. In contrast to ECC, jaundice due to biliary obstruction is not a common finding, and ICC typically presents with signs and symptoms associated with a large mass in the liver. On physical examination, an enlarged liver may be detected. In contrast to patients with HCC, patients do not present with ascites, cirrhosis, or portal hypertension. Some cases present with an incidental liver mass, and imaging studies or endoscopic evaluation are performed searching for a possible primary GI cancer.
Laboratory abnormalities include elevation of CA 19-9 and carcinoembryonic antigen (CEA); this is also seen in ECC [26]. The bilirubin level is usually normal. α-Fetoprotein (AFP), frequently elevated in patients with HCC, is usually normal in ICC. In combined tumors of HCC-ICC pathology, there will be elevated α-fetoprotein and modestly elevated CA19-9 versus elevation of AFP alone for HCC and CA19-9 for ICC [22].
4 Imaging
4.1 Imaging Protocol and Technique
Computed tomography plays a key role in the clinical evaluation of patients with ICC. The availability and short scan duration makes CT the main diagnostic tool in oncologic imaging, including patients with ICC. The CT protocol for a patient with a liver mass is a multiphasic examination. The liver protocol consists of pre-contrast and postcontrast images obtained during the late arterial, portal venous, and excretory phases of contrast administration. 150 ml of intravenous iodinated contrast is injected at a rate of 5 ml/s. SmartPrep® (GE Healthcare, Milwaukee) is used for contrast bolus tracking, monitoring the aorta at the level of the celiac artery until 100 Hounsfield units is obtained; this takes roughly 20 s. Dynamic imaging through the liver in the late arterial phase is then obtained at 13 s postthreshold. Portal venous phase imaging is then obtained after 60 s, and delayed images through the liver are obtained at 90 s. The images are obtained at 5 mm and reconstructed at 2.5 mm for each phase of contrast administration.
4.2 Imaging Findings
There are three macroscopic presentations of ICC described by the Liver Cancer Study Group: mass-forming (MF), periductal-infiltrating (PD), and intraductal (ID) types [27]. A fourth group has been created to combine tumors that exhibit mixed characteristics, for example, MF + PD. The MF and the combination types are the most common (70 % of cases).
4.3 Mass-Forming Type
On the pre-contrast images, ICC presents as a large, hypoattenuating mass with lobular or irregular margins (Fig. 22a). During the late arterial phase of contrast administration, commonly there is minimal to no peripheral enhancement of the tumor (Fig. 22b). On the portal venous phase, the enhancement will continue in a centripetal fashion and continue to progress on the delayed and excretory phases of contrast (Fig. 22c). The delayed enhancement in ICC is due to the presence of a dense fibrous stroma, which retains contrast over time [28] (Fig. 22d). This enhancement pattern is distinct from other common liver malignancies such as, HCC or hypervascular metastases (e.g., neuroendocrine carcinoma). However, ICC can also present with arterial enhancement similar to other hypervascular tumors of the liver (Fig. 23). Associated findings include peripheral ill-defined calcification due to mucin production in 18 % and capsular retraction due to desmoplastic response (Fig. 24) [29, 30]. The differential diagnosis includes metastasis from the GI tract. Features that will suggest the diagnosis of ICC include a large single mass, the absence of a primary GI tumor, and the absence of multiple nodules.
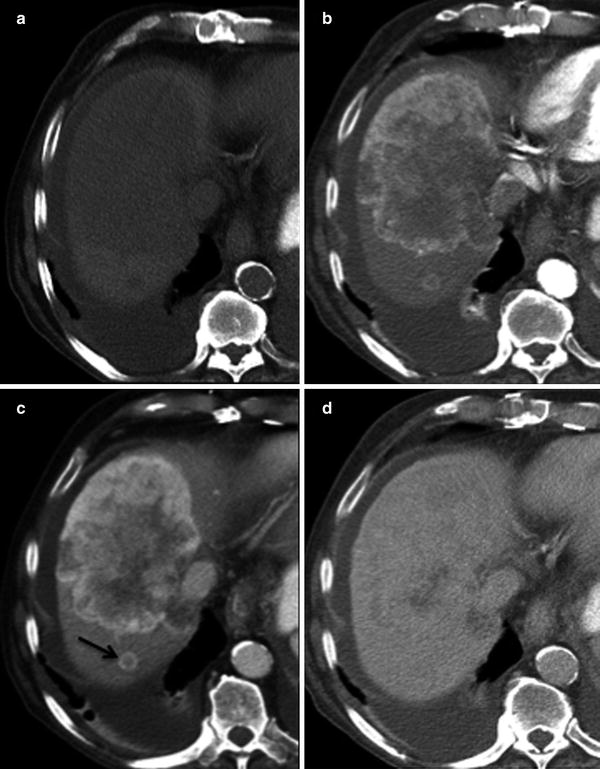
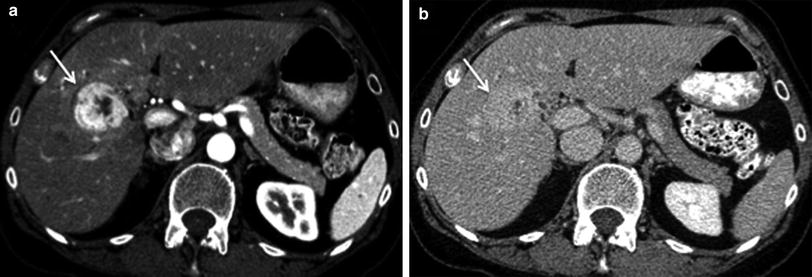
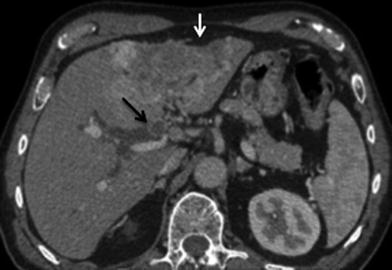
Fig. 22
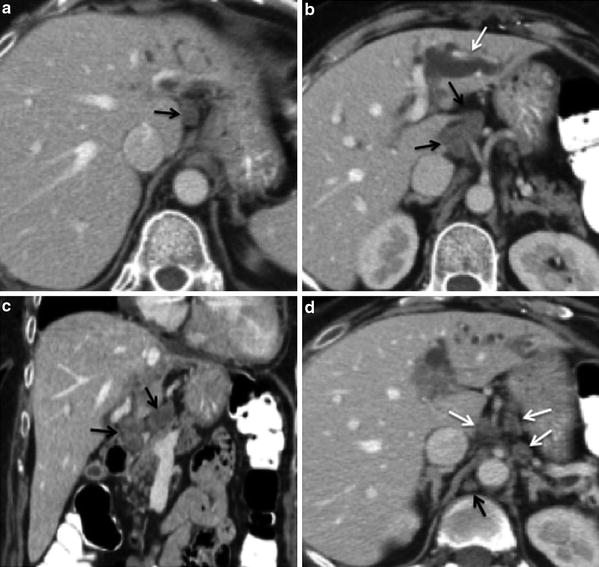
ICC enhancement pattern; 81-year-old male presenting with weight loss. a Pre-contrast MSCT image shows hypodense mass involving segments VII and VIII of the right liver lobe. b Postcontrast MSCT image in late arterial phase shows hypodense center with only mild peripheral enhancement. c Postcontrast MSCT image in portal venous phase shows continuous centripetal contrast enhancement. A satellite smaller peripheral enhancing lesion (arrow) is also appreciated posteriorly. d Postcontrast MSCT image in delayed phase shows almost complete opacification with contrast of the tumor. Incidental right pleural effusion also visualized
Fig. 23
Enhancement pattern; 62-year-old female with ICC. a Postcontrast MSCT image shows mass in segment V of the right liver lobe (arrow) with avid contrast enhancement in late arterial phase. b Postcontrast MSCT image in delayed phase shows progressive contrast enhancement with almost complete filling (arrow) of the tumor. ICC may present with arterial enhancement similar to other hypervascular liver tumors
Fig. 24
Capsular retraction; 72-year-old male presenting with weakness and anorexia. Axial portal venous phase MSCT image shows large, heterogeneous enhancing space-occupying lesion in segment II and III of the left liver lobe with associated capsular retraction (white arrow), due to desmoplastic reaction. Heterogeneous soft tissue in the proximal right hepatic duct (black arrow) with associated proximal ductal dilation represents ductal invasion of tumor
4.4 Periductal-Infiltrating
The PD type accounts for approximately 15–20 % of cases [27, 31]. This tumor pattern presents as a proximal ductal dilation without a discrete mass or as periductal soft tissue in the noncontrast CT. On the arterial phase, minimal ductal wall or periductal soft tissue enhancement is observed [32]. In the portal venous phase, more intense enhancement is seen in the ductal wall and periductal soft tissues [27]. These tumors have a higher incidence of satellite nodules and also of nodal metastases. The differential diagnosis of this type includes benign strictures. The presence of portal vein obliteration and lymph node involvement is more suggestive of a malignant etiology.
4.5 Intraductal Type
The ID type of ICC accounts for approximately 5 % of cases [27, 31]. This pattern of ICC is considered similar to the intraductal papillary mucinous neoplasm (IPMN) of the pancreas and has the best prognosis [33]. On noncontrast CT, a dilated duct with or without a mass >1 cm can be seen. On the arterial and portal venous phases, a hypoattenuating mass or a hyperattenuating duct may be seen [34]. The differential diagnosis of a high-attenuation ID mass includes stone, tumor such as HCC or metastatic disease, or stricture with debris. ID HCC will usually have the typical pattern of HCC enhancement, being slightly less hypoattenuating on the noncontrast images and showing marked enhancement on arterial phase and washout on the portal venous images [35].
4.6 Combined HCC-ICC
Mixed HCC and ICC tumors (cHCC-ICC) can present as large, solitary tumors with irregular margins [22]. The contrast enhancement pattern is dependent on the percentage of each tumor. An HCC pattern will present with intense arterial enhancement. It may be very difficult to predict prospectively whether the mass represents HCC or ICC. On noncontrast CT there is a large hypoattenuating tumor. During the arterial phase, the HCC portion will enhance avidly, while the ICC portion may stay hypodense. At the portal venous phase, the enhancing portion representing HCC will wash out and the portion representing ICC continues to enhance. On the delayed phase, the HCC component is hypoattenuating, and the ICC portion is homogeneously enhancing (Fig. 25).
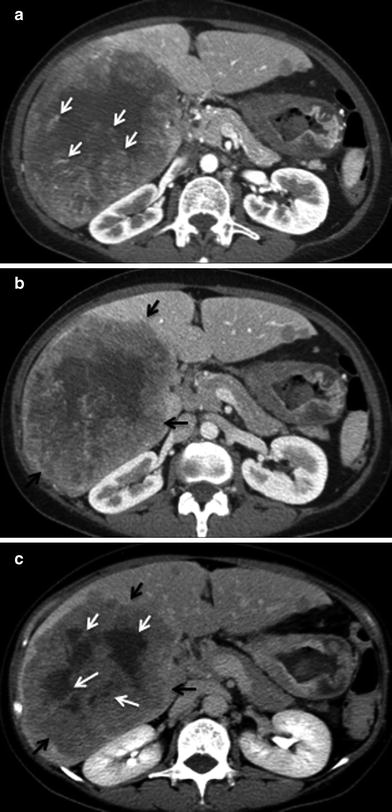
Fig. 25
Enhancement pattern; 65-year-old male with cHCC-ICC. a Postcontrast MSCT image in late arterial phase shows few central focal areas of increased vascularity (white arrows) and minimal peripheral enhancement. b Postcontrast MSCT image in portal venous phase shows increased peripheral contrast enhancement (black arrows). c Postcontrast MSCT image in delayed phase shows washout of the previously enhancing central foci (white arrows) and peripheral contrast enhancement of the tumor (black arrow)
5 Staging
5.1 Primary Tumor
Mass-forming ICC and cHCC-ICC are staged according to the AJCC hepatocellular carcinoma system [21, 36]. The discriminating factors for T-staging are tumor size, satellite nodules, vascular invasion, and extra-capsular extension. Any solitary tumor without vascular invasion, regardless of size, is classified as T1. A T2 tumor is defined as solitary tumors with vascular invasion or multiple tumors none larger than 5 cm. T3 tumors are classified as multiple masses larger than 5 cm or with major vascular invasion of a major branch of the portal or hepatic veins. A T4 lesion is defined as a tumor that demonstrates direct invasion to adjacent organs other than the GB or in the setting of perforation to the visceral peritoneum [37].
Similar to HCC, ICC has a propensity to encase and even invade branches of portal veins and hepatic arteries through direct extension [34] (Figs. 26, 27). There can be wedge-shaped enhancement of the liver surrounding the tumor due to arterial supply as a result of portal vein encasement [35] (Fig. 28). Biliary ductal dilation and gallbladder involvement due to direct extension of the tumor into the gallbladder fossa can also be seen (Figs. 29, 30).
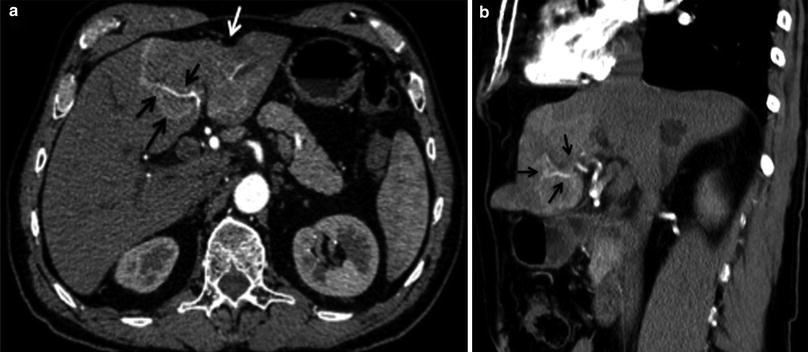
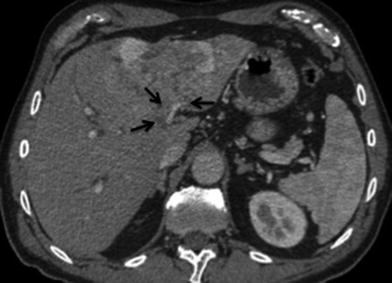
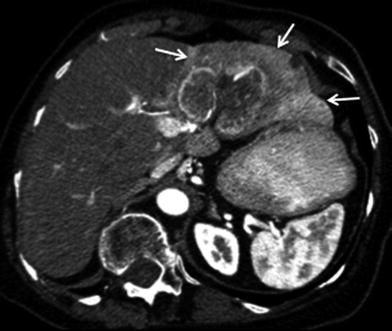
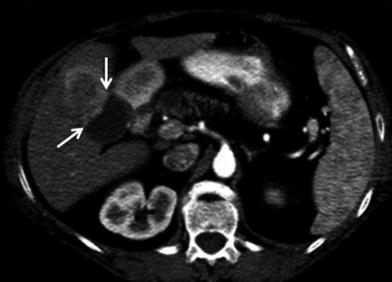
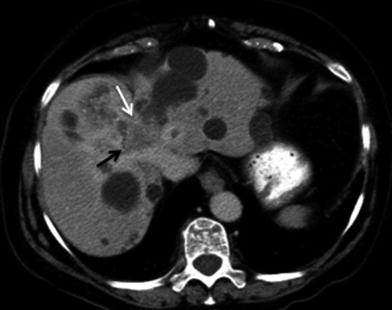
Fig. 26
Hepatic artery involvement; 72-year-old male with weakness and anorexia. a Axial and b coronal MSCT images in late arterial phase show heterogeneous enhancing mass in the left liver lobe with encasement (black arrow) of the left hepatic artery. Capsular retraction (white arrow) is appreciated as well
Fig. 27
Vascular involvement; 72-year-old male with ICC. Axial MSCT image in portal venous phase shows heterogeneous mass with encasement of the left portal vein (arrows)
Fig. 28
Transient asymmetric hepatic enhancement secondary to portal vein invasion; 79-year-old female presenting with chronic right upper quadrant pain. Late arterial phase axial MSCT image demonstrates large mass with enhancement of the surrounding liver parenchyma of the left liver lobe (arrows), representing preferential arterial flow secondary to portal vein invasion
Fig. 29
Adjacent organ involvement; 62-year-old female with ICC. Axial MSCT image in late arterial phase shows heterogeneous mass in segment V of the left liver lobe (arrows) invading the gallbladder by direct extension
Fig. 30
Invasive ICC; 83-year-old female with polycystic kidney disease and ICC. Axial MSCT image in delayed phase shows heterogeneous mass in segments VIII and IVA of the liver with encasement of the mid-hepatic vein (white arrow). Bile duct invasion is also appreciated with mild biliary ductal dilation (black arrow)
5.2 Nodal Disease
Lymph node status is an important prognostic indicator. The radiologic evaluation of lymph nodes is based on size, morphology, and location. Helpful clues for metastatic lymph nodes include size >1 cm, low-density center due to necrosis, or delayed enhancement. Nodes located near the primary tumor are likely to be malignant, even if they measure <1 cm in minimum diameter. A round node is also more likely to be malignant than an oval node. CT has a high negative predictive value but a low positive predictive value for lymph node involvement [38].
Nodes along the hepatic hilum are a common site of central tumor spread. Central ICC typically spreads into the hepatoduodenal ligament first, and then into the para-aortic nodes, retropancreatic nodes, and common hepatic artery nodes, in that order. Diaphragmatic nodes in the anterior, posterior, or middle diaphragmatic nodal stations, as well as, para-cardiac and lesser curvature nodes may be considered as N1 nodes for ICC that are located near the dome and in the left lobe of the liver [39] (Fig. 31). The nodal disease defines N1 and N2 nodes as regional or distant nodal spread of disease, respectively. Examples of N1 are perihepatic, periportal, portocaval, and periceliac nodes (Figs. 32, 33). Common distant lymph node involvement includes mediastinum and retroperitoneal para-aortic nodes (Fig. 33).
Get Clinical Tree app for offline access
Fig. 31
Lymphatic spread of ICC. 61-year-old male with ICC in the left hepatic lobe. Noncontrast MSCT axial image shows a mildly enlarged lymph node in the middle diaphragmatic nodal station (arrow), consistent with N1 node. The node is enlarged when compared to prior exam, favoring neoplastic involvement
Fig. 32
Lymphatic spread of ICC; 60-year-old female with left ICC. a Contrast-enhanced MSCT axial image shows an enlarged hypodense lymph node in the gastrohepatic nodal station (arrow), consistent with N1 node. b


Related posts:
Stay updated, free articles. Join our Telegram channel
Full access? Get Clinical Tree
