MRI plays a central role in the work-up of a patient presenting with a suspected musculoskeletal tumor. MRI can confirm the presence of a lesion, allow for a specific diagnosis in some cases, define the extent of tumor spread, provide biopsy guidance, and assist in the evaluation of recurrent disease after therapy.
Therapeutic planning at the time of presentation is based primarily on the stage of the lesion. Local staging of a tumor depends on which anatomic structures and spaces (compartments) are involved, and this is best shown with MRI. , Because an understanding of tumor staging is an important precursor to designing an optimal MRI protocol for evaluating these lesions, this chapter begins with a section briefly describing the principles of tumor staging. Despite your understandable natural instinct to skip over this material, we strongly urge you to read it to understand better how to set up and interpret MRI studies for this important indication.
Staging of Musculoskeletal Tumors
PRINCIPLES OF STAGING
The primary goal of the oncologic surgeon is to provide local control of disease by obtaining adequate tumor margins at the time of resection. If possible, this goal is achieved through a limb-sparing procedure; but if the lesion is too advanced, an amputation or disarticulation is required. The decision to amputate or perform a limb-sparing procedure depends on many factors, including tumor size; relationship of the tumor to adjacent structures, such as nerves, vessels, and joints; and the overall stage of the tumor at the time of presentation.
Although there are different staging systems, they all are based on three components , :
- 1.
Grade of the tumor
- 2.
Local extent of the tumor
- 3.
Presence or absence of metastases
The Enneking staging system, which has been adopted by the Musculoskeletal Tumor Society, is outlined in Table 7-1 .
| Stage | Grade (G) | Site (T) | Metastases (M) |
|---|---|---|---|
|
|
|
|
Grade
The grade of the tumor is a measure of its potential to metastasize. It is based primarily on histologic features and requires a preoperative biopsy. A sarcoma is classified as either low grade or high grade. Generally, a low-grade lesion is less biologically active and requires a relatively conservative surgical procedure. Conversely, a high-grade lesion usually necessitates a more radical procedure because of its more aggressive nature.
Local Extent
Factors related to the local extent of the tumor include its size and degree of involvement of adjacent tissues. Sarcomas tend to grow centrifugally along pathways of least resistance and are contained in part by a pseudocapsule as they extend into adjacent tissues. A malignant lesion may remain confined within the pseudocapsule (intracapsular); generally, however, malignant cells often extend beyond these capsular boundaries. If a lesion extends through its capsule, but is still confined within a single anatomic compartment, it is considered extracapsular and intracompartmental. If the tumor extends into an adjacent compartment, it is classified as extracompartmental. Extracompartmental spread may occur via direct tumor invasion of an adjacent compartment or by contamination resulting from fracture, hemorrhage, or an operative procedure such as an unplanned resection or poorly planned biopsy. Generally, lesions with more advanced local extension, including involvement of neurovascular structures or joints, require excision of more adjacent tissue than smaller tumors.
Metastases
The third component of the staging system is the presence or absence of nodal or distant metastases. Determination of metastases is usually accomplished with computed tomography (CT) and radionuclide bone scanning, but more recently, CT with positron emission tomography and whole-body MRI have been advocated as possible alternatives. Regional lymph node involvement is much less common with musculoskeletal sarcomas than are pulmonary metastases, but both are equally poor prognostic factors.
PRINCIPLES OF IMAGING
Bone Tumors
MRI is the most sensitive imaging modality for detecting and delineating bone tumors, especially tumors involving the marrow cavity. The MRI appearance of most osseous lesions is very nonspecific, however, and conventional radiographs are essential for evaluating a primary bone tumor. Radiographs should be obtained early in the work-up of a symptomatic patient because they are inexpensive and provide the most specific information of any modality regarding the true nature of a lesion. The radiographic findings and degree of clinical suspicion dictate further work-up. If an aggressive osseous lesion is identified on conventional radiographs, MRI is useful in the preoperative assessment of these patients because it is the best modality for local staging. If a bone lesion is clearly benign radiographically, MRI generally is unnecessary.
For a patient with normal radiographs, a radionuclide bone scan often is the next study obtained; if a focal abnormality is detected, MRI is useful for further characterization. Even with a negative bone scan, MRI can detect radiographically occult intramedullary lesions and should be obtained in a patient with a known primary tumor and focal symptoms or laboratory abnormalities that suggest osseous metastases ( Fig. 7-1 ).

Soft Tissue Tumors
In a patient with a suspected soft tissue mass, conventional radiographs still should be obtained because they may reveal bone involvement or soft tissue calcifications that might be missed with MRI. In many cases, the MRI appearance of a soft tissue mass is so characteristic that a confident, specific diagnosis can be provided, obviating further work-up. Even if the MRI features do not allow a specific diagnosis to be made, MRI is still useful for staging these lesions.
Important MRI Features ( Box 7-1 )
For osseous and soft tissue lesions, the crucial factors influencing resectability that should be addressed in the MRI report include intraosseous and extraosseous tumor extent, neurovascular or joint involvement, and nodes.
- •
Intraosseous extent
- •
Extraosseous extent
- •
Neurovascular involvement
- •
Joint invasion
- •
Skip metastases in same bone
- •
Local adenopathy
Intraosseous Tumor Extent.
Intraosseous tumor extent is best determined with T1W or STIR imaging ( Fig. 7-2 ). The intraosseous extent of tumor may be overestimated with STIR because it can be difficult to separate intraosseous tumor from peritumoral edema on these images. MRI also is able to detect skip lesions (foci of tumor that are not contiguous with the primary lesion) missed with scintigraphy.

Extraosseous Tumor Extent.
Extraosseous tumor extent is best evaluated with T2W or STIR imaging (see Fig. 7-2 ). Most tumors become hyperintense to fat on these sequences, and it may be difficult to separate tumor from adjacent soft tissue edema. MRI features of edema that help to differentiate it from neoplasm include feathery margins, an absence of mass effect, and no distortion of muscle planes (see Fig. 7-2 ). Because a 5-cm “cuff” of normal tissue beyond the tumor margins usually is desired at surgery, exact measurements of the intraosseous and extraosseous components should be provided with reference to an osseous landmark (eg, distance from the articular surface of the medial femoral condyle for a lesion involving the femoral shaft).
Neurovascular or Joint Involvement.
Identification of neurovascular involvement is crucial ( Fig. 7-3 ). Such involvement may preclude the possibility of a limb-sparing procedure because the functional status of a patient with a denervated limb after surgery may be worse than that achieved with an amputation. MRI is highly accurate in showing a lack of neurovascular involvement when a clear plane of normal tissue is shown between nerves or vessels and tumor. Gross tumor invasion usually is easily diagnosed, but if there is equivocal tumor involvement, this should be reported as such. The structures can be reassessed at the time of surgery. On a practical note, an anatomic atlas should be consulted in most cases to determine the expected position of pertinent nerves and vessels. Otherwise, neurovascular involvement might be overlooked if these structures are completely obliterated by a tumor.

Because each joint is a distinct compartment, articular invasion changes the stage of a tumor and should be critically evaluated on every scan. MRI is very accurate for excluding joint involvement when the joint margins appear free of tumor, but is less accurate when the tumor is in close proximity to the joint. Close proximity results in a tendency to overcall joint invasion, which could result in an unnecessarily radical surgical procedure.
Nodes.
Local and, when possible, regional lymph nodes should be assessed because nodal involvement carries the same poor prognosis as distant metastases in a patient with a musculoskeletal sarcoma.
EVALUATION OF TUMOR AFTER THERAPY
Postchemotherapy
Survival of patients with musculoskeletal sarcomas has improved with the development of better adjuvant chemotherapeutic regimens. Assessing the degree of tumor response to chemotherapy is important for establishing the patient’s prognosis and for planning further therapy. If viable tumor cells constitute less than 10% of a lesion after therapy, this indicates a good response (a “responder”), whereas more than 10% represents a poor response (a “nonresponder”). Currently, this response is determined after resection of the tumor, but several series have evaluated the use of MRI in this setting with conflicting results.
Changes in tumor size, signal intensity, or adjacent edema on conventional sequences are not sufficiently predictive to separate responders from nonresponders. Similarly, because tumor and non-neoplastic reactive tissue enhances on standard, postgadolinium T1W images, this technique also is unreliable for this purpose. Dynamic enhancement patterns on gadolinium-enhanced, rapid gradient echo–T1W sequences have shown a high degree of correlation with response or nonresponse because residual tumor enhances earlier than reactive tissue. , We do not use these methods, however, because they are time-consuming, technically challenging, and still not reliable enough to replace biopsy and histology.
Postsurgery and Postradiation
MRI is valuable for detecting tumor recurrence after surgical or radiation therapy, primarily because of its superb soft tissue contrast. MRI is sometimes too sensitive in this regard because postsurgical and postradiation changes in tissues can produce signal intensity that may be mistaken for neoplasm. Careful analysis of T1W, T2W, and STIR images, combined with an understanding of a few basic principles, can markedly improve the diagnostic accuracy of MRI in this setting. Postcontrast imaging also may be beneficial in certain cases, as described subsequently.
A lack of increased signal intensity on T2W or STIR images is a strong predictor of no tumor recurrence because recurrent tumor usually shows high signal intensity on these images. There are other, non-neoplastic causes of increased signal intensity in these patients, however, which can mimic tumor, including radiation-induced edema and postoperative fluid collections such as hematoma, seroma, or abscess. Certain features help to separate these entities.
Surgery and radiation therapy often result in edema or hemorrhage within tissues, but the absence of a discrete mass is strong evidence against tumor recurrence. This can be evaluated on T1W images by looking for loss of the normal fatty marbling within muscle or distortion of the intermuscular fascial planes. The presence of normal skeletal muscle architecture in these regions on T1W images (normal “texture sign”) is highly predictive of no tumor recurrence, despite the presence of increased signal intensity on T2W images or enhancement after gadolinium administration ( Fig. 7-4 ).

If a mass is discovered, administration of intravenous (IV) gadolinium may be helpful for further characterization. A postoperative lymphocele, seroma, or abscess appears as a high signal intensity mass on T2W images, but does not show internal enhancement on postgadolinium T1W images ( Fig. 7-5 ). If an enhancing mass is identified, biopsy is indicated because recurrent tumor is likely ( Fig. 7-6 ); however, post-therapy granulation tissue also can enhance and produce an identical appearance.


How to Image Tumors
Based on these principles, an imaging protocol can be designed that provides the information needed for accurate staging or post-therapy follow-up.
- •
Coils and patient position: In most cases, the patient is scanned in a supine position. Rarely, a prone position may allow for improved comfort and less motion artifact (eg, when scanning the sternum). We typically begin with a sequence using the body coil and a large field of view to ensure that all portions of the primary tumor are identified. This is important for surgical planning, identifying skip or metastatic lesions, and designing additional sequences. When the extent of the tumor has been documented, higher resolution images should be obtained, using a surface coil whenever possible. This provides for optimal assessment of tumor margins and involvement of neurovascular or joint structures.
- •
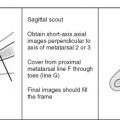
Image orientation: The initial large field-of-view sequence should be performed in a coronal or sagittal plane to display best the entire length of the lesion. Axial images are obtained with a smaller field of view to delineate tumor margins and neurovascular or articular involvement. These should be supplemented with additional longitudinal images to produce images that are tangential, rather than en face, to the lesion. Sagittal images are most helpful for a mass involving the anterior or posterior tissues of an extremity, whereas coronal images are used for lesions that are primarily medial or lateral in location.
- •
Pulse sequences and regions of interest: A skin marker should be placed over the suspected mass to confirm that the tissues of interest have been covered. In a postoperative patient, the entire length of the scar should be imaged. STIR imaging is most helpful for the initial large field-of-view sequence because it is very sensitive to neoplastic tissue and associated edema or hemorrhage. It also is superb for detecting any skip or metastatic lesions. It may be difficult to differentiate tumor from edema in the medullary canal on STIR images alone, and an additional body coil coronal or sagittal T1W sequence is a useful adjunct because of the sharp contrast between tumor and fat on this sequence. T1W images also are useful for defining anatomy and detecting high signal fat or hemorrhage within a lesion. Axial T1W and STIR images are obtained, followed by T1 and fast spin echo–T2W or STIR images in a longitudinal plane, using a surface coil, if possible, to resolve tumor margins and involvement of adjacent structures better. A word of caution regarding fast spin echo–T2W sequences: The relatively bright signal intensity of fat on these images is similar to that of most pathologic processes, and this may mask an intramedullary lesion. Fat saturation should be used routinely with this sequence to improve lesion detection. Gradient echo sequences are not a part of our routine tumor protocol, although these can be used for evaluating flow within a lesion or adjacent vessels. This technique is also useful for detecting the presence of hemosiderin within a hematoma or within an area of pigmented villonodular synovitis.
- •
Contrast enhancement: We do not administer IV gadolinium as part of our standard tumor protocol, but use it when attempting to differentiate cystic from cystic-appearing solid lesions.
After surgical or radiation therapy, we use T1W and STIR sequences to image the area of interest and postgadolinium imaging to evaluate for any enhancing masses in the treatment area.
Approach to Image Interpretation
GENERAL PRINCIPLES
Many benign lesions generally show smooth margins, homogeneous signal intensity, and a lack of involvement of neurovascular structures. Conversely, malignant masses tend to display heterogeneous signal, irregular margins, associated edema, and invasion of neurovascular or osseous structures.
There is a large amount of overlap in the appearances of benign and malignant lesions using these characteristics, and it can be dangerous to attempt to determine conclusively whether a mass is benign or malignant based on its MRI appearance ( Fig. 7-7 ). Most lesions need to be classified as indeterminate and undergo biopsy for accurate characterization.

Contrast enhancement using standard, T1W sequences has not been helpful in differentiating benign from malignant lesions, although gadolinium-enhanced imaging using rapid T1W gradient echo sequences can provide some information regarding the malignant potential of a tumor based on the rate of enhancement. Benign tumors tend to enhance more slowly than malignant lesions, but in a given patient, we prefer to perform a biopsy of the lesion, rather than rely on statistical probability, because of the large amount of overlap between benign and malignant lesions.
BONE LESIONS
A reasonable differential diagnosis can be developed for most osseous lesions using the patient’s age and the location of the lesion (within the skeleton and within the particular bone) and its radiographic appearance. For most bone tumors, MRI is used for staging, rather than for arriving at a specific diagnosis, because the true nature and aggressiveness of a lesion are determined much more accurately with conventional radiographs. Consequently, recent radiographs always should be viewed in conjunction with MR images; this is also important because some benign osseous lesions display a very aggressive, potentially misleading appearance on MRI. These include osteoid osteoma, chondroblastoma, osteoblastoma, eosinophilic granuloma, and stress fracture ( Fig. 7-8 ). The edema associated with these lesions often results in extensive signal abnormality in the medullary cavity and adjacent soft tissues, mimicking more aggressive lesions, such as osteomyelitis or malignant tumor.

An osteoid osteoma is a cortically based lesion. The key to its diagnosis is to show a focal tumor nidus within the area of cortical/periosteal reaction. The tumor nidus typically shows low to intermediate signal intensity on T1W images, low or high signal on T2W images, and a variable degree of enhancement after gadolinium administration. There is usually a significant amount of surrounding marrow or soft tissue edema that can obscure the nidus and lead to an erroneous diagnosis ( Fig. 7-9 ). In many cases, the nidus is more readily identified with CT scanning through the lesion. ,

Chondroblastoma should be suspected when a lesion is found in a skeletally immature patient with its epicenter in the epiphysis. Striking signal abnormality, corresponding to edema, often extends into the adjacent medullary cavity and overlying soft tissues.
In the case of a stress fracture, the presence of a linear fracture line within an area of marrow edema or cortical bone is diagnostic. In the absence of a fracture line, follow-up radiographs obtained 2 to 3 weeks later may be diagnostic. Biopsy should be avoided because the immature osteoid related to the healing process may be mistaken for malignancy at histology.
Differential Features
Although conventional radiographs provide the most specific information regarding the true nature of a bone tumor, there are some MRI features that can help to limit the differential diagnosis.
Increased Signal: T1W Images ( Box 7-2 )
Intraosseous Lipoma.
Intraosseous lipomas most commonly occur in the calcaneus, proximal femur, and humerus. They sometimes are difficult to differentiate from other lytic lesions on conventional radiographs, but are easily recognized on MR images because of their predominantly fat signal on all sequences. An intraosseous lipoma also may contain areas of increased or decreased signal intensity on T2W images, reflecting cystic degeneration or calcification ( Fig. 7-10 ).
- •
Intraosseous lipoma
- •
Hemangioma
- •
Bone infarct
- •
Paget’s disease

Intraosseous Hemangioma.
Intraosseous hemangiomas are common in the spine. Simple hemangiomas display increased signal intensity on T2W images, but are differentiated from other lesions by high signal intensity on T1W images caused by their fat content ( Fig. 7-11 ). Alternatively, hypervascular (aggressive) intraosseous hemangiomas typically do not contain fat and are indistinguishable from other tumors.

Medullary Bone Infarct.
A medullary bone infarct is a geographic lesion with a serpentine, low signal intensity margin on T1W and T2W MR images. These usually contain fat centrally, interspersed with foci of mixed signal intensity, corresponding to areas of fibrosis, calcification, or edema ( Fig. 7-12 ).