A. Sound waves
–Sound waves are pressure disturbance that propagates through a material (e.g., tissue).
–Changes in pressure are made by forces acting on the material molecules.
–Molecules oscillate about their unperturbed location.
–The amplitude of a wave is the size of pressure difference from the equilibrium value.
–Larger pressure amplitudes produce denser compressions and hence higher intensities of sound.
–Wavelength (λ) is the distance between successive wave crests.
–Frequency (f) is the number of oscillations in each second.
–Frequency is also the number of wavelengths that pass a given point each second.
–Ultrasound waves are transmitted through tissue as longitudinal waves of alternating compression and rarefaction.
–Longitudinal waves have vibrations along their travel direction.
–Transverse waves have vibrations perpendicular to the travel direction.
–Ultrasound waves propagate in material at velocity (v).
–Sound waves transmit energy through the material.
B. Ultrasound frequency and wavelength
–Frequencies are measured in hertz (Hz), where 1 Hz is one oscillation per second.
–The period is the time between successive oscillations.
–The period is the reciprocal of the frequency (i.e., 1/f).
–When the frequency is 10 Hz, the period is 0.1 second (i.e., 1/10).
–Audible sound has frequencies ranging from 15 Hz to 20,000 Hz.
–1,000 Hz equals 1 kHz; 1,000 kHz equals 1 MHz (1,000,000 Hz)
–Ultrasound frequencies are greater than 20 kHz.
–Diagnostic ultrasound uses transducers with frequencies ranging from 1 to 20 MHz.
–At 2 MHz, the ultrasound wavelength in soft tissue is 0.77 mm.
–Ultrasound wavelengths depend on the material compressibility.
–At 2 MHz, the ultrasound wavelength is 0.17 mm in air and 1.7 mm in bone.
–Ultrasound wavelength decreases with increasing frequency.
–In soft tissue, the ultrasound wavelength is 0.39 mm at 4 MHz and 0.15 mm at 10 MHz.
C. Sound velocity
–For sound waves, the relation between velocity (v) measured in m/s, frequency (f), and wavelength is v = f ×λ (m/s).
–In any material (i.e., constant v), frequency and wavelength are inversely related.
–For a given material, sound velocity is independent of frequency.
–Different instruments in an orchestra (or rock band) produce different frequencies but travel through a concert hall at exactly the same speed.
–Sound velocity depends on type of material or tissue.
–Velocity is inversely proportional to the square root of the material compressibility.
–Materials that are not particularly compressible (e.g., bone) have high sound velocities.
–Compressible materials (e.g., air) have the lowest sound velocities.
–The average velocity of sound in soft tissue is 1,540 m/s.
–This velocity is assumed by all ultrasound scanners used to image patients.
TABLE 10.1 Ultrasound Velocities of Interest in Ultrasound Imaging
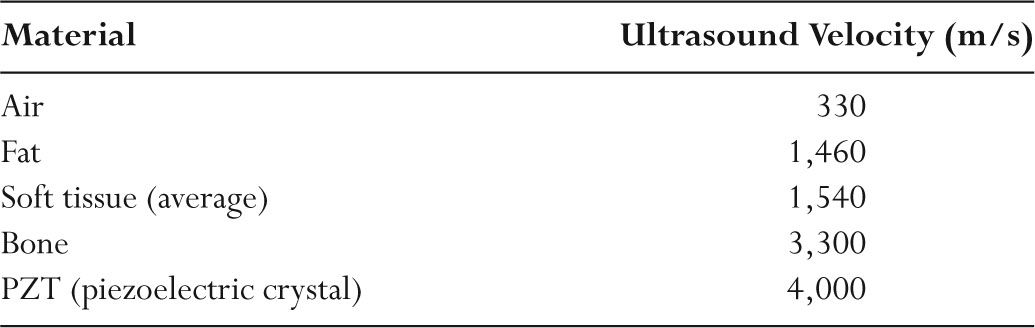
–Sound velocities are slightly lower in fat than tissue.
–Reduced sound velocities in fat result in imaging artifacts (displacement artifact).
–Table 10.1 lists sound velocities for materials and tissues of interest in ultrasound imaging.
D. Intensity
–The ultrasound intensity is a measure of the energy flowing through a given cross- sectional area each second.
–Ultrasound intensities are normally expressed in milliwatts per cm2 (mW/cm2).
–The total power in the ultrasound beam is the product of the ultrasound intensity and the beam area.
–Power is intensity times area.
–The total energy transmitted is the product of the power and the time the beam is on.
–Energy is power times time.
–Relative sound intensity is measured on a logarithmic scale and may be expressed in decibel (dB).
–Decibels are equal to 10 × log10(I/I0), where I0 is the original intensity and I is the measured intensity.
–Negative decibel values correspond to signal attenuation.
–Positive decibel values correspond to signal amplification.
–Intensity reduced to 10% is −10 dB, to 1% is −20 dB, and to 0.1% is −30 dB, and so on.
–A 50% reduction of sound intensity corresponds to −3 dB.
–Intensity increases of +10 dB correspond to a 10-fold increase, +20 dB to a 100-fold increase, +30 dB to a 1,000-fold increase, and so on.
–Doubling of the sound intensity corresponds to +3 dB.
E. Acoustic impedance
–Acoustic impedance is an important ultrasound property of any material or tissue.
–The acoustic impedance (Z) of a material is the product of the density (ρ) and the sound velocity (v) in the material.
–Acoustic impedance Z = ρ × v
–The acoustic impedance unit is called the Rayl.
–Acoustic impedance is independent of frequency in the diagnostic range.
–Air and lung have low acoustic impedances.
–Air and lung have low physical densities as well as low sound velocities.
–Bone has a high acoustic impedance.
–Bone has a high physical density and high sound velocity.
–Piezoelectric crystals have very high acoustic impedances.
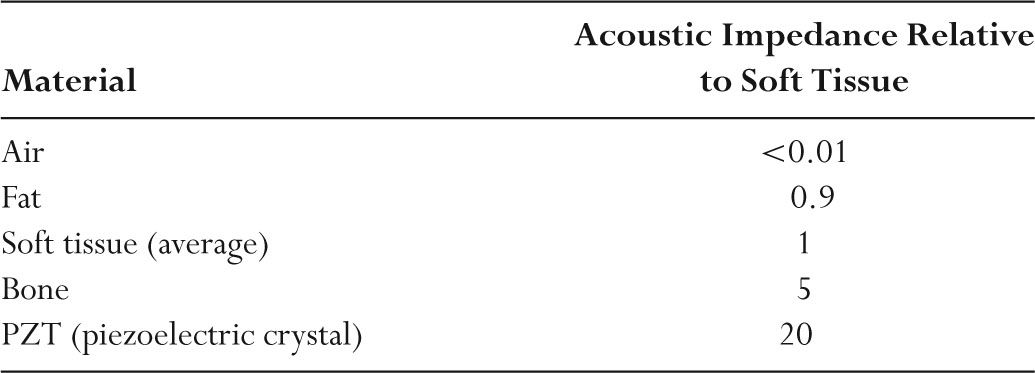
–Most tissues have acoustic impedance values of ~1.6 × 10⁶ Rayl.
–Table 10.2 lists relative values of acoustic impedance values for materials and tissues of interest in ultrasound imaging.
–Differences between acoustic impedances at interfaces determine the amount of energy reflected at the interface.
A. Reflections
–A portion of the ultrasound beam is reflected at tissue interfaces.
–Nonspecular reflections are diffuse scatter from rough surfaces where the irregular contours are bigger than the ultrasound wavelength.
TABLE 10.2 Relative Impedances of Materials of Interest in Ultrasound Imaging
–Only a very small fraction of energy from nonspecular reflections returns to the transducer.
–Specular reflections occur from large smooth surfaces (Fig. 10.1).
–Specular reflection intensity is independent of frequency.
–The sound reflected back toward the transducer is called an echo.
–Specular reflection echoes are used to generate ultrasound images.
–The fraction of ultrasound reflected depends on the acoustic impedance of the tissues.
–At normal incidence (90 degrees), the fraction of ultrasound intensity reflected at an interface between material Z1 and Z2 is [(Z2 − Z1)/(Z2 + Z1)]2.
–The sum of the transmitted and reflected intensities must always equal 1.
–Intensity transmitted is (4Z1× Z2)/(Z1 + Z2)2.
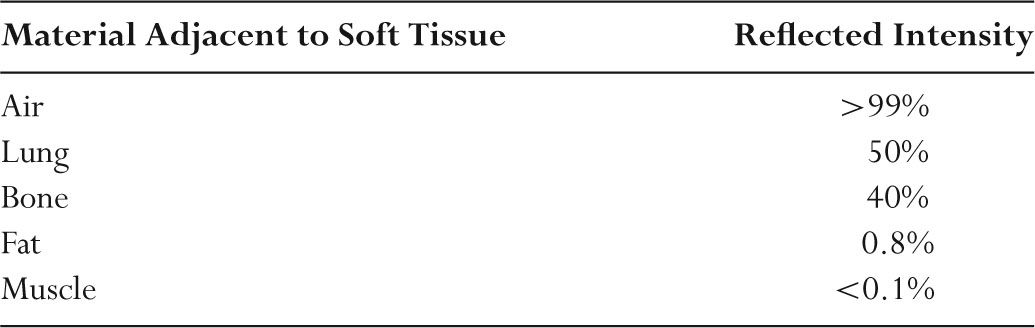
–Table 10.3 lists values of reflected intensities for a range of interfaces encountered in diagnostic ultrasound.
–Tissue/air interfaces reflect ~100% of incident ultrasound beam.
–Gel is applied between the transducer and skin to displace the air and minimize large reflections that would interfere with ultrasound transmission into the patient.
–Bone/tissue interfaces also reflect substantial fractions of the incident intensity.
–In imaging the abdomen, the strongest echoes are likely to arise from gas bubbles.
–Imaging through air or bone is generally not possible.
–Lack of transmissions beyond these interfaces results in areas void of echoes called shadowing.
B. Scattering
–Scattering occurs when ultrasound encounters objects that are smaller than the ultrasound wavelength.
–In scattering, most of the wave passes unperturbed, and a scattered wave is generated that travels outward in all directions from the scatter.
–Organs such as the kidney, pancreas, spleen, and liver are composed of complex tissue structures that contain many scattering sites.
–These organs give rise to a signature that is characteristic of each tissue.
–Hyperechoic means a higher scatter amplitude relative to the background signal.
–More scatter can occur because of larger number of scatters, larger acoustic impedance differences, or larger scatterers.
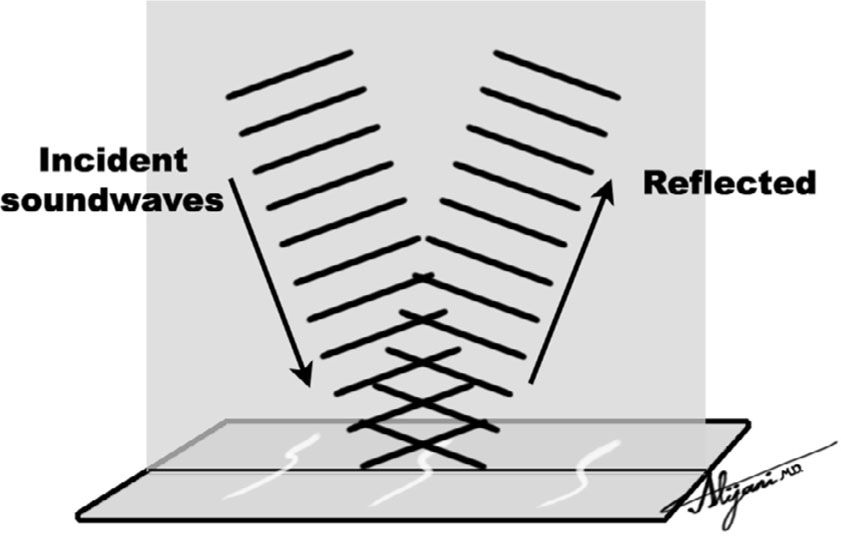
FIGURE 10.1 Specular reflection from a smooth reflector, with the angle of incidence equal to the angle of reflection.
TABLE 10.3 Reflection Intensities at an Interface between Soft Tissue and the Specified Material
–Hypoechoic means that there is a lower acoustic scatter intensity relative to the average background signal.
–Organs that contain fluids, such as the bladder, and cysts have no internal structure and almost no echoes (i.e., show black).
C. Refraction
–Refraction is the change in direction of an ultrasound beam when passing from one tissue to another having a different speed of sound.
–When ultrasound passes from one tissue to another having a different speed of sound, the frequency remains the same, but the wavelength changes.
–The change of wavelength occurs to accommodate the different velocity of sound in the second tissue and shortens when the velocity is reduced.
–Refraction is described by Snell’s law: sinθi/sinθt = v1/v2, where θi is the angle of incidence, θt is the transmitted angle, v1 is the velocity in tissue 1, and v2 is the velocity in tissue 2.
–Figure 10.2 shows the refraction (i.e., bending) of an ultrasound beam.
–When the velocity of sound in tissue 2 is greater than that of tissue 1, the transmission angle is greater than the angle of incidence (and vice versa).
–Ultrasound machines assume straight line propagation, and any refraction effects result in image artifacts.
D. Attenuation
–Attenuation is a composite effect of loss by scatter and absorption.
–The absorbed sound wave energy is converted into heat.
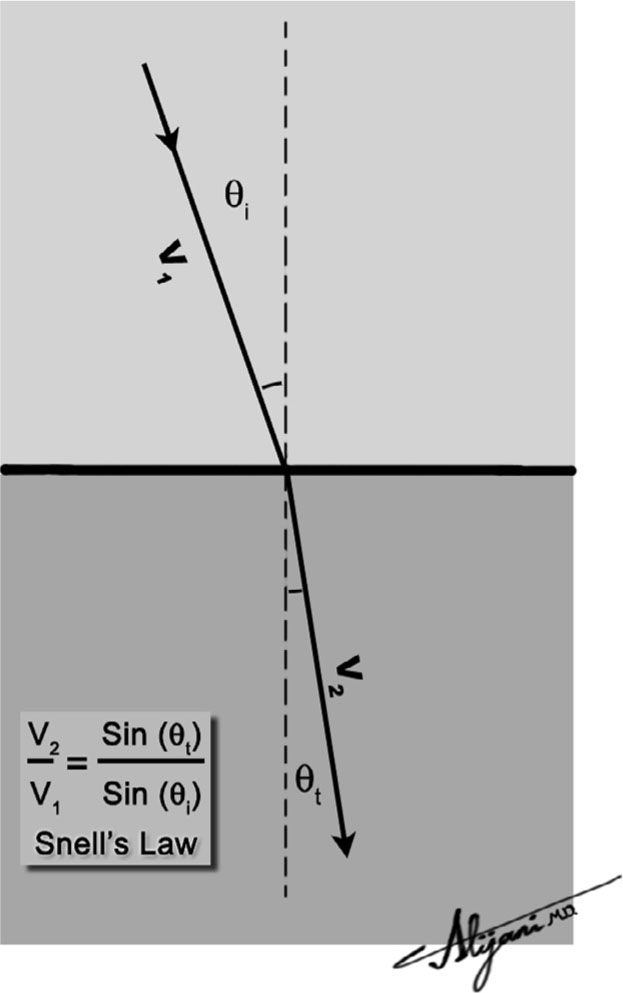
FIGURE 10.2 Refraction of an ultrasound beam when it passes from a medium with velocity v1 to another with velocity v2(v2 < v1).
–The attenuation of ultrasound in a homogeneous tissue is exponential.
–Attenuation is normally expressed in terms of dB and depends on the distance the ultrasound beam has traveled in tissue.
–Attenuation increases with increasing frequency.
–In soft tissues, there is a nearly linear relation between the frequency and attenuation of ultrasound.
–For water and bone, attenuation increases approximately as frequency squared.
–Due to its high frequency, ultrasound is attenuated more readily than audible sound.
–Each tissue has an attenuation coefficient dB/cm per MHz.
–Ultrasound has an attenuation in soft tissue of ~0.5 dB/cm per MHz.
–The value of an attenuation coefficient of 0.5 dB/cm per MHz is an approximation commonly used to quantify the loss of power in ultrasound beams for clinical imaging.
–Attenuation in soft tissue is ~0.5 dB/cm at 1 MHz and ~10 dB/cm at 10 MHz.
–Little absorption occurs in fluids.
–In ultrasound imaging, pulses travel to the reflector and back to the transducer.
–Distance traveled, and consequently the attenuation, is twice the penetration depth.
E. Depth gain compensation (DGC)
–An echo from a perfect reflector (e.g., air bubble) at the surface travels no distance and undergoes no attenuation.
–An echo from the same reflector at a depth of 1 cm will be weaker because the ultrasound echo has traveled 2 cm round trip and undergone attenuation.
–Echoes from this reflector at a depth of 10 cm will be extremely weak because of attenuation in traveling a round trip distance of 20 cm.
–Uncorrected echo data would thus show distant echoes as being much weaker than superficial echoes.
–Ultrasound scanners compensate for increased attenuation with image depth.
–This is accomplished by increasing the signal gain as the echo return time increases.
–Correcting for echo attenuation in this manner is known as depth gain compensation (DGC).
–DGC is also known as time gain compensation (TGC), time varied gain (TVG), and swept gain.
–DGC makes equal reflectors have the same brightness in the resultant ultrasound image.
–DGC controls are usually adjusted by the operator during the imaging procedures.
A. Function
–A transducer is a device that can convert one form of energy into another.
–Piezoelectric transducers convert electrical energy into ultrasonic energy, and vice versa.
–Piezoelectric means pressure electricity.
–Ultrasound transducer materials include lead-zirconate-titanate (PZT), plastic polyvinylidene difluoride (PVDF), and the new monocrystalline transducers.
–The piezoelectric effect of a transducer is destroyed if heated above its Curie temperature.
–High-frequency voltage oscillations are produced by the scanner’s front end and sent to the ultrasound transducer over coaxial cables.
–Transducer crystals do not conduct electricity, but each side is coated with a thin layer of silver that acts as an electrode.
–The electrical energy causes the crystal to momentarily change shape (i.e., expand and contract).
–The nonconducting crystal changes shape in response to a voltage placed on its electrodes.
–This change in shape of the crystal increases and decreases the pressure in front of the transducer, thus producing ultrasound waves (transmitter).
–When the crystal is subjected to pressure changes by the returning ultrasound echoes, the pressure changes are converted back into electrical energy signals.
–Voltage signals from returning echoes are transferred from the receiver to a computer, which are then used to create ultrasound images.
–Transducers may be operated in either pulsed or continuous-wave mode.
–Virtually all of medical ultrasound makes use of pulsed transducers.
–The thickness of a piezoelectric crystal determines the resonant frequency of the transducer.
–Transducer crystals are normally manufactured so that their thickness (t) is equal to one-half of the wavelength (λ) (i.e., t = λ/2).
–Changing the thickness of the crystal changes the frequency but not the ultrasound amplitude or velocity.
–A thickness to 1 mm and a velocity of sound of 4,000 m/s has a resonant frequency f = v/λ = v/(2 × t), or 2 MHz.
–High-frequency transducers are thin, and low-frequency transducers are thick.
–Transducers also emit ultrasound energy at frequencies other than the resonant frequency but at a lower intensity.
–Clinical scanners can drive their transducers at several different transmit frequencies.
–The bandwidth is related to the range of frequencies generated by the crystal.
–The bandwidth determines the purity of sound and the length of time a sound persists, or ring down time.
–Narrow bandwidth transducers produce a relatively pure frequency.
–Pure sounds (narrow bandwidth) will persist for a long time.
–Wide bandwidth transducers produce a wider range of frequencies.
–Sounds with a broad range of frequencies last for only a very short time.
C. Design features
–Most transducers are designed to be broadband and therefore produce short pulses.
–Blocks of damping material, usually tungsten/rubber in an epoxy resin, are placed behind transducers to reduce vibration (ring down time).
–Damping broadens the bandwidth and shortens pulses.
–A matching layer of material is placed on the front surface of the transducer to improve the efficiency of energy transmission into (and out of) the patient.
–More than one layer may be used.
–The matching layer material(s) has an impedance value that is intermediate between that of the transducer and that of tissue.
–The matching layer thickness is one-fourth the wavelength of sound in that material and is referred to as quarter-wave matching.
–Figure 10.3 shows the components of a typical piezoelectric transducer.
D. Beams
–The near field of the ultrasound beam is adjacent to the transducer and is the region used for ultrasound imaging.
–The near field is also called the Fresnel zone.
–The length of the near field is r2/λ, where r is the transducer radius and λ is the wavelength.
–For a 10-mm-diameter transducer operating at 3.5 MHz, the near field extends ~6 cm in soft tissue.
–Doubling the transducer size increases the near field length fourfold.
–Doubling the transducer frequency halves the wavelength, which doubles the extent of the near field.
–The far field starts where the near field ends.
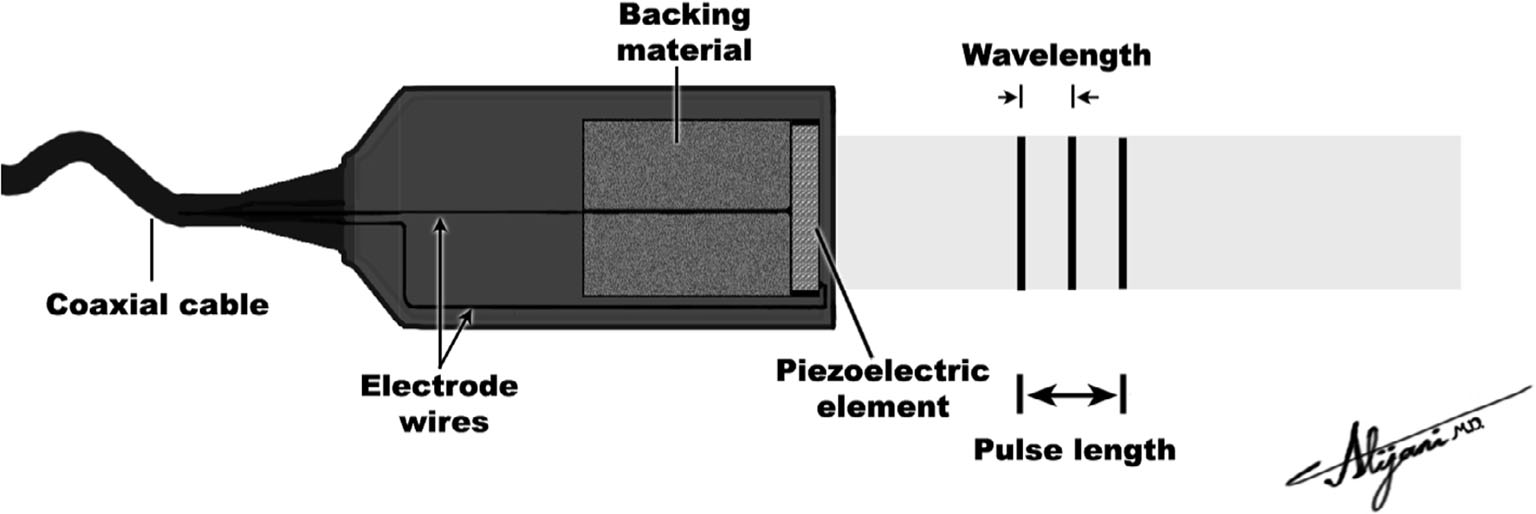
FIGURE 10.3 Transducer producing an ultrasound pulse that has a total pulse length of only two wavelengths.
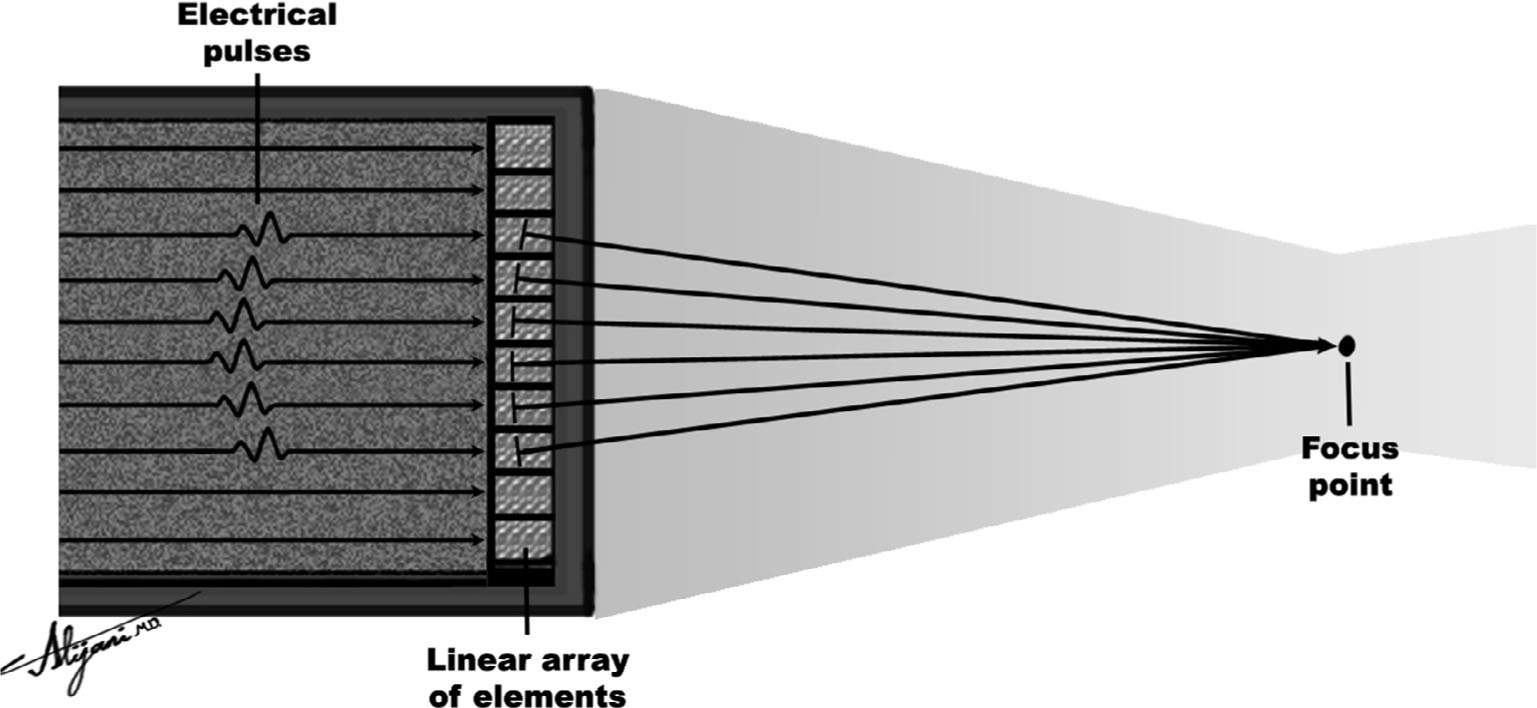
FIGURE 10.4 Phased array, which makes use of time delays in activating the individual array elements to focus the ultrasound beam.
–In the far field, the ultrasound beam diverges and the intensity falls off very rapidly.
–The far field is also called the Fraunhofer zone.
Related posts:


Stay updated, free articles. Join our Telegram channel

Full access? Get Clinical Tree


