Introduction
Because chronic liver disease and cirrhosis is the twelfth most common cause of death in the United States, evaluation of the liver and its vasculature is a very common indication for abdominal Doppler. The liver vessels are effectively imaged with ultrasound in a high percentage of patients. Therefore Doppler sonography is frequently the first modality used to evaluate patients with suspected hepatic vascular disorders. This chapter reviews the normal hemodynamics of the liver and then considers the sonographic assessment of portal hypertension, portal vein obstruction, hepatic vein obstruction, transjugular intrahepatic portosystemic shunts (TIPS), and hepatic artery injury.
Technique and Normal Hemodynamics
Hepatic veins
The Doppler signal from the left hepatic vein is optimized with the transducer in a subxiphoid approach. The right hepatic vein is optimized from a lateral intercostal approach near the mid axillary line. Optimization of the middle hepatic vein signal is more variable, ranging from subxiphoid to intercostal near the anterior axillary line, to subcostal. In all of these locations, the transducer is generally positioned so that forward flow in the hepatic veins (i.e., out of the liver and toward the heart) is away from the probe and is displayed below the baseline, while reversed flow (away from the heart and into the liver) is above the baseline.
With that in mind, it is easiest to understand the morphology of the hepatic vein waveform by relating it to activity in the right atrium. When the right atrium contracts, forward flow from the hepatic veins into the inferior vena cava (IVC) and right atrium slows and eventually reverses. The reversal of flow produces a short period of flow above the baseline. As the right atrium relaxes, there is relatively rapidly accelerating flow from the liver into the atrium. This is reflected in the waveform as a rapid down slope below the baseline. With progressive atrial filling, the velocity of flow from the hepatic veins into the atrium starts to slow and the Doppler signal starts to approach the baseline. This deceleration of hepatic vein outflow continues until the tricuspid valve opens. At this point there is a short period of passive atrial emptying into the ventricle, which produces a second phase of accelerating hepatic vein flow into the atrium and another down slope below the baseline. The right atrium then starts to contract, and the hepatic vein flow toward the atrium slows and eventually reverses ( Fig. 27.1 ).

It is important to recognize that deep inspiration can blunt the normal hepatic vein pulsatility and should be avoided when possible. To improve demonstration of the normal waveform morphology, it is best to obtain the waveform at the end of expiration. Specific instructions to the patient that tend to work well are “take a normal breath in, take a normal breath out, stop breathing,” and then obtain the waveform.
Predictably, right heart failure and alterations in right atrial filling and emptying cause changes in the hepatic vein waveform. In patients with right heart dysfunction, hepatic vein pulsatility increases and the retrograde pulses are exaggerated, producing a “W” shaped waveform. With tricuspid regurgitation, right ventricular contraction during systole produces retrograde flow from the ventricle into the right atrium and from the atrium into the hepatic veins. This causes an inverted systolic peak in the hepatic vein waveform ( Fig. 27.2A ).

Portal vein
The normal portal vein demonstrates continuous antegrade flow and provides approximately 75% of the blood supply to the liver. Minor degrees of respiratory phasicity can be seen, although they may be difficult to appreciate with Doppler techniques when sampling is performed during suspended respiration.
Because the hepatic sinusoids separate the portal veins from the heart, the degree of portal vein pulsatility related to cardiac activity is considerably less than the hepatic veins. However, some degree of portal vein pulsatility is normal and is well displayed on portal vein waveforms ( Fig. 27.3 ). Pulsatility can be quantified by using an index called the venous pulsatility index (VPI). The VPI is analogous to the arterial resistive index and is calculated as the difference between the maximum velocity and the minimum divided by the maximum velocity. A very pulsatile waveform, where the minimum velocity reached the baseline (i.e., 0 cm/s), would have a VPI of one. A completely nonpulsatile portal vein waveform would have a VPI of zero. Gallix et al. showed that the mean VPI was 0.48 (± 0.31) in a group of normal individuals. A VPI of 0.48 means the minimum velocity is approximately half the maximum velocity.

Another way to quantify portal flow pulsatility is a simple ratio between the minimum and peak flow. Using this approach, a flat waveform would have a portal vein pulsatility of one, and a very pulsatile waveform, where the minimum velocity dropped to the baseline, would have a portal vein pulsatility of zero. Wachsberg et al. showed that 64% of normal patients had a portal vein pulsatility of less than 0.54. That means that in a majority of patients, the minimum velocity was less than half the peak velocity. Increased pulsatility in the portal vein is more prominent in thin individuals. As with the hepatic vein pulsatility, portal flow pulsatility can be blunted by a deep inspiration.
Helical flow is occasionally seen in the portal vein. It occurs in 2.2% (3/135) of normal individuals and in 20% (8/41) of patients with chronic liver disease who are being evaluated for liver transplantation. It is also seen following liver transplantation, TIPS, and in the setting of portal vein stenosis. It is important to recognize because it can be confused with portal vein flow reversal ( Fig. 27.4 ). This pitfall can be avoided by determining the direction of blood flow both proximal and distal to the focal area of helical flow.


Right heart failure and tricuspid regurgitation may produce exaggerated portal vein pulsatility. Given the degree of pulsatility that can be seen in normal patients, however, cardiac dysfunction should probably not be considered unless the portal pulsatility is so great that the minimum velocity reaches zero or reverses (i.e., the VPI is at least one) (see Fig. 27.2B ). It is also important to correlate the portal vein waveform with other sonographic signs of heart dysfunction, including enlargement of the hepatic veins and IVC, and alterations in the hepatic vein waveform.
There is considerable variation in the reported value for normal portal vein velocity. This variation is at least partially dependent on whether the maximum velocity or the time-averaged mean velocity is being reported. Patriquin el al. found that the maximum portal vein velocity ranged from 8 to 18 cm/s in normal fasting adults and increased from 50% to 100% after eating. Haag et al. found that the normal maximum portal vein velocity was 26.5 ± 5.5 cm/s. Abu-Yousef et al. and Kok et al. found the maximum portal vein velocity ranged from 16 to 31 cm/s (mean 22 cm/s) and from 11 to 39 cm/s (mean 23 cm/s), respectively. Zironi et al. found the normal mean portal velocity was 19.6 ± 2.6 cm/s. Cioni et al. found the maximum velocity was 26.7 ± 3.2 cm/s and the mean velocity was 22.9 ± 2.8 cm/s. They considered the normal range for maximum portal vein velocity to be from 20 to 33 cm/s. This variation in the reported range of normal makes it difficult to rely on portal velocities as a sign of portal hypertension. Very low velocities are a good indicator of portal hypertension; however, velocities in the normal range do not exclude the diagnosis.
Alterations in the normal hepatic and portal vein hemodynamics in a normal pregnancy include a decrease in the maximum flow velocity and an increase in the incidence of monophasic Doppler waveforms in the hepatic and portal veins.
Hepatic artery
The hepatic artery waveform has a low-resistance profile with broad systolic peaks, gradual deceleration from systole to diastole, and well-maintained diastolic flow throughout the cardiac cycle. This is similar to that of other solid parenchymal abdominal organs (i.e., kidneys and spleen). The normal hepatic artery resistive index ranges from 0.5 to 0.7.
- •
The normal hepatic vein waveform demonstrates a triphasic pattern with retrograde flow during atrial contraction and two antegrade pulses during ventricular systole and ventricular diastole.
- •
Right heart failure and alterations in right atrial filling and emptying cause changes in the hepatic vein waveform.
- •
Normal portal veins provide approximately 75% of the liver blood supply.
- •
The normal portal vein Doppler waveform has continuous antegrade flow with mild to moderate pulsatility.
- •
Right heart failure and tricuspid regurgitation may produce exaggerated pulsatility of the portal vein waveform.
- •
There is considerable variation in the reported value for normal portal vein velocities.
- •
Very low velocities are a good indicator of portal hypertension; however, velocities in the normal range do not exclude the diagnosis.
- •
The hepatic artery waveform has a low-resistance profile similar to arteries that supply other solid parenchymal abdominal organs.
Portal Hypertension
As stated before, chronic liver disease and cirrhosis is the twelfth most common cause of death in the United States. Alcoholism is the most common reason that Americans die of cirrhosis. Cirrhosis is the most common cause of portal hypertension with >60% of patients with cirrhosis having clinically significant portal hypertension.
The precise pathophysiology of cirrhosis is unknown, but hepatic inflammation with regeneration is central to the process. Patients may be completely asymptomatic or experience complete hepatic decompensation. Mortality is largely related to complications of portal hypertension such as ascites, gastroesophageal variceal bleeding, splenomegaly, hepatorenal syndrome, spontaneous bacterial peritonitis, hepatic encephalopathy, and hepatocellular carcinoma.
Portal hypertension is defined as an increase in the pressure gradient between the portal vein and IVC or hepatic veins of 10 to 12 mm Hg or greater. The easiest way to classify portal hypertension is to divide it into intrahepatic, extrahepatic, and hyperdynamic categories. Extrahepatic portal hypertension is subdivided into prehepatic (portal vein thrombosis, compression, and stenosis) and posthepatic (hepatic vein or IVC thrombosis, compression, or stenosis). Hyperdynamic refers to arteriovenous malformations or conditions that produce high flow states such as arterial portal fistulas. Extrahepatic and hyperdynamic portal hypertension are much less common than the intrahepatic category.
Intrahepatic portal hypertension includes presinusoidal and postsinusoidal causes. Presinusoidal causes are less common in Western countries and include hepatic fibrosis, sarcoidosis, schistosomiasis, and lymphoma. Postsinusoidal causes are much more common and include cirrhosis and venoocclusive disease. Because cirrhosis is so common, it is worth focusing on the sequence of events that occurs with cirrhosis.
Cirrhosis causes hepatocellular death, parenchymal degeneration, and regeneration. This leads to bridging fibrosis that causes increased resistance to blood flow in the sinusoids and the central venules that drain the sinusoids. Initially, increased portal pressures maintain portal vein flow volume. However, as resistance to hepatic inflow progresses, it eventually equalizes with resistance to flow in portosystemic collaterals, and portal flow starts to be diverted into the collaterals.
Ultimately, the resistance to flow through the sinusoids starts to affect arterial inflow so that arterial flow is shunted away from the sinusoids and into the portal vein system. This shunting occurs at a microscopic level in the sinusoids, peribiliary plexus, and the vasa vasorum of the portal vein. Initially this produces portal vein flow reversal in isolated peripheral intrahepatic portal vein branches. As more and more peripheral branches reverse, flow in the major branches and in the main portal vein will also eventually reverse.
Venous diameter
There are a number of gray-scale ultrasound signs of portal hypertension. Engorgement of the portal vein and its tributaries is an indicator of elevated pressures ( Fig. 27.5 ). Goyal et al. prospectively compared portal vein diameter, measured at its broadest point, in 100 healthy subjects and 50 patients with portal hypertension. Keeping physiologic variables known to affect portal vein flow (such as fasting state, supine position, and deep inspiration) similar in both groups, they found that the upper limit of normal for portal vein diameter was 16 mm. Using this cutoff value, they achieved an overall sensitivity of 72%, accuracy of 91%, and specificity of 100% in diagnosing patients with suspected portal hypertension. Others have proposed 13 mm as the cutoff for the upper limit of normal portal vein diameter ; however, Stamm et al. showed that the normal mean portal vein diameter measured on computed tomography (CT) at the point of maximum diameter (at least 1 cm distal to the confluence of the splenic and superior mesenteric veins and 1 cm proximal to the first branch of the main portal vein) was 15.5 mm, which was significantly larger than the accepted upper limit of 13 mm. In addition, they found that contrast-enhanced main portal veins are significantly larger (0.56 mm) than unenhanced portal veins. Uncertainty regarding the normal value of portal vein diameter is one of the reasons that this parameter is not relied on to diagnose portal hypertension. Although it is true that an unusually large portal vein is a reliable sign of portal hypertension, it is also true that a normal-sized portal vein does not exclude the diagnosis.

If one assumes that elevated portal pressure maximizes venous distention, it follows that little or no additional distention will occur when the portal vein outflow is indirectly restricted by sustained inspiration. Lack of caliber change of the splenic and mesenteric veins during respiration has also been investigated. In one study, this approach had a sensitivity of 80% and a specificity of 100% in diagnosing portal hypertension. As with portal vein diameter measurements, this method has not gained widespread acceptance, likely because of a combination of interobserver variability and difficulties in measurement accuracy.
Portal vein blood flow velocity
Measurement of portal vein velocity is one of the Doppler techniques used to evaluate patients with suspected portal hypertension. Using a mean portal vein velocity cutoff of 15 cm/s in one study, a sensitivity of 88% and a specificity of 96% were achieved by Zironi et al. Haag et al. used a maximum portal vein velocity of 21 cm/s as their cutoff for diagnosis of portal hypertension. Along with a portal vein diameter cutoff of 12.5 mm, they reported a sensitivity and specificity of 80%. The differences in these two studies illustrate that the expected portal velocity values in normal subjects and cirrhotic patients vary considerably. Although portal velocities tend to decrease as portal pressures increase, the correlation is weak and is not statistically significant. Sources of variability include interobserver variability, intermachine variability, presence of variable collateral pathways (especially recanalized umbilical veins), and variations caused by differences in patient positioning, different phases of respiration, different states of fasting, different exercise status, and different cardiac output.
Knowing that portal vein cross-sectional area typically increases and portal velocity typically decreases in the setting of portal hypertension has led some investigators to study the ratio of these parameters, assuming that it will increase dramatically with portal hypertension. The ratio of portal vein cross-sectional area and portal velocity is known as the congestion index. Moriyasu et al. showed that the congestion index was 2.5 times higher in patients with cirrhosis and portal hypertension than in normal subjects. Sensitivities ranging from 67% to 95% have been achieved using congestion index measurements. Unfortunately, the interobserver variability in area and velocity measurements is relatively high, and this variability is compounded when the parameters are combined in a ratio. Therefore, despite the theoretical value in this approach, optimistic results obtained in highly dedicated institutions may be difficult to reproduce in other centers.
Hepatic artery and hepatic vein flow
When portal hypertension is caused by cirrhosis, hepatic artery flow may increase substantially as compensation for diminished portal vein flow. Ultimately, the bulk of liver blood flow is provided by the hepatic artery, which may become subjectively enlarged and tortuous on color flow examination and show substantially increased blood flow on Doppler interrogation ( Fig. 27.6 ). Enlarged intrahepatic arteries can simulate dilated bile ducts and produce a parallel channel sign ( Fig. 27.7 ). Unfortunately, the hepatic artery does not have the capacity to make up for the loss of portal vein flow, and persistent hepatic ischemia is a significant cause of ongoing hepatocyte damage and progression of fibrotic scarring.


Studies have shown that the normal hepatic vein pulsatility is either blunted or completely eliminated in patients with cirrhosis. In fact, a higher Child-Pugh score and decreased survival rate have been shown to correlate with complete loss of hepatic vein pulsatility. Although the presumed mechanism for this loss of hepatic vein pulsatility is unclear, impression on the hepatic veins by regenerating nodules with resulting stenosis is a likely contributing factor. More recently, Sudhamshu et al. showed there was no correlation between liver dysfunction and the patterns of hepatic venous waveforms. Specifically, they found that flat hepatic venous waveforms have no diagnostic value.
- •
Portal hypertension is defined as an increase in the pressure gradient between the portal vein and IVC or hepatic veins of 10 to 12 mm Hg or greater.
- •
Portal hypertension is divided into intrahepatic, extrahepatic, and hyperdynamic categories.
- •
Intrahepatic causes are much more common and include cirrhosis and venoocclusive disease.
- •
The upper limit of normal for portal vein diameter is 16 mm.
- •
Portal vein cross-sectional area typically increases, and portal vein velocity typically decreases in the setting of portal hypertension.
- •
With cirrhosis, the hepatic artery becomes enlarged and tortuous on color flow examination and shows substantially increased blood flow velocity on Doppler interrogation.
Portosystemic collaterals
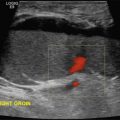
Although measurement of vessel diameters and velocities and calculation of various indices are helpful in some patients and used extensively in some institutions, the most widely used and reliable approach for the diagnosis of portal hypertension is the evaluation of portal systemic collaterals. Portal systemic collaterals can be divided into tributary and developed collaterals. Tributary collaterals are preexisting vessels that normally drain into the portal, splenic, and mesenteric venous systems. Blood flow in all tributaries should be directed toward the mesenteric, splenic, and portal veins.
The coronary vein, also known as the left gastric vein, is the most prevalent portal systemic collateral. It is identified angiographically in 80% to 90% of patients with portal hypertension. Because its presence implies an increased risk of variceal hemorrhage, it is the most clinically important of the portal systemic collaterals. The coronary vein runs parallel to the left gastric artery between the two layers of the lesser omentum. It arises along the gastric pylorus and lesser curvature of the stomach and proceeds toward the esophageal hiatus, where it forms a U-shaped loop that returns inferiorly to drain into the portal system near the portal splenic confluence ( Fig. 27.8 ).

Using the left lobe of the liver as an acoustic window, the coronary vein can be identified sonographically as a vessel communicating with the superior aspect of the portal or splenic vein in the region of the confluence. It is located directly anterior to the origin of the celiac axis, or posterior to the common hepatic artery or the splenic artery ( Fig. 27.9A and B ). It is oriented in a slightly oblique plane, traveling superiorly and to the left of the portosplenic confluence and toward the gastroesophageal junction. Normal coronary vein blood flow, like all portal tributaries, should be directed toward the portal vein (see Fig. 27.9C ).

The normal coronary vein diameter should not exceed 5 to 6 mm. In approximately 25% of patients with portal hypertension, the coronary vein will become dilated. Unfortunately, variceal hemorrhage often occurs without coronary vein enlargement. Demonstration of reversed flow in the coronary vein is a much earlier sign of portal hypertension than coronary vein enlargement. Wachsberg et al. showed that Doppler demonstration of hepatofugal flow in the coronary vein occurs in 78% of patients with portal hypertension ( Fig. 27.10 ). Evaluation of the coronary vein throughout its length will occasionally identify varices of the stomach or esophagus ( Fig. 27.11 ). The coronary vein is very important in patients with suspected portal hypertension because it may be the only visualized portal systemic collateral in up to 75% of patients. Preservation of hepatopetal coronary vein flow in patients with portal hypertension also has prognostic implications because it is associated with a lower risk of variceal hemorrhage.


Short gastric veins and branches of the superior and inferior mesenteric veins are other tributaries of the portal system that can function as portal systemic collaterals ( Fig. 27.12 ). The diagnosis of portal hypertension can be made whenever hepatofugal flow is identified in any of these vessels.


Vessels that are not normal portal tributaries but instead develop or recanalize in the setting of portal hypertension are referred to as developed collaterals. The umbilical vein is the easiest of these to identify. The remnant of the umbilical vein is located in the ligamentum teres. In some patients it can be identified in the liver as a hypoechoic band running within the fat of the ligamentum teres. It extends from the umbilicus to the anterior most aspect of the umbilical segment of the left portal vein ( Fig. 27.13 ). In normal individuals, the remnant measures less than 3 mm and contains no blood flow.


The umbilical vein is best seen by first identifying the umbilical segment of the left portal vein. The umbilical vein travels inferiorly from the umbilical segment of the left portal vein. After it exits the liver, it extends inferiorly along the abdominal wall to the umbilical area, and then extends further inferiorly to communicate with the inferior epigastric veins. Ultimately, it communicates with the iliofemoral system and in this way diverts blood back to the systemic circulation. In most patients, a recanalized umbilical vein appears as a variably sized, straight, single collateral within the central aspect of the ligamentum teres ( Figs. 27.14 and 27.15 ). As it extends inferior to the liver, however, it begins to ramify into multiple periumbilical collaterals. In some patients with unusually large collaterals, numerous and tortuous collaterals can be visualized around the umbilicus ( Fig. 27.16 ). When these periumbilical collaterals become so prominent that they are visible on physical examination, they are referred to as the caput medusa.


Gibson et al. showed that the normal remnant of the umbilical vein should not exceed 3 mm. Using this cutoff value, they were able to diagnose portal hypertension, without relying on Doppler, with a sensitivity of approximately 50%. By using Doppler and demonstrating hepatofugal flow in the umbilical vein, sensitivity increased to 80%. In fact, for diagnosing portal hypertension, sensitivity of Doppler evaluation of the umbilical vein was similar to endoscopic evaluation of varices in their population of patients.
On the basis of the description earlier, it is clear that evaluation of either the umbilical vein or the coronary vein can lead to good sensitivity in diagnosing portal hypertension. Routinely scanning for both potential collaterals will only increase sensitivity. Although these two collaterals are the easiest and most productive to analyze, there are other collaterals that can be detected sonographically, albeit with more difficulty in some cases. These include short gastric, splenoretroperitoneal, splenorenal, superior mesenteric, and inferior mesenteric collaterals. Large spontaneous portal systemic collaterals from the splenic hilum or capsule to the left renal vein are known as splenorenal shunts. It is often difficult to trace these collaterals in continuity from the splenic vein to the renal vein. Fortunately, the detection of an enlarged left renal vein and multiple collaterals around the splenic hilum is generally enough to make the presumptive diagnosis of a splenorenal collateral ( Fig. 27.17 ). Splenoretroperitoneal collaterals communicate with lumbar veins, perivertebral vessels, or gonadal vessels. Superior mesenteric collaterals communicate with pancreaticoduodenal veins and retroperitoneal/perivertebral veins. Inferior mesenteric collaterals communicate with retroperitoneal veins and hemorrhoidal veins. The inferior mesenteric vein often drains into the superior mesenteric vein immediately inferior to the splenic vein. In such cases, reversal of flow in the inferior mesenteric vein can be confused with the reversed flow in the splenic vein (see Fig. 27.12B to D ).


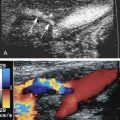
Portal vein flow reversal
As portal hypertension progresses, blood flow reversal occurs in the portal veins. This initially occurs first in peripheral portal vein branches. This is easily detected with color Doppler because portal vein flow will be in the opposite direction of the accompanying hepatic arterial flow, so that adjacent parallel vessels are color coded in red and blue ( Fig. 27.18A ). The reversal of portal flow can be confirmed with pulsed Doppler by documenting venous and arterial flow on opposite sides of the baseline (see Fig. 27.18B ). Eventually, as flow reverses in more portal vein branches, the main portal vein also reverses ( Fig. 27.19 ). Reversal of flow in the main portal vein typically indicates that portal hypertension is severe. It is usually not seen in the early stages of portal hypertension, and it is very important to realize that most patients with portal hypertension maintain antegrade flow in the main portal vein.


In addition to reversed flow, sluggish portal flow may alternate between antegrade and retrograde flow and is another sign of portal hypertension. The alterations in flow direction may occur with the respiratory cycle or may be seen by varying the amount of pressure exerted on the liver by the transducer.
Additional signs of portal hypertension
Park et al. found statistically significant correlation between elevated hepatic artery velocities and increasing model for end-stage liver disease (MELD) scores, splenomegaly, and the presence of ascites in patients with chronic liver disease. Patients with a hepatic arterial velocity of greater than 160 cm/s can be confidently predicted to have a high MELD score with an odds ratio of 42 and a positive predictive value of 94%.
Lee et al. compared the diagnostic accuracy of the splenic arterial resistive index with measurements of liver stiffness for the purpose of identifying patients with clinically significant portal hypertension. They showed that splenic arterial resistive index was strongly correlated with the hepatic venous pressure gradient and suggested it was an excellent noninvasive measurement for diagnosing clinically significant portal hypertension.
Contrast-enhanced ultrasound is considered an imaging modality offering new perspectives for the diagnosis of liver disease. One such technique is the use of hepatic vein arrival time measured by contrast-enhanced ultrasonography. Kim et al. conducted a systemic review and meta-analysis of 12 studies published before July 2015 and showed that measuring the hepatic vein arrival time by contrast-enhanced ultrasound is a reliable noninvasive technique for the detection of cirrhosis. There is an inverse relationship between the hepatic vein arrival time and liver histologic grade such that a decrease in hepatic vein arrival time is accompanied by an increase in the severity of liver fibrosis. The proposed hypothesis for the decreased hepatic vein arrival time in cirrhosis relates to the formation of intrahepatic arteriovenous or portovenous shunts in the cirrhotic liver.
Alempijevic et al. studied the value of adding transient liver elastography to Doppler parameters such as hepatic artery diameter, hepatic artery systolic and diastolic velocity, splenic artery velocity, and splenic artery resistive index. They found that the prediction of significant liver fibrosis (≥F2) improved by combining Doppler parameters with laboratory markers and transient elastography (sensitivity 88.9%, specificity 100%) over Doppler parameters alone (sensitivity 75%, specificity 60%).
In summary, the combination of gray-scale sonography, Doppler, laboratory markers, and advanced sonographic techniques such as contrast-enhanced ultrasound and elastography are valuable means of investigating suspected portal hypertension. Familiarity with the diagnostic implications and limitations of a variety of morphologic and hemodynamic alterations seen on gray-scale and Doppler findings are important in optimizing the sonographic analysis of these patients .
Related posts:
 Doppler Flow Imaging and Spectral Analysis
 Ultrasound Diagnosis of Lower Extremity Venous Thrombosis
 Evaluating Carotid Plaque and Carotid Intima-Media Thickness
 Risk Factors and the Role of Ultrasound in the Management of Extremity Venous Disease
 Ultrasound in the Assessment and Management of Arterial Emergencies
 Evaluation of Organ Transplants
Stay updated, free articles. Join our Telegram channel

Full access? Get Clinical Tree


