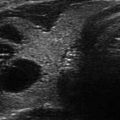
Figure 16.1
(a–d) Three dif ferent strain elastography images of a solid isoechoic right thyroid nodule measuring 37 × 17 × 18 mm; FNAB was positive for PTC. The result for all three maps showed similar result and suggestive of a hard thyroid nodule
Several factors can affect the quality of the images including motion of the patient during the exam, respiratory motion, the location of thyroid nodules, and the practitioner’s experience. The presence of fluid or calcifications in a thyroid nodule can also create conflicting results. During the examination, the US monitor may show continuously changing images, similar to a video.
How to Grade Strain Elastography Images
One of the challenges of strain elastography is how to grade an image. There are different approaches to grading strain elastography images. Different authors have divided these images into four or five different groups [4, 19–21]. In this chapter, we present our four-group scoring system to grade strain elastography images. We have been using this grading system routinely since January 2010 and are able to explain the discrepancies in interpretation. In the past few years, we worked with several different US machines, and our elastography classification system was useful regardless of which US manufacturer was used for strain elastography exam. Figures 16.2, 16.3, 16.4, and 16.5 illustrate different strain elastography scores (ES) using color map 1.
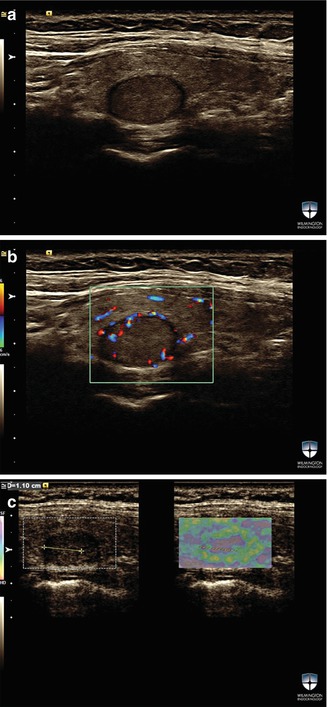
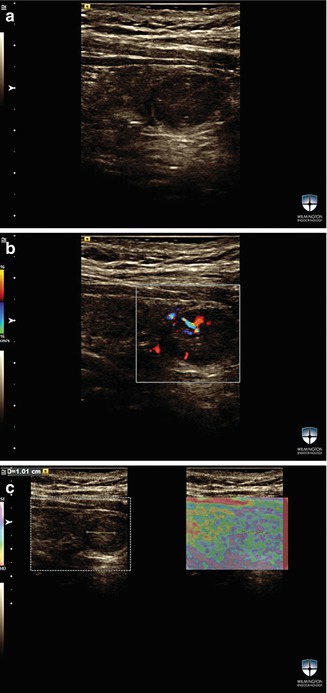
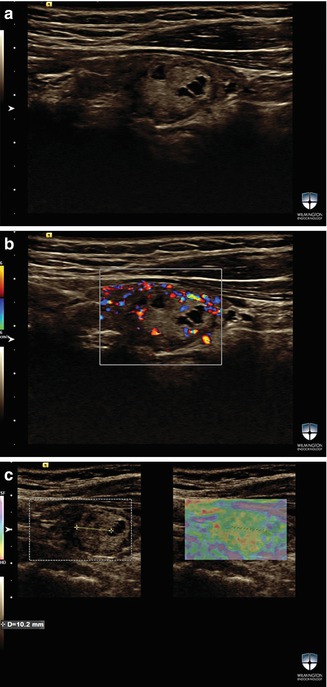
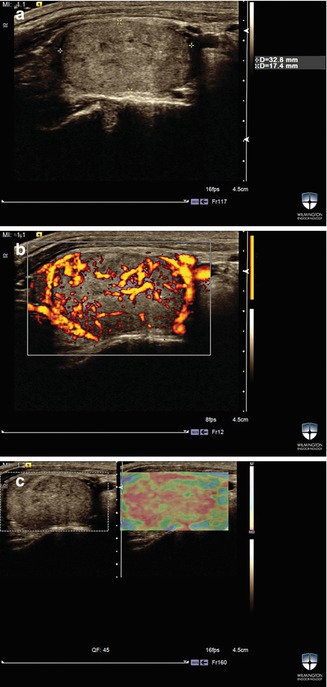
Figure 16.2
(a–c) A solid thyroid nodule w ith strain elastography score ES0. The stiffness of this solid nodule is less than the surrounding thyroid tissue. FNAB of this nodule was benign
Figure 16.3
(a–c) A strain elastography image of a solid isoechoic thyroid nodule with ES1. FNAB for this nodule was benign
Figure 16.4
(a–c) An example of a thyroid nodule wit h ES2. This nodule is isoechoic and complex but mainly solid. FNAB for this nodule was benign
Figure 16.5
(a–c) An example of ES3; FNAB of this solid vascular thyroid nodule was suspicious for follicular neoplasm. The surgical pa thology was suggestive of follicular cancer
In the more frequently used color map, the color red represents hard or stiff tissue and the color purple represents soft or elastic tissue. The color green indicates the median stiffness. In our experience, most benign thyroid nodules are either purple or green. B-mode image and elastography image are displayed next to each other. For our study, an elastography score of ES0 was assigned to a thyroid nodule with more elasticity than surrounding thyroid tissue, for example, when a nodule is purple and the surrounding thyroid tissue is green. These nodules are uncommon (5% of total thyroid nodules) and have very low risk for malignancy (<3%). ES1 represents the largest group (about 60–65%) of thyroid nodules. In this group, both the thyroid nodule and the surrounding thyroid tissue have green appearance. This category of thyroid nodules also has a low risk for malignancy (<3%).
ES2 represents the yellow-orange thyroid nodules with intermediate risk for malignancy. This group of nodules has slightly higher tissue stiffness than their surrounding thyroid tissue, and the risk for malignancy is approximately 7.7%. ES3 was assigned to thyroid nodules with little or no elasticity (hard) and included all thyroid nodules that had over 30% red color on elastogram. This group is considered as high risk for malignancy, and the prevalence for thyroid cancer was 36%. However, if a thyroid nodule only had a small amount of red color on elastogram (between 1 and 30% of the thyroid nodule), the nodule was considered as ES2 or intermediate risk for malignancy.
Artifacts on Elastography Images
The presence of thyroid fibrosis and severe heterogeneity (as seen in autoimmune thyroiditis) can cause increased tissue stiffness and subsequent higher elastography scores. The image of both the thyroid nodule and the surrounding thyroid tissue can present as red color affecting a large part of the thyroid gland beyond the nodule under investigation. Figure 16.6 shows an example of a strain elastography image of a thyroid nodule with diffuse artifact surrounding the lesion. In this case, the complete gland was red or hard in color map 1. FNAB showed a benign cytopathology.
Figure 16.6
(a–c) A complex thyroid nodule . This patient has a history of hypothyroidism for many years. Strain elastography image shows diffuse red color throughout the right thyroid lobe, indicating artifact
Elastography Exam Technique
The elastography exam should follow the B-mode exam of the thyroid gland and nodule(s). The entire thyroid lobe should be included in region of interest (ROI) box . The US probe should be placed longitudinally. First, the thyroid nodule should be identified with B-mode US. The patient should not swallow or breathe for 5 s during exam. The elastography exam should be repeated at least twice, to confirm that the studies are similar. If the results of the studies are inconsistent or conflicting, this may indicate artifact due to poor exam technique , Hashimoto thyroiditis in the thyroid parenchyma, and/or possible heterogeneity within the thyroid nodule. A 2D image only provides information about one layer of a thyroid gland and nodule. The location of a thyroid nodule can affect the elastography exam as well. For example, close proximity to carotid, trachea, or isthmus may interfere with elastography and may result in false positive interpretation.
Shear Wave Elastography
In shear wave elastography a separate ultrasound pulse is delivered at an angle to the imaging US waves [22–24]. One such technique is referred to as acoustic radiation force impulse (ARFI ). The propagation velocity of this pulse is calculated and reported in meters per second (m/s) or converted to a measurement of stiffness reported as kilopascals (kPa) that is proportional to the square of the velocity (kPa = 3pc 2; where c is the shear wave speed in m/s and p is the tissue density constant) [24]. Unlike strain elastography, shear wave elastography does not require manual compression techniques and it is less operator-dependent [25]. A number of different studies have applied this technology to risk stratification of thyroid nodules [6–9, 25–29].
One early shear wave technology, referred to as virtual touch quantification (VTQ) , could produce quantitative tissue velocity data but did not provide a qualitative map that could demonstrate the heterogeneity within the thyroid nodule. VTQ measures an average elasticity within a region of interest (ROI) measuring 6 × 5 mm. Figure 16.7 shows a solid hypoechoic thyroid nodule with shear elastography measurement using VTQ software. Two recent studies showed that VTQ was useful in differentiating between benign and malignant thyroid nodules [7, 9]. In the larger of these studies, Xu et al. prospectively examined 441 thyroid nodules in 375 patients with VTQ and determined that the best cutoff to differentiate benign from malignant thyroid nodules was a SWV of 2.87 m/s [7]. The disadvantage of this technology is that heterogeneity in stiffness within a thyroid nodule cannot be easily evaluated.
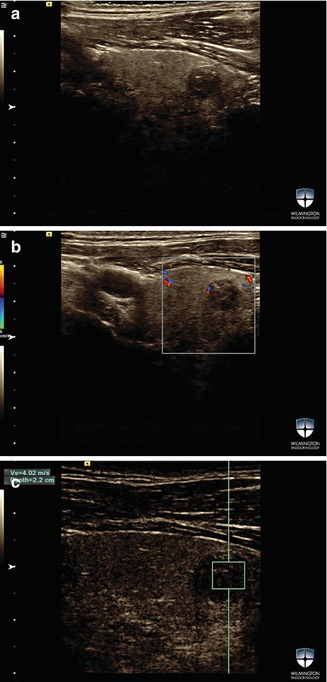
Figure 16.7
(a–c) A solid hypoechoic t hyroid nodule in the left thyroid lobe. B-mode image SWV measurement was performed with VTQ software. SWV for this nodule was 4.02 m/s. FNAB was suspicious for malignancy. Surgical pathology showed 10 mm follicular variant of PTC
Advances in shear wave technology now provide qualitative images that reflect the heterogeneity of stiffness within the thyroid nodule and allow for measurement of tissue stiffness in specific areas of the nodule. The tissue stiffness is expressed qualitatively throughout the entire nodule and surrounding tissue. Continuous images are recorded as video clips. The size of the elastography box should encompass both the thyroid nodule under investigation and the surrounding tissue. After the shear wave image is taken, the ROI box can be modified to measure the stiffness of the entire thyroid nodule or the stiffest area within the thyroid nodule. The software can calculate maximum, median, minimum velocity within the ROI box, defined as area of interest by examiner, who determines which elastography images to select.
Figures 16.8 a nd 16.9 sh ow two different examples of SWE images with one such device. In two relatively small studies, this technique has been used to estimate the risk of thyroid cancer in thyroid nodules [6, 25]. Both studies evaluated the performance of SWE in patients that had been preselected for surgery, so large prospective studies are necessary. While the second study reported the measurement of the stiffest part of the thyroid nodule, the first study did not specify how the region of interest was determined.
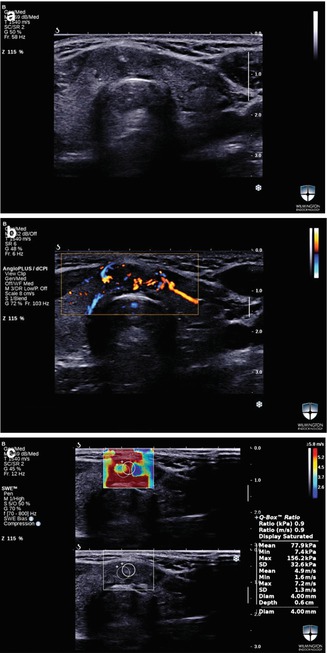
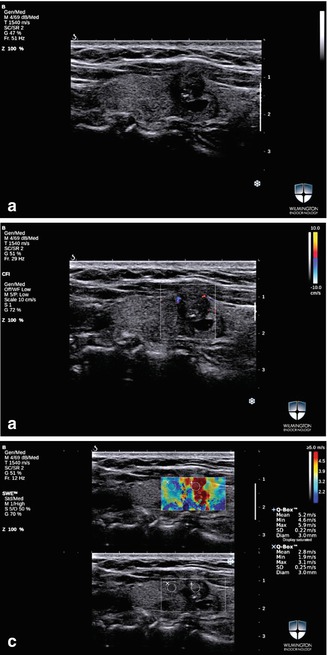
Figure 16.8
(a–c) SWE image of a solid thyroid nodule in the isthmus . Max and mean SWV were 156.2 kPa and 77.9 kPa, respectively. The instant conversions for these values in m/s were 7.2 m/s and 4.9 m/s for max and mean SWV. FNAB was diagnostic for PTC. The surgical pathology report confirmed the diagnosis
Figure 16.9
(a–c) B-mode and SWE images of a thyroid nodule measuring 10 mm. Max SWV and mean SWV for this lesion were 5.9 m/s and 5.2 m/s, respectively. FNAB was read as suspicious for malignancy. The surgical pathology showed a 10 mm PTC
Another technique employing shear wave technology referred to as virtual touch imaging quantification (VTIQ ) was approved for use in the United States in 2013 [24] and has been studied more extensively for the evaluation of thyroid nodules. This method creates qualitative and quantitative shear wave images in one display. Figure 16.10 shows examples for qualitative and quantitative SWE images using VTIQ software. In our prospective study using VTIQ, we evaluated 707 thyroid nodules in 676 patients with FNAB [8]. Conventional US exam was performed prior to SWV measurement. The transducer was held in the longitudinal axis, and the patient was instructed to refrain from swallowing and breathing for 3–5 s. A qualitative shear wave image was created next to B-mode image, and the SWV was measured quantitatively with a ROI box of 1.5 × 1.5 mm. The qualitative stiffness map guided the practitioner to measure the area with highest SWV. The exam was performed three times. The best cutoff to distinguish between benign and malignant thyroid nodules was 3.54 m/s [8].
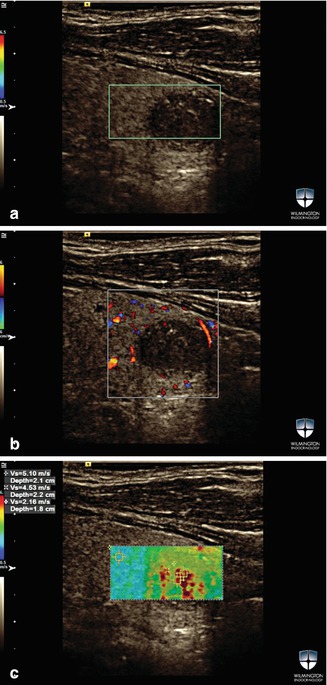
Figure 16.10
(a–c) A solid thyroid nodule with foci of microcalcifications . The max SWV for this nodule using VTIQ was 5.1 m/s and 4.53 m/s. Tissue velocity was 2.53 m/s. FNAB for this nodule was suspicious for malignancy. The surgical pathology showed a 10 mm PTC
Discussion
Studies of Strain Elastography and Shear Wave Elastography
Several recent studies have demonstrated that both strain elastography and SWE predict thyroid cancer risk independently of other ultrasound characteristics. Strain elastography technology can only produce qualitative images and is not capable of quantifying stiffness. This technology is more subjective and is more operator-dependent than SWE. The image can be difficult to reproduce in certain thyroid nodules with mixed tissue stiffness. There is no consensus regarding color map classification and how much pressure to apply when creating strain elastography images.
The largest prospective study of strain elastography, by Azizi et al., was reported on a population with 9% prevalence of thyroid cancer [4]. There were 86 malignant thyroid nodules. Strain elastography was a significant predictor of thyroid cancer (p = 0.0001). By multivariate regression analysis, the independent predictors of thyroid cancer were elastography score, microcalcifications, hypoechogenicity, and isthmus location. The positive predictive value (PPV ) of ES was 36.1%, which was similar to the PPV of microcalcifications (35.9%), but greater than hypoechogenicity (13.6%) and isthmus location (16.9%). The negative predictive value (NPV) of ES was 97.2%, which was better than any other predictors of benignity. In this study the sensitivity and specificity for thyroid nodules with an elastography score of 3 (the group with the highest stiffness) for the diagnosis of malignancy were 77.0% and 85.2%, respectively. The NPV of 97.2% for strain elastography was greater than all conventional US criteria [4].
Related posts:

Stay updated, free articles. Join our Telegram channel

Full access? Get Clinical Tree


