and Lori Ann Lewis1
(1)
Clinical Research Center of North Texas, Denton, TX, USA
Canadian Association of Radiologists and Osteoporosis Canada (CAROC) Fracture Risk Assessment System
Abstract
One of the most important uses of the bone density measurement is the prediction of the patient’s fracture risk. In the past, the statistical measure called relative risk (RR) was employed to convey the patient’s risk of fracture to the treating physician as well as to the patient. This resulted in statements such as “the patient’s risk of spine fracture is increased fourfold” or the “patient’s RR of spine fracture is 4.0.” Although this was the best that previously could be done, such statements actually conveyed little useful information. If a patient’s risk of spine fracture is increased fourfold, what does that really mean? The risk of fracture is fourfold greater than what? And while a fourfold increase in fracture risk sounded dire, it might not be. If the unstated baseline risk was extremely small, a fourfold increase in that extremely small baseline risk is still going to be very small. For this reason, the expression of a patient’s fracture risk in clinical practice as absolute risk (AR) is overwhelmingly preferred. The use of RR is considered obsolete and inappropriate. The utility of RR as a statistical expression of risk is unquestioned in clinical trials, but it has no role in clinical practice in the interpretation of DXA bone density data.
One of the most important uses of the bone density measurement is the prediction of the patient’s fracture risk. In the past, the statistical measure called relative risk (RR) was employed to convey the patient’s risk of fracture to the treating physician as well as to the patient. This resulted in statements such as “the patient’s risk of spine fracture is increased fourfold” or the “patient’s RR of spine fracture is 4.0.” Although this was the best that previously could be done, such statements actually conveyed little useful information. If a patient’s risk of spine fracture is increased fourfold, what does that really mean? The risk of fracture is fourfold greater than what? And while a fourfold increase in fracture risk sounded dire, it might not be. If the unstated baseline risk was extremely small, a fourfold increase in that extremely small baseline risk is still going to be very small. For this reason, the expression of a patient’s fracture risk in clinical practice as absolute risk (AR) is overwhelmingly preferred. The use of RR is considered obsolete and inappropriate. The utility of RR as a statistical expression of risk is unquestioned in clinical trials, but it has no role in clinical practice in the interpretation of DXA bone density data.
Relative Fracture Risk in Clinical Trials
The studies that conclusively established the predictive capabilities of bone mass measurements for fracture risk generally reported the data as the increase in RR per standard deviation decline (SD) in bone density. Statistically, relative risk is the best indicator of the strength of the relationship between a risk factor (in this case, low bone mass or density) and an outcome (fracture). It is understandable, therefore, that much of the information in the medical literature about the utility of bone mass measurements in predicting future fracture risk is presented in the form of RR values. For example, in one prospective study [1], the RR for global fracture risk1 was 1.6 per SD decline in bone density at the femoral neck, while the RR for spine fracture specifically was greatest at the spine itself at 2.2 but also significantly increased at the femoral neck, at 2.0. In another major clinical trial [2] called the Study of Osteoporotic Fractures (SOF), the site-specific2 RR for hip fracture was significantly increased for bone density measured at the femoral neck or total hip, with a RR of 2.7 and 2.6 per SD decline in BMD, respectively.
Relative risk is calculated from absolute risk (AR) data that are collected during prospective fracture trials. The ratio of the absolute risk for fracture between two groups constitutes the relative risk for fracture between the two groups. A relative risk of one implies that there is no difference in risk between the groups because the absolute risk for each group must be the same for their ratio to equal 1. It is possible that both groups have a high or low absolute risk, but the risk of one group is no greater than the risk of the other group. Relative risk data thus obscures the actual magnitude of the absolute risk for either group. For example, if the absolute risk for fracture in group A is 50 % and the absolute risk for fracture of 25 % in group B, the relative risk of group A compared to group B is 2 (50 % ÷ 25 % = 2). This would be interpreted to mean that the risk in group A is twofold greater than group B’s. The relative risk would also be 2, however, if the absolute risk in group A was only 2 % and the absolute risk in Group B was only 1 % (2 % ÷ 1 % = 2). The interpretation is unchanged. Group A has a twofold greater risk of fracture than group B.
The other major role of relative risk data in clinical trials evaluating the fracture risk prediction capability of bone densitometry is in establishing which skeletal sites have the best predictive power for certain types of fracture risk. The site that has a statistically significantly greater increase in RR for fracture per SD decline in bone mass or density will be the skeletal site that has the best predictive power for that type of fracture risk prediction. It is on this basis that certain skeletal sites may be preferred over others when the fracture risk for a specific type of fracture is desired. For example, in the study from Cummings et al. [2], the regions of interest in the proximal femur were statistically superior based on their RR values for the prediction of hip fracture risk in comparison to the RR values seen at the spine for hip fracture risk.
Absolute Fracture Risk in Clinical Practice
Absolute risk is far more useful in clinical practice. This is the actual risk for the individual in question. When applied in bone densitometry, there are really only two modifiers that are applied to absolute risk. The first is over what time frame the particular risk applies and the second is the type of fracture to which the absolute risk value applies.
For example, an absolute risk prediction may be a risk prediction for a short period of time, such as 1 year or even 5 years. More commonly, absolute risk predictions cover a period of 10 years. The type of fracture to which the absolute risk prediction applies may also vary. An absolute risk prediction may be a risk prediction for hip fracture or spine fracture specifically, or it may encompass any and all types of osteoporotic fractures with such a risk prediction termed a “global” risk prediction. The risk prediction tools discussed in this chapter can all be utilized to provide absolute risk predictions. Although the statistical methodology and data used to create the different tools vary, they all provide absolute fracture risk predictions that are unquestionably superior to relative risk fracture predictions in clinical practice.
Absolute Fracture Risk Prediction Tools
Four absolute fracture risk prediction tools are discussed below. All fracture risk prediction tools are, in a sense, “crystal balls.” Ultimately, no one can predict with the utmost certainty who will fracture and who will not. But these tools are extremely sophisticated, highly complex “crystal balls” which have elevated the clinical ability to predict fracture risk and refine the identification of the patient at risk for fracture. The four tools are FRAX®, the FORE FRC, CAROC, and the Garvan Fracture Risk Prediction Tool.
FRAX®
FRAX® is a 10-year absolute fracture risk prediction algorithm developed by the World Health Organization. FRAX® is the result of an extraordinary effort to use easily obtainable clinical risk factors with or without femoral neck BMD to predict the absolute 10-year probability of hip fracture specifically or major osteoporotic fracture (spine, hip, humerus, and wrist) in general. FRAX® became available in 2008 and has rapidly become the predominant method for the prediction of fracture risk.
FRAX® is widely available. It is still freely accessible on the Internet and is also available as an “app” for various “smart” devices such as the iPhone and iPad. There is also a stand-alone desktop application which can be purchased. FRAX® has also been incorporated into some versions of DXA software. When accessed on the Internet at http://www.shef.ac.uk/FRAX/, the initial webpage appears as shown in Fig. 8-1. When the mouse cursor is placed over the heading “Calculation Tool,” a drop-down menu appears that allows the user to choose among six geographic regions. Placing the mouse cursor over North America enables the user to choose between Canada and the United States. The tool for Japan is found under the drop-down list for Asia, and the tool for Australia is found in the drop-down box for Oceania. In the case of the United States, four calculation tool options are ultimately available: US Caucasian, US Black, US Hispanic, and US Asian. Clicking with the left mouse button on one of these options results in the appearance of the chosen FRAX® algorithm. Figure 8-2 illustrates the FRAX® screen that appears when US Caucasian is chosen.

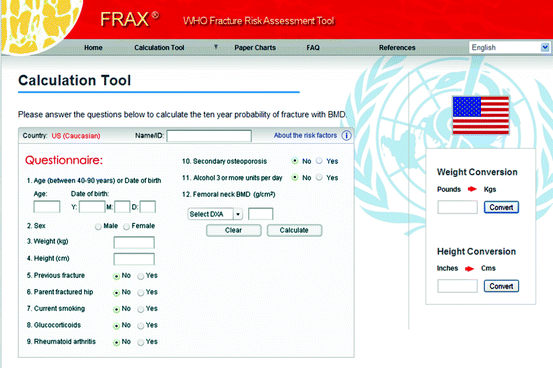

Fig. 8-1.
The FRAX® welcome screen. To choose the appropriate calculation tool, the user must click on the box labeled “Calculation Tool”.

Fig. 8-2.
The FRAX® data entry screen. Note the conversion utilities on the right for weight and height. The default response for risk factors 5 through 11 is no.
It is not necessary to enter the patient’s name or ID in order to use the web-based FRAX®, but there are 11 entries that are required for the calculation with the 12th, the femoral neck BMD or T-score, being optional. FRAX® can be used to predict fracture risk on the basis of clinical risk factors only, without BMD. The entry of these 12 items is the same when FRAX® is utilized on the iPhone or iPad. The first item is the patient’s age or birth date. Either one may be entered. Both are not necessary. Item 2 asks the user to click on the appropriate radio button for gender as FRAX® can be used to predict fracture risk for women or men. Items 3 and 4 capture weight and height. It is important to note that weight and height must be entered in kilograms (kg) and centimeters (cm). To the right of the web-based FRAX® screen are conversion calculators for original measurements made in pounds and inches. Once the conversion is complete, the data in kg and cm will be automatically entered in items 3 and 4. Items 5–11 are questions about specific clinical risk factors. By default, the radio button for “no” is already selected when the calculation tool initially appears. If necessary, change the appropriate radio button to “yes” simply by clicking on it. This will automatically remove the default selection of “no.” Finally, if the femoral neck BMD is available, that should be entered as in item 12. This is done by left-clicking on the down arrow next to the “Select DXA” box. It is highly recommended that users select the manufacturer of the DXA device that was used for the study from the drop-down list and then enter the actual femoral neck BMD in g/cm2 rather than selecting the T-score option. The reasons for this will be discussed later.
Once the data are entered, use the left mouse button to click on “Calculate.” The algorithm then calculates the 10-year probability of hip fracture and the 10-year probability of a major osteoporotic fracture (clinical or symptomatic spine fracture, forearm fracture, proximal humerus fracture, and hip fracture) as shown in Fig. 8-3. Finally, the small printer icon may be clicked to print the completed FRAX® calculation.
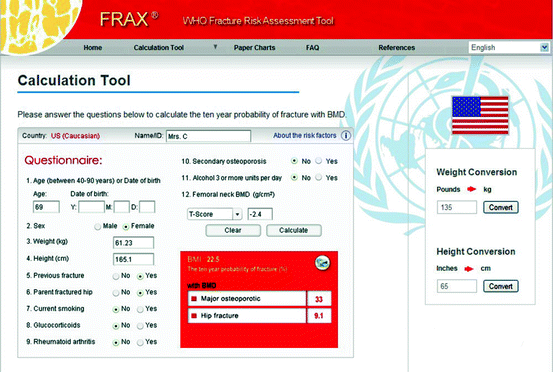

Fig. 8-3.
The FRAX® data entry screen completed. After the data are entered and the user clicks on “Calculate,” the 10-year risks are shown in the box on the lower right of the screen.
The clinical risk factors that were included in the FRAX® model were chosen after extensive reviews and meta-analyses of the medical literature in order to establish the magnitude of the relationship between the risk factor and fracture risk [3–9]. Ultimately, the data used to create FRAX® came from nine different study cohorts3 around the world. The data was subsequently validated in 11 other cohorts in similar geographic locations [10]. Two additional principles were applied to the choice of the risk factors for inclusion in the final FRAX® algorithm. The first principle was that the risk imparted by the risk factor would be favorably modified by a therapeutic intervention [11]. This data was available for BMD, age, gender, prior vertebral fracture, and glucocorticoids. In the absence of data showing that the risk was favorably modified by a therapeutic intervention, the second principle was that the risk factor must not be known to adversely affect the fracture risk reduction efficacy of an intervention. The specific risk factors that were ultimately chosen are known as the “WHO 8”: age, body mass index (BMI), prior fracture, parental hip fracture, current smoking, glucocorticoid use, rheumatoid arthritis, and excessive alcohol consumption.
The FRAX® algorithm will accept an age value of 40–90. The BMI is automatically calculated from the data entered for height and weight. Some of these risk factors required additional explanation. “Prior fracture” refers to a fracture occurring as an adult in which the fracture appears to have occurred spontaneously or as a result of a level of trauma which would not result in fracture in a healthy individual. The subjectivity of this assessment is unavoidable. This risk factor captures prior morphometric spine, clinical spine, non-spine, and hip fractures. It is recognized that a “yes” response cannot convey the number, location, or severity of any preexisting fractures [11]. As noted in the ISCD-IOF 2010 Official Positions on FRAX® found in Appendix D, if multiple fractures have occurred, the algorithm may underestimate the 10-year fracture probability. The algorithm may also underestimate the 10-year fracture probability in the setting of severe vertebral fracture as opposed to mild or moderate vertebral fractures.
Note that the risk factor for smoking is for current smoking, not a history of past smoking. Although there is evidence that the amount and duration of smoking may have an effect on fracture risk, this increment in risk cannot be captured within FRAX®. Glucocorticoid use may refer to current or past use of 3 months duration or more. According to the instructions that accompany the algorithm on the website, the dose of corticosteroids used for at least 3 months that would prompt a “yes” response is a dose of ≥5 mg of prednisolone or its equivalent. However, as noted in the ISCD-IOF 2010 Official Positions on FRAX® in Appendix D, if the dose is >7.5 mg, FRAX® may underestimate fracture risk attributable to corticosteroid usage. In addition, if the patient reports treatment of 3 months or longer with 2.5 mg daily of prednisolone or its equivalent, a “yes” response could be entered as well with the expectation of the contribution of corticosteroid use to fracture risk being appropriately calculated. Because fracture risk may be underestimated with doses of prednisolone or its equivalent of 7.5 mg daily or greater, a method for the adjustment of the FRAX® 10-year risk prediction was proposed by Kanis et al. in 2011 [12]. This is shown in Table 8-1. The reason that the change in fracture risk with larger doses of corticosteroids goes down with increasing age is because exposure to corticosteroids increases the risk of death. For example, assume that the 10-year probability of major osteoporotic fracture was calculated to be 17 % in a 70-year-old individual who has been taking 10 mg of prednisolone per day for 6 months. In entering data in FRAX®, the “yes” radio button would be clicked for risk factor 8, “glucocorticoids.” Realize, however, that this patient is taking a dose of glucocorticoids that is greater than considered in FRAX®. Based on Table 8-1, this 10-year risk of major osteoporotic fracture of 17 % should be increased by 15 %, resulting in a 10-year major osteoporotic fracture probability of 19.55 %. The data in Table 8-1 come from studies of the population in the United Kingdom and thus are not directly applicable to populations from other countries. They serve to illustrate, however, the need to appreciate the limitations of dichotomous variables and how an understanding of a patient’s medical history may alter their fracture risk.
Table 8-1
Percentage adjustment of 10-year probabilities of a hip fracture or a major osteoporotic fracture by age according to dose of glucocorticoids
Dose prednisolone equivalent (mg/day) | Age (years) | |||||||
|---|---|---|---|---|---|---|---|---|
40 | 50 | 60 | 70 | 80 | 90 | All ages | ||
Hip fracture | ||||||||
Low | <2.5 | −40 | −40 | −40 | −40 | −30 | −30 | −35 |
Mediuma | 2.5–7.5 | |||||||
High | >7.5 | +25 | +25 | +25 | +20 | +10 | +10 | +20 |
Major osteoporotic fracture | ||||||||
Low | <2.5 | −20 | −20 | −15 | −20 | −20 | −20 | −20 |
Mediuma | 2.5–7.5 | |||||||
High | >7.5 | +20 | +20 | +15 | +15 | +10 | +10 | +15 |
Rheumatoid arthritis is considered separately from other causes of secondary osteoporosis. This is because rheumatoid arthritis was found to impart a fracture risk that was independent of the BMD [5


Stay updated, free articles. Join our Telegram channel

Full access? Get Clinical Tree


