Vascular diseases of the arterial and venous systems affect a large percentage of the world population. Most vascular disorders share similar risk factors and are associated with cardiac disease. Others indirectly impact cardiovascular performance by affecting preload and afterload. Multimodality imaging is essential to establish the anatomic and functional diagnosis and help in guiding therapy. In this chapter, we will review the most common vascular conditions affecting the aorta, carotid, renal and peripheral arteries and the venous systems and the specific indications for ultrasound, computed tomographic angiography (CTA), magnetic resonance angiography (MRA) and nuclear scintigraphy.
Carotid Artery Disease
Clinical Overview
Every year, more than 795,000 people are diagnosed with a stroke in the United States, about 610,000 of these are first or new and 87% ischemic. Stroke-related costs in the United States amounted to nearly $53 billion between 2017 and 2018. This total included the cost of healthcare services, medicines to treat stroke, and missed days of work. Atherosclerosis of the internal carotid artery (ICA) at the bifurcation accounts for 10%–12% of all ischemic strokes. Progression of atheromatous plaque at the carotid bifurcation results in luminal narrowing, often accompanied by ulceration. This process can lead to ischemic stroke or transient ischemic attack (TIA) from embolization, thrombosis, or reduced brain perfusion (more likely in the setting of bilateral disease). The location most frequently affected by carotid atherosclerosis is the carotid bifurcation, often with extension into the proximal ICA (i.e., the origin).
Symptomatic extracranial carotid atherosclerotic disease refers to onset of neurologic symptoms in the ipsilateral distribution of the diseased carotid artery, including one or more TIAs characterized by focal neurologic dysfunction or transient monocular blindness, or one or more ischemic strokes within 6 months of diagnosis.
Methods for evaluating lesion severity differ in technique and accuracy. The two most used methods in current practice are the North American Symptomatic Carotid Endarterectomy Trial (NASCET) method and the European Carotid Surgery Trial method. In current daily practice and research purposes, there are several imaging techniques and modalities for diagnosis of stroke and cerebrovascular disorder. This section will review the most common imaging modalities used in cardiology to evaluate extracranial disease.
Diagnostic Strategy and Therapeutic Implications
Carotid duplex ultrasound is an accurate noninvasive technique that uses color and spectral Doppler evaluation of blood flow combined with grayscale imaging of plaque to determine the presence and severity of ICA stenosis ( Fig. 13.1 ). When compared with angiography, the sensitivity and specificity of predicting ICA stenosis are both high (>90%), but vary with disease prevalence, stenosis severity categories, and the velocity spectra criteria used. To bring standardization to carotid duplex testing, the Intersocietal Accreditation Commission of vascular laboratories has recommended use of the Society of Radiologists in Ultrasound Consensus Conference criteria for ICA stenosis severity. The interpretation criteria are based on carotid artery bifurcation imaging and pulsed Doppler velocity spectra analysis with measurements of peak systolic and end-diastolic velocity from the diseased ICA and peak systolic velocity (PSV) ratio calculated from the nondiseased common carotid artery (CCA) and the site of maximum ICA stenosis, Table 13.1 . The duplex ultrasound instrumentation required for carotid testing should include multifrequency (3−10 MHz) high-resolution transducers with capabilities of grayscale imaging, color/power Doppler imaging, and pulsed Doppler spectral analysis. In general, a 5- to 10-MHz linear-array transducer will provide excellent vessel wall imaging for disease detection and, with electronic beam steering, permit pulsed Doppler velocity spectra recording at the recommended ≤60-degree Doppler angle. Measurements of PSV and end diastolic velocity (EDV) are recorded at multiple sites from the CCA, external carotid (ECA), and ICA. In regions of pathology, spectral waveforms should be recorded proximal, within, and distal to the lesion. Measurement of the ICA/CCA PSV ratio should be calculated from a nondiseased CCA site (3−4 cm proximal to the carotid bifurcation) and the highest ICA PSV representative of the stenosis. In the presence of stents, similar locations should be interrogated. If intimal thickening is identified, measurement of intima-medial thickening (IMT) and the presence of atherosclerotic plaque (IMT >1.5 mm) should be done since these plaques are at higher risk of stroke and medical management should be intensified in these individuals, Fig. 13.2 . Because of its accuracy, safety, availability, and low cost, duplex ultrasound is the first recommended test for evaluation of carotid atherosclerotic disease to guide medical management and further testing and/or intervention. Data based upon the NASCET method ( Fig. 13.3 ) of calculating angiographic stenosis showed that a carotid index (peak ICA velocity ÷ CCA velocity) >4 provided the highest accuracy (sensitivity 91%, specificity 87%, overall accuracy 88%) for predicting a high-grade stenosis (70%–99%). Ultrasound is used for diagnoses of many other important cerebrovascular pathologies listed in Table 13.2 .

| Stenosis (DR) | PSV ICA (cm/s) | ICA/CCA Ratio | EDV ICA (cm/s) | Plaque Imaging |
|---|---|---|---|---|
| Normal | <125 | <2 | <40 | None |
| <50 | <125 | <2 | <40 | <50% DR stenosis |
| 50%–69% | 125–230 | 2.0–4.0 | 40–100 | >50% DR stenosis |
| ≥70% but less than near occlusion | >230 | >4 | >100 | >50% DR stenosis |
| Near occlusion | Maybe low or undetectable | Variable | Variable | Visible, extensive |
| Occlusion | No flow | NA | NA | Visible with no detectable lumen |


| Carotid Diagnosis | B-Mode Imaging | Color Doppler Imaging | Velocimetry |
|---|---|---|---|
| Carotid dissection | ICA normal size with no atherosclerotic plaque | Occluded ICA or near-occlusion lumen | High-resistance flow in ICA |
| CCA Intimal flap in lumen with two lumens in transverse and longitudinal views | CCA Different color duplex flow in each channel; aliasing if high velocities present | CCA Different flow patterns in true and false channel | |
| Carotid aneurysm | 2x diameter increase in involved ICA or CCA arterial segment. Mural thrombus may be present | Enlarged artery segment with flow separation and partial thrombosis | Low-flow velocity due to large artery diameter |
| False aneurysm | Echolucent mass adjacent of artery | Color flow within mass with to-and-fro flow during pulse cycle | To-and-fro flow in neck of false aneurysm |
| Carotid body tumor | Soft tissue mass that spays the ICA and external carotid arteries apart. | Highly vascular mass on color and power Doppler imaging | Low-resistance flow pattern in mass |
| Fibromuscular dysplasia | Irregular ICA wall with “string of beads” appearance | Color or power Doppler showing string of beads with color aliasing due to increased velocity | Abnormal velocity spectra of long-segment ICA stenosis |
CTA provides an anatomic depiction of the carotid artery lumen and allows imaging of adjacent soft tissue and bony structures ( Fig. 13.4 ). Three-dimensional reconstruction allows relatively accurate measurements of residual lumen diameter. It is very useful when carotid duplex ultrasound is not reliable (e.g., in cases with severe kinking, severe calcification, short neck, or high bifurcation) or when an overall view of the vascular field is required. A meta-analysis published in 2006 concluded that CTA compared with intraarterial cerebral angiography for the diagnosis of 70%–99% carotid stenosis had a sensitivity of 0.77 (95% CI 0.68–0.84) and a specificity of 0.95 (95% CI 0.91–0.97).

MRA techniques utilize either two- or three-dimensional time-of-flight (TOF) MRA or gadolinium-enhanced MRA (contrast-enhanced MRA or CEMRA). CEMRA offers several advantages over traditional TOF techniques. The use of a paramagnetic agent acting as a vascular contrast allows for higher quality images that are less prone to artifacts. Both TOF MRA and CEMRA are accurate for the identification of high-grade carotid artery stenosis and occlusion but appear to be less accurate for detecting moderate stenosis. The sensitivities of either MRA technique for the identification of carotid artery occlusion or severe stenosis were similar and ranged from 91% to 99%, while specificities ranged from 88% to 99%. Compared with carotid duplex ultrasound, MRA is less operator dependent and does produce an image of the artery. However, MRA is more expensive and time consuming than carotid duplex ultrasound and is less readily available. For patients that cannot lie supine, stay still, or have pacemakers or incompatible hardware, it is not recommended or cannot be performed.
Invasive catheter angiography is the gold standard for diagnosis and planning of the treatment of symptomatic carotid artery atherosclerosis. It provides optimal high-resolution images, essential for diagnosis and etiology. Moreover, injections can be repeated to obtain best images and analysis of flow. Though it is an invasive procedure, with a relatively safe profile with all neurological complications rate being less than 1% in experienced operators, more evidently when the transradial approach is used.
Carotid artery dissection is a condition whereby the layers of the carotid artery are spontaneously separated. This potentially compromises blood flow to certain areas of the brain and can lead to a stroke. This tear can be spontaneous or caused by trauma. Conditions such as Marfan syndrome, Ehlers-Danlos and fibromuscular dysplasia (FMD) also increase the risk. The diagnosis may be established by ultrasound, CTA, or MRA ( Fig. 13.5 ).

Limitations
Duplex ultrasound may mistake hairline residual lumens with total occlusions, although it would rarely change management. High Doppler angles (>60 degrees) are associated with overestimation of PSV values and thus stenosis severity. It is also limited by severely calcified carotid lesions, tortuous carotid arteries, and patient body habitus. Results must be interpreted carefully in patients with contralateral carotid occlusion to avoid overestimation of an ipsilateral carotid stenosis, since the PSV is often increased in the presence of a contralateral internal carotid occlusion. Lastly, the lack of lab protocol standardization and variability may result in unnecessary interventions.
CTA requires a contrast bolus comparable to that administered during a conventional angiogram. As a result, impaired renal function is a relative contraindication for its use, particularly in patients with diabetes or congestive heart failure.
Disadvantages of invasive angiography include its invasive nature, high cost, and risk of morbidity and mortality. In a review of prospective studies, the risk of serious neurologic complications or death was approximately 1% (range 0%–6%). The risk of morbidity is increased with cerebrovascular symptoms, advanced age, diabetes, hypertension, elevated serum creatinine, and peripheral vascular disease. The size of the catheter, amount of contrast, and procedure duration also affect the likelihood of complications. One study found that embolic events following angiography occur more frequently than the apparent neurologic complication rate (silent embolisms), but clinical significance is unclear.
Emerging Technologies
Imaging techniques for the diagnosis and treatment of cerebrovascular disease have developed fast due to advances in clinical practice and its needs in recent years. There has been much research to develop new imaging modalities and techniques to diagnose and treat acute and chronic broad spectrum of carotid atherosclerosis. Advanced techniques and worldwide availability of CTA and MRI/MRA have accelerated and improved the diagnosis and treatment of acute and chronic conditions by imaging of the vessels, brain parenchyma, perfusion, or blood flow patterns. These include 3D-ultrasonography, compound ultrasonography Computed Tomography (CT), CT angiography (CTA), CT perfusion (CTP), CT venography (CTV), MRI, MR angiography (MRA), MR perfusion and nuclear medicine. New catheters and techniques for mechanical thrombectomy are also on the horizon, which will significantly decrease morbidity and mortality for patients presenting with acute ischemic strokes.
Aortic Aneurysm
Clinical Overview
An aortic aneurysm is an abnormal dilatation in the wall of the aorta that is greater than 50% of the normal vessel diameter. The natural history of the disease leads to progressive growth of the aneurysm sac and untreated aortic aneurysms have devastating complications, such as rupture. In 2019 there were over 172,000 aortic aneurysm-related deaths globally, which was a 30% increase since 1990. This rise in global mortality is due to both the growing aging population and increase in aneurysm diagnosis via surveillance programs. Unfortunately, there is no effective medical therapy to prevent expansion and rupture is a highly lethal event. Therefore, the timely evaluation, surveillance, and treatment of aortic aneurysms is key to reducing the mortality risk. Aneurysms most commonly occur in the infrarenal aorta, but they can be in any segment of the aorta, from the root to the bifurcation. Risk factors for aneurysm formation include smoking, age, hypertension, and family history. Aneurysmal disease is a degenerative process involving all three layers of the arterial wall. Most aortic aneurysms are associated with atherosclerosis. Approximately 20% of patients with thoracic aortic aneurysms have a family history, suggesting a genetic component. A small percentage of aortic aneurysms are caused by infection. Mycotic aneurysms are usually saccular and have a high risk of rupture (See Aortitis section). Another etiology of aortic aneurysm is a traumatic aneurysm or pseudoaneurysm. Once an aneurysm develops, there is progressive enlargement of the aortic wall. In general, larger aneurysms grow at faster rates than smaller aneurysms. However, it is difficult to predict the exact growth rate. Many aortic aneurysms develop without symptoms and are often diagnosed incidentally. Even in large aneurysms, only 50% are diagnosed through a palpable mass on physical exam. The development of clinical symptoms is usually due to the sudden growth of the aneurysm, or compression on adjacent structures. The most common symptoms are chest, back or flank pain. Thoracic aneurysms can manifest as shortness of breath, dysphagia, or vocal hoarseness if compressing the bronchus, esophagus or recurrent laryngeal nerve. Manifestations of aortic rupture include sudden onset severe chest or back pain, with a drop in blood pressure (BP) and hemoglobin. A rupture constitutes a surgical emergency that carries a high mortality rate.
Diagnostic Strategies and Therapeutic Implications
Although a chest X-ray is not a diagnostic modality, aneurysms in the thoracic aorta can be incidentally discovered on chest X-rays performed for other purposes. X-ray findings suggestive of a thoracic aortic aneurysm include a widened mediastinum, enlargement of the aortic knob, and possibly tracheal deviation. Imaging findings suggestive of a thoracic aortic aneurysm in an undiagnosed patient should prompt the clinician to order further imaging. However, some thoracic aneurysms may not produce any abnormalities on chest X-ray.
Ultrasound is available in most hospitals and outpatient facilities and can provide details about the vessel wall and diameter ( Fig. 13.6 ). Studies have shown that abdominal ultrasound has high sensitivity and specificity for detecting aortic abdominal aneurysm (AAA). As such, it makes an excellent screening and surveillance modality for monitoring AAA enlargement. However, this modality is limited by the patient’s body habitus and bowel gas. Because of air-containing lung and viscera, it is not reliable for imaging the thoracic or suprarenal aorta. It has limited ability to identify the exact proximal or distal extent of the aneurysm, or relationship to visceral vessels. Therefore ultrasonography should not be used for screening or diagnostic purposes in thoracic aortic aneurysms, nor does it provide all the information necessary for preoperative evaluation of a patient.

CTA is the imaging modality of choice for diagnosing aortic pathology and defining vessel branch anatomy. CT images provide appropriate information to decide if the patient is a candidate for open or endovascular repair. All the anatomical characteristics necessary to make an operative plan are easily identified on CT imaging ( Fig. 13.7 ). Furthermore, 3D models can be constructed from these images providing detailed crucial information to properly plan the intervention. Disadvantages of CT include the need for intravenous contrast, exposure to radiation, and higher cost (as compared to ultrasound).

In patients in which CTA is contraindicated (due to contrast allergy or renal disease), MRA is a suitable alternative that is able to provide proper information and detailed images of the aorta ( Fig. 13.8 ).

Surveillance of aortic aneurysms has been proven to be both cost effective and life saving in select populations. Both the Society for Vascular Surgery (SVS) and the US Preventive Services Task Force recommend screening for AAAs. The USPS recommends a one-time ultrasound in 65- to75-year-old males who have ever smoked or 55-year-old males with a family history of AAA. The SVS has broader criteria, recommending ultrasound screening in males older than 65, regardless of smoking history; males aged 55 and older with a family history of AAA, and females older than 65 who have ever smoked or have a family history of AAA. Current guidelines for thoracic aortic disease recommend screening for first- and second-degree relatives of patients with thoracic aortic aneurysm disease. Patients at increased risk, as are those with connective tissue disorders, are recommended to undergo imaging of the aorta with CTA.
The treatment goal for aortic aneurysms is to prevent the morbidity and mortality associated with rupture. Indications for surgical repair of aortic aneurysms depend on the presence of symptoms and the size of the aneurysm. Indications for surgical intervention on a thoracic aortic aneurysm include rupture, maximal diameter greater than 6 cm, growth greater than 0.5 cm in 1 year, or symptoms. Indications for surgical repair of an abdominal aortic aneurysm include rupture, a maximal diameter of 5.5 cm in males, 5.0 cm in females, >0.5 cm growth in 6 months, or symptoms caused by compression or distal embolization. Surgical interventions for aortic aneurysms include open surgical repair and endovascular aortic aneurysm repair.
While the logistics of the surgical repair may vary depending on the location of the aortic aneurysm, the principles remain the same: exclude the aneurysmal segment of the aorta. Involvement of the aortic arch and visceral segments adds additional complexity to aneurysms in these regions. The method of repair depends on many factors, including the aortic diameter, expansion rate, association symptoms, and the patient’s overall clinical status and comorbidities.
Although open surgery has been the longstanding treatment for aneurysms, and it is still the treatment of choice for many patients, endovascular repair has quickly become the dominant therapy. The last two decades have seen exponential advances in endovascular technologies making it able to adapt to almost all anatomic variations.
Limitations
CTA is limited to patients with severe iodine contrast allergy or significantly impaired renal function. MRA requires patient cooperation and longer scanning times.
Emerging Technologies
4D Flow Magnetic Resonance Imaging (4D Flow MRI) is an emerging diagnostic tool in aortic pathologies. Originally focused on cardiac disease, 4D Flow MRI can identify variations in flow patterns which can aid in the diagnosis of the underlying etiology of aortic disease. Furthermore, quantitative, and qualitative flow analysis can identify wall shear stress and become a better predictor of aneurysm rupture than evaluations solely based on size criteria. Availability, cost, and time for image acquisition and processing are some of the limitations that may hinder its widespread use. The available data is not robust enough yet to incorporate this technology in the diagnostic algorithm of aortic diseases. Additional studies will further define its role. AI methods are being developed to provide automated measurements of aneurysms, reducing the time required and the risk of human error ( Fig. 13.9 ).

Aortitis
Clinical Overview
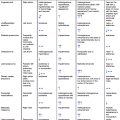
Vasculitis can affect vessels of any size or location. Aortitis is a generalized term for a range of inflammatory processes that involve the aorta. The mechanism of disease involves the invasion and proliferation of inflammatory cells into the aortic wall. The most common etiology remains associated with large-vessel vasculitis, although a whole host of rheumatoid or autoimmune diseases have also been associated. An autoimmune etiology is the most common cause of aortitis. Giant Cell Arteritis (GCA) and Takayasu Disease, both autoimmune inflammatory syndromes can present with aortic involvement. However, further association with other rheumatoid and autoimmune processes has been documented in the literature ( Table 13.3 ). Usually, Takayasu arteritis and GCA tend to affect the thoracic aorta, while immunoglobulin G4–related disease most commonly affects the abdominal aorta. Idiopathic aortitis presents in a population without the usual risk factors for the autoimmune type. Patients tend to be female and elderly. An underlying cause is not established in most cases. It can lead to aneurysmal degeneration and some series found rates of 2%–8% in histopathology evaluation of treated aortic aneurysms. Infectious aortitis, although rare, remains a very concerning cause of aortitis due to its high morbidity. Multiple pathogens have been associated, as listed in Table 13.4 . The mechanism of disease remains unknown, but it likely relates to infection of previous aortic pathology (plaque or penetrating ulcer), contiguous spread from infectious processes in adjacent tissues or embolization and seeding from distal sources. It can present as diffused aortitis or as an aneurysmal dilatation, known as a mycotic aneurysm. Mycotic aneurysms tend to be saccular, in comparison to the fusiform type which is associated with degenerative disease. Salmonella remains the most common pathogen, followed by Staph and Strep species. Recently, a resurgence of luetic disease (syphilis) has been reported in the literature. Patients with infectious aortitis will present with systemic signs and symptoms of infection (general malaise, fever, leukocytosis), which can help differentiate the diagnosis from other possible etiologies.
| Giant cell arteritis |
| Takayasu arteritis |
| Systemic lupus erythematosus |
HLA related:
|
| ANCA-associated vasculitis |
| Cogan syndrome |
| Reiter syndrome |
| Salmonella spp. |
| Streptococcus spp. |
| Staphylococcus spp. |
| Luetic (Syphillis) |
| Mycobacterial |
The presentation of aortitis usually mimics that of acute aortic syndromes. Patients will present with a range of symptoms which include chest or back pain, abdominal pain, or signs of end-organ mal perfusion. Proper differentiation of aortitis from other aortic pathologies is imperative, as the treatment paradigms are vastly different.
It is important to obtain a thorough and detailed history, including family history of rheumatoid or autoimmune disease or previous aortic pathologies. The pattern of pain and associated symptoms can further aid in the diagnostic algorithm. As previously mentioned, systemic signs of infection can point to an infectious pathology. A detailed pulse examination can find discrepancies that might point to end-organ ischemia and/or mal perfusion.
Diagnostic Strategies and Therapeutic Implications
Although the diagnosis of aortitis generally is based on clinical presentation and aortic imaging, key laboratory tests are helpful. Inflammatory markers, like Erythrocyte Sedimentation Rate and C-Reactive Protein, are excellent diagnostic tools. They are usually elevated in autoimmune aortitis. They can also be used as a target to evaluate the effectiveness of any instituted therapy or to monitor for recurrence of disease. A complete blood count and blood cultures will help differentiate from an infectious etiology.
CTA of the aorta is the diagnostic tool of choice. Transverse images in conjunction with coronal, sagittal and curved reformats are helpful for assessment of the extent and severity of vessel wall involvement. Findings of circumferential thickening of the aortic wall are pathognomonic and help differentiate from other acute aortic etiologies, like aortic dissection or aneurysmal disease ( Figs. 13.10 and 13.11 ). It can also serve as a follow-up to evaluate effectiveness of therapeutic interventions.


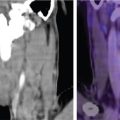
18F-FDG-PET with CT is useful for both the diagnosis of suspected aortitis and to evaluate antiinflammatory treatment response, especially before any surgical intervention. The addition of CT-PET helps delineate the inflammatory nature of the process and further aids in the differentiation from other aortic pathologies ( Fig. 13.12 ). It can also help predict future progression or degeneration which might lead to rupture.

MRA, generally with gadolinium contrast enhancement, is emerging as a noninvasive imaging modality of choice for aortitis, particularly aortitis associated with GCA and Takayasu arteritis. MRI may be used to image the entire aorta without radiation exposure or iodinated contrast, and it provides excellent resolution of the aortic wall. Areas of active aortitis may appear as vessel wall edema, enhancement, or wall thickening on MRA. A specific “edema weighted technique” can further define and enhance the areas of inflammatory involvement.
Idiopathic aortitis is usually identified in specimens after aneurysm resection. Although there is no indication that further therapy is needed, a thorough investigation of underlying causes should be performed.
Limitations
MRI/MRA is not the initial diagnostic modality of choice in acute presentations given its limited availability and amount of time required for completion of a study. PET-CT requires certain metabolic conditions and patient preparation. It also requires longer scanning times. It is also not widely available, which limits its use.
Aortic Dissection
Clinical Overview
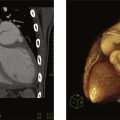
An aortic dissection is defined as a tear in the intima layer of the aortic wall. The tear creates a dissection flap that divides the vessel into a true lumen and a newly formed false lumen. This dissection flap can propagate and lead to several life-threatening conditions such as mal perfusion syndromes, strokes, myocardial ischemia, aortic regurgitation, rupture, and/or cardiac tamponade. Aortic dissections are part of a range of aortic pathologies, collectively defined as acute aortic syndromes. ( Fig. 13.13 ) As previously mentioned in this chapter, timely differentiation between these presentations is imperative to ameliorate its individual morbidity and mortality. Patients with acute aortic dissection can present with a wide range of symptoms, as listed in Table 13.5 . Invariably, tearing, or sharp chest and abdominal pain are usually present, and it’s the main reason for patients to seek treatment. These symptoms will commonly be accompanied by an episode of hypertensive urgency or crisis. The combination of these symptoms on presentation should provide the medical team a high level of suspicion for an acute dissection or one of the associated acute aortic pathologies. At higher risk are patients with connective tissue disorders, especially patients with Marfan Syndrome. Around 50% of patients younger than 40 years who present with dissection carry a diagnosis of Marfan Syndrome. Aortic dissections are described as acute, subacute, and chronic depending on the timing of the presentation (<14 days, 14 days to 3 months, >3 months from the initial event). Aortic dissections are classified based on the origin of the entry tear. Since the location and origin of the entry tear appears to be a predictor of disease pattern and early outcomes, the Stanford Classification is the most used ( Fig. 13.14 ). A Type A aortic dissection originates proximal to the origin of the left subclavian artery. It can extend proximally and involve the great vessels, the aortic arch and the descending aorta. It can then lead to a highly morbid and lethal constellation of syndromes secondary to occlusion and subsequent mal perfusion. Involvement of the left carotid and brachiocephalic arch can lead to stroke. Proximal extension into the aortic valve leads to acute aortic insufficiency. Further extension into the coronary arteries will lead to acute coronary syndrome and myocardial ischemia. In patients left untreated the early mortality risk is between 1% and 2% per hour after symptom onset. A Type B aortic dissection originates distal to the origin of the left subclavian artery. Although it spares the proximal aorta and the great vessels, it can lead to severe morbidity and mortality secondary to mal perfusion syndromes.

| Pain chest/back/abdomen |
| Syncope |
| Stroke |
| Hypertensive urgency or crisis |
| Peripheral ischemia |

Diagnostic Strategies and Therapeutic Implications
As with other acute aortic pathologies, CTA of the aorta remains the main tool for diagnosis of acute aortic dissection. Its features of being readily available, being nonoperator dependent and providing complete imaging of the aorta in a short period of time, makes it the ideal diagnostic tool of choice. It properly identifies the origin of the entry tear, as well as the level of extension and propagation. The CTA can identify both the true and false lumens and provide evidence of flow and branch vessel perfusion. See Fig. 13.15 .

TEE can serve as a primary diagnostic tool or as an adjunct to CTA. It can readily visualize the ascending aorta and provide information about entry tears and luminal flow. The sensitivity of TEE has been reported to be as high as 98%, although it remains user dependent. In a patient too unstable for any further imaging, it can provide anatomical information and confirmation in the operating room before surgical intervention.
As for any of all other acute aortic syndromes, MRA can provide detailed imaging of the aorta and identify the entry tear and extension of the dissection flap ( Fig. 13.16 ). It provides extremely high sensitivity in acute aortic dissection. However, as previously mentioned, its limited availability and amount of time required for completion of a study, makes it a less ideal initial choice of imaging for acute presentations.

With the development of CTA, contrast aortography is rarely utilized as a diagnostic tool. However, if used as part of an endovascular repair, it can provide important anatomic and dynamic information. The addition of IVUS helps to further identify the true and false lumens and their relation to branch vessel origins ( Fig. 13.17 ).

A Type A aortic dissection is a surgical emergency with survival directly linked to prompt diagnosis and timely intervention. Endovascular repair with a thoracic stent graft is indicated for patients presenting with complicated Type B dissections. This indication extends to patients with evidence of end-organ mal perfusion, peripheral ischemia, or signs of impending rupture. Sealing of the entry tear by the graft will lead to thrombosis of the false lumen and reestablishment of flow via the true lumen ( Fig. 13.18 ).

Limitations
CTA requires a contrast bolus comparable to that administered during a conventional angiogram. As a result, impaired renal function is a relative contraindication for its use, particularly in patients with diabetes or congestive heart failure. Patients with contrast allergies need to be premedicated ahead of time.
MRI/MRA is not the initial diagnostic modality of choice in acute presentations given its limited availability and amount of time required for completion of a study.
Emerging Technologies
The International Registry for Aortic Dissections is the largest database of aortic dissections in the world. We will continue to explore this data which will lead to improved diagnosis, imaging techniques and therapies for patients presenting with acute aortic syndromes or aneurysmal disease. In addition to developments in aortic stent grafts, there have been significant advancements in imaging modalities. 3D reconstruction programs allow for highly sophisticated images that can be overlaid during the procedure to allow for precise deployment of endografts.
Pulmonary Hypertension
Clinical Overview
Pulmonary hypertension (PH) is a pathological disease of the vasculature caused by various clinical conditions involving the cardiovascular and respiratory systems. On a global level, the prevalence of PH is around 1% of the total population. PH is intricately linked to chronic cardiac and lung disease; therefore, this is a condition of mostly older individuals. Left heart disease is the leading cause of PH, followed closely by hypoxic lung disease, such as chronic obstructive pulmonary disease. Regardless of the cause, the presence of PH is invariably associated with worsening symptoms and increased mortality. Historical classification systems, such as the World Health Organization, serve to separate underlying diseases based on unifying pathophysiology, prognosis, and implications for therapy. In 2022 ESC/ERS built upon this backbone, to refine classification utilizing the latest scientific data available on the complex pathophysiology of the various subtypes. There are five broad subgroups based on underlying etiology, natural history, and response to treatment: Pulmonary Arterial Hypertension (PAH; Group 1), PH resulting from left heart disease (Group 2), PH due to chronic lung disease and/or hypoxia (Group 3), PH due to pulmonary artery obstructions (Group 4), and PH due to unclear/multifactorial disease (Group 5) ( Table 13.6 ). A meticulous evaluation is required, with an emphasis on detecting the presence of group 1 PAH and group 4 chronic thromboembolic pulmonary hypertension (CTEPH). Symptoms of PH are closely linked to right ventricular function. Patients presenting early on in their disease course may only manifest symptoms with heavy exertion. As the disease progresses, dyspnea on slight exertion is a predominant feature. Other signs and symptoms that should prompt workup include syncope, chest tightness, increased abdominal girth, and lower extremity edema.
| GROUP 1 Pulmonary arterial hypertension (PAH) |
|
| GROUP 2 PH associated with left heart disease |
|
| GROUP 3 PH associated with lung diseases and/or hypoxia |
|
| GROUP 4 PH associated with pulmonary artery obstructions |
|
| GROUP 5 PH with unclear and/or multifactorial mechanisms |
a Patients with heritable PAH or PAH associated with drugs and toxins might be acute responders.
b Left ventricular ejection fraction for HF with reduced ejection fraction: ≤40%; for HF with mildly reduced ejection fraction 41%–49%.
c Other causes of pulmonary artery obstructions include sarcomas (high or intermediate grade or angiosarcoma), other malignant tumors (e.g., renal carcinoma, uterine carcinoma, germ-cell tumors of the testis), nonmalignant tumors (e.g., uterine leiomyoma), arteritis without connective tissue disease, congenital pulmonary arterial stenosis and hydatidosis.
d Including inherited and acquired chronic hemolytic anemia and chronic myeloproliferative disorders.
e Including sarcoidosis, pulmonary Langerhans’s cell histiocytosis, and neurofibromatosis type 1.
Diagnostic Strategies and Therapeutic Implications
PH remains a hemodynamically defined disease with a mean pulmonary artery pressure over 20 mm Hg and a pulmonary vascular resistance over 2 wood units. However, echocardiography provides important diagnostic and prognostic information in the evaluation of PH. Echocardiography is easily reproducible and widespread, therefore making it an attractive option for the initial screening tool. There is no one parameter that can correctly identify the etiology of this heterogeneous disease, however a composite view of various parameters may prompt consideration for the diagnostic gold standard of right heart catheterization ( Fig. 13.19 ). A comprehensive echocardiogram provides data on right-sided size and function, an estimation of pulmonary pressures and a view to the left side of the heart. A key focus of this exam is to exclude systolic, diastolic, and valvular lesions that may predispose a patient to group 2 disease. Pulmonary artery systolic pressure is estimated using the tricuspid valve regurgitant velocity and right atrial pressure. The modified Bernoulli equation (ΔP = 4v 2 ) yields a pressure gradient across the tricuspid valve. The linear dimension and collapsibility of the inferior vena cava are then used to approximate right atrial pressure. A dilated IVC that does not collapse >50% of its initial size with inspiration (or a sniff) indicates elevated RA pressure of 15 mm Hg. This right atrial pressure estimate is then added to the Bernoulli equation derived trans-tricuspid gradient. In many cases, there is insufficient tricuspid regurgitation to estimate pulmonary pressures. A variety of other clues on echocardiogram can signal the presence of PH: the RVOT acceleration time of pulmonary ejection of less than 105, mid-systolic notching of the pulsed wave through the valve and flattening of the interventricular septum throughout the cardiac cycle, among others.

Right ventricular function determines prognosis and outcome in PH. Multiple echo parameters can give clues to the systolic function of the RV, which can be extremely challenging to adequately image. M-mode, with its high temporal resolution, is used as a consistently reproducible method of measuring the tricuspid annular plane systolic excursion (TAPSE). A TAPSE <1.8 cm, obtained through an M-mode of the free RV wall, predicts decreased 2-year survival. The peak RV systolic annular velocity can be derived by tissue Doppler along the lateral tricuspid annulus. Similarly to TAPSE, this parameter attempts to quantify the longitudinal movement of the annulus as a proxy for RV function. Along with the m-Mode derived value, the RV tissue velocity also has important prognostic implications in PH. Finally, the RV myocardial performance index (Tei index) can be obtained from tissue Doppler assessment through the tricuspid valve. It is calculated using the sum of the isovolumic contraction and relaxation times over the total ejection time. This has been correlated with RV function, and abnormal values are associated with worse prognosis. The imaging of the RV can be challenging; therefore, it is important to have a composite view of several different parameters in determining risk of PH. The presence of a pericardial effusion has strong prognostic value. In a seminal work from the early 2000s, this, along with indexed right atrial size, was a strong predictor for adverse events in PH patients. In fact, these two parameters remain on several contemporary risk calculators used in PH. It has long been recognized that the septum plays an integral role in RV function. The RV is a thin-walled chamber and depends on the muscular septum for effective output. Abnormal septal configuration is considered one of the echocardiographic hallmarks of PH. During systole, the shape of the septum is largely driven by the transseptal gradient (the pressure difference between the right and left ventricles). Although visibly apparent in advanced stages, the systolic and diastolic eccentricity index is used to objectively quantify the degree of septal shift observed during the cardiac cycle. The index is calculated using the ratio of the minor axis of the LV parallel to the septum divided by the minor axis perpendicular to the septum at the level of the LV papillary muscles in both end diastole and end systole. An abnormal systolic eccentricity index denotes elevated pulmonary artery pressures, while an abnormal eccentricity index during diastole denotes elevated right ventricular diastolic pressure (i.e., volume overload).
Left heart disease remains the most common cause of PH. The echocardiogram is a valuable tool in rapidly assessing major pathology of the left heart. Chronically elevated left atrial pressures can cause pulmonary artery remodeling and resultant PH. Close attention is paid to left atrial and ventricular dimensions, and the identification of left-sided valve disease. Although invasive hemodynamics usually correlates with postcapillary PH, long-standing left-sided elevations can lead to a combined pre and postcapillary profile (defined as mean PA over 20 mm Hg, wedge over 15 mm Hg and PVR above 2). In systolic heart failure, the presence of PH portends worse outcomes.
CMR has been long recognized as a powerful tool to image the RV. As temporal and special resolutions improved, clinicians were able to gain insight into the complex interplay between the left and RVs. CMR derived RV mass has been shown to correlate directly to elevated pulmonary pressures. In addition to mass and volume analysis, flow measurements are an accurate and reproducible tool for quantification of pulmonary artery flow and lung perfusion, which are decreased in PAH patients. This modality holds an advantage over invasively derived “calculated” outputs in the catheterization laboratory. The CMR derived values provided excellent quantification of both the right and left ventricle stroke volume and a superior ability to calculate shunt fraction. In a large meta-analysis done in CMR studies in PAH, RV ejection fraction was the strongest predictor of mortality. Four-dimensional (4D) flow analysis is emerging as the preferred method for the assessment of pulmonary circulation. Using this technology, subtle changes in pulmonary blood flow can be detected in PH patients, and improvements in flow can be used to track therapeutic success.
Limitations
CMR can offer a comprehensive view of the RV and pulmonary vasculature, and in some ways is superior to routine echocardiography. However, it involves significant technical expertise as well as experienced interpretation. To that end, it may not be universally applicable at the current moment to the routine evaluation of the RV and the echocardiogram continues to be the screening tool of choice.
Emerging Technologies
The concept of ventricular-arterial uncoupling emerged in the 1980s to describe the transfer of energy from the ventricular contractility to the arterial afterload. The ventricular contractility is described by the term end-systolic elastance (Ees), which is a load-independent measure. Arterial afterload is encompassed in a term called arterial elastance (Ea), which combines mean and pulsatile pressures in a way to describe the afterload to the ventricle. Importantly, Ea can be easily calculated through end-systolic pressure divided by stroke volume and is accurate through various afterload conditions. The ratio of Ees/Ea completely captures the ventricular-arterial coupling phenomenon. This ideal unitless ratio has been established at 1.0–2.0. RV-PA uncoupling can be preserved in a compensated RV even with severely elevated pulmonary pressures. As the disease advances, this ratio drops, with the lowest tertile being the most decompensated state. These measurements are derived from invasive RV pressure-volume loops. In recent years, data suggests that CMR measured RV stroke volume divided by RV end-systolic volume is comparable, if not superior, to invasively derived Ees/Ea in predicting RV dysfunction. A more promising application of CMR in RV imaging lies in the ability to demonstrate improvement with vasodilator therapy. In early 2020 the REPAIR trial (effects of Macitentan on markers of RV function) showed that open label Macitentan therapy was associated with CMR-based improvements in RV stroke volume. This has raised important consideration for CMR-based end points in clinical trials as a precise method to track disease progression with therapy.
Pulmonary Embolism
Clinical Overview
Pulmonary embolism (PE) is estimated to occur at 60–100 cases per 100,000 population in the Western world. Older age is associated with a higher annual incidence, and poses a diagnostic challenge, as symptoms may be nonspecific. In fact, only 5%–10% of patients report chest pain and dyspnea as their primary symptoms. In more severe cases, syncope can be the initial presentation. Even in cases of early diagnosis, mortality remains unacceptably high, with an estimated in-hospital mortality at 14%, and 90-day mortality at 20%.
CTEPH is a rare sequela of an acute PE, with an estimated incidence of up to 3% in the modern era. It is characterized by the persistence of organized flow limiting thrombi in the pulmonary arteries after a period of adequate anticoagulation, along with PAH. Left untreated, mortality is estimated at only 30%–80% of patients surviving 3 years. The curative approach involves a surgical pulmonary thromboendarterectomy, after careful consideration of candidacy. In the most experienced centers, mortality of this extraordinarily complex surgery is less than 5%. Given this potential for a curative intervention, it is imperative to correctly diagnose this condition and promptly refer for appropriate treatment.
Diagnostic Strategies and Therapeutic Implications
Acute PE can be quickly identified by lung scintigraphy, which uses a radioisotope for ventilation (V), perfusion (P) or both. Until the modern era of CT scans, the V/Q scan was the historical test of choice. Ventilation is assessed with the use of aerosolized agents such as technetium-99m (Tc-99m), labeled DPTA, sulfur colloid and radioactive gasses such as Krypton and Xenon. Perfusion is assessed most with Tc-99m labeled macro-aggregated albumin. Perfusion scanning can be done in isolation, particularly to avoid aerosolized agents in pregnant patients or those that cannot hold their breath. If normal, a ventilation scan may be avoided. Most commonly, both are performed in succession and evaluated for the presence of a “mismatch,” that is, areas of well-ventilated lung containing a perfusion defect in a lobar, segmental or subsegmental area. Multiple planar views are obtained with the patient in the upright position, Fig. 13.20 . Recent analyses prospectively classified V/Q scans according to probability of a PE. The prospective investigative study of acute pulmonary embolism diagnosis and modified Prospective investigation of pulmonary embolism diagnosis are the most utilized V/Q classification systems. These sensitivity and specificity ranges using these scoring systems approach that of the gold standard, CT pulmonary angiography. In considering the role of V/Q scanning in acute PE, certain scenarios would make this the preferable test of choice: pregnancy, young patients in whom heavy radiation exposure should be avoided and in those with renal impairment who cannot tolerate iodinated contrast.

Related posts:
Stay updated, free articles. Join our Telegram channel

Full access? Get Clinical Tree


