Chapter 14
Vascular disorders of the liver
Ersan Altun1, Mohamed El-Azzazi1,2,3,4, and Richard C. Semelka5
1The University of North Carolina at Chapel Hill, Department of Radiology, Chapel Hill, NC, USA
2University of Dammam, Department of Radiology, Dammam, Saudi Arabia
3King Fahd Hospital of the University, Department of Radiology, Khobar, Saudi Arabia
4University of Al Azhar, Department of Radiology, Cairo, Egypt
Transient hepatic enhancement differences
- Transient increased hepatic enhancement is seen in the hepatic arterial dominant phase on CT and MRI, which characteristically should fade to background attenuation/signal with liver on more delayed acquisitions. These areas often have sharp and usually triangular borders although they may be nodular (Figure 14.1), wedge shaped (Figure 14.2), patchy (Figure 14.3) and segmental (Figure 14.3). These areas sometimes are associated with fatty infiltration, or sparing, or intrahepatic, biliary dilatation. On MR images, care should be taken to distinguish enhancement differences from differing fat content of hepatic parenchyma.
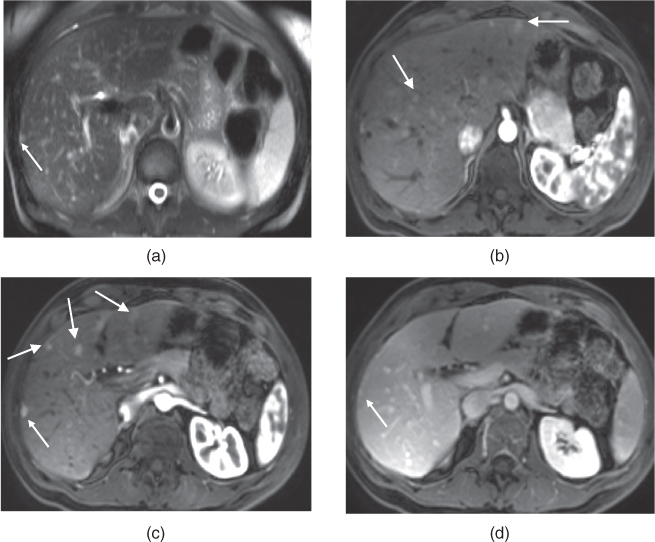
Figure 14.1 Transverse T2-weighted fat-suppressed SS-ETSE (a), T1-weighted fat-suppressed postgadolinium hepatic arterial dominant phase (b, c), hepatic venous phase (d) 3D-GE images show multiple small wedge-shaped and nodular areas of transient perfusion abnormalities (thick arrows, b, c). These areas do not demonstrate any signal change on precontrast sequences. These areas show early transient increased enhancement in the hepatic arterial dominant phase and become isointense on the hepatic venous phase. Note the presence of a tiny lesion with moderately high T2 signal (thin arrow, a) and prominent early enhancement (thin arrow, c) which persists in the hepatic venous phase (thin arrow, d).
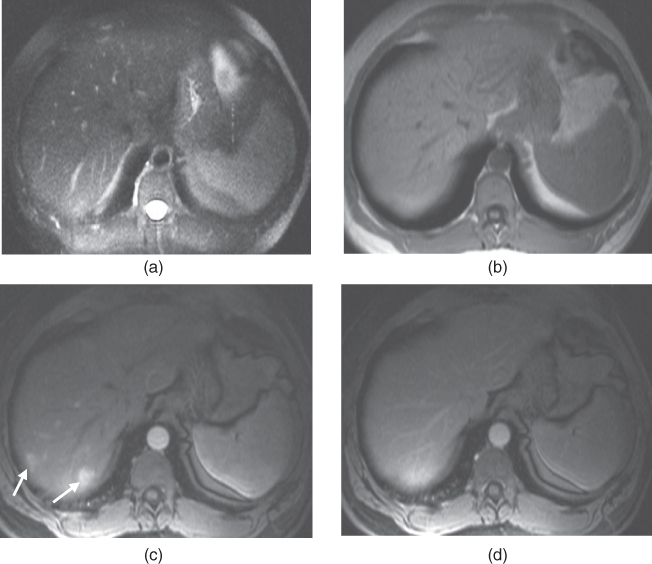
Figure 14.2 Transverse T2-weighted fat-suppressed SS-ETSE (a), T1-weighted 2D-GE, T1-weighted postgadolinium fat-suppressed hepatic arterial dominant phase (c) and hepatic venous phase 3D-GE (d) images demonstrate MR features of focal wedge-shaped areas of transient increased perfusional abnormality/vascular shunting (arrows). These wedge-shaped areas of perfusional abnormalities do not demonstrate any signal change on postgadolinium images and are only visible on the hepatic arterial dominant phase (c) becoming isointense on the hepatic venous phase (d).
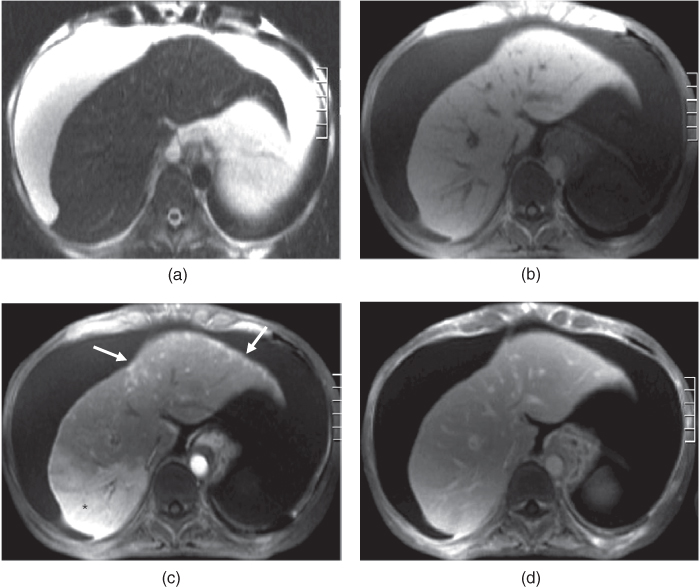
Figure 14.3 Transverse T2-weighted fat-suppressed SS-ETSE (a), T1-weighted fat-suppressed 3D-GE (b), T1-weighted postgadolinium fat-suppressed late hepatic arterial phase (c) and hepatic venous phase (d) 3D-GE images demonstrate MR features of segmental transient perfusional abnormality in the right lobe of the liver (asterisk, c) and patchy transient perfusional abnormality in the left lobe of the liver (arrows, c) in a cirrhotic liver. These areas of transient increased enhancement on the late hepatic arterial phase (c) do not show any signal change on precontrast images (a, b) and become isointense to the background liver on the hepatic venous phase (d). Note the large volume of ascites.
- Transient increased hepatic enhancement may be seen due to arterioportal shunts related to focal hepatic lesions; examples include hemangiomas (Figure 14.4), metastases (Figure 14.5), hepatocellular carcinoma, and focal nodular hyperplasia.
- Transient increased hepatic enhancement may be seen due to associated inflammation as in hepatic abscesses (Figure 14.6), acute cholecystitis (Figure 14.7), or acute-on-chronica hepatitis.
- Transient increased hepatic enhancement may be seen secondary to portal vein thrombosis or compression, which may be due to bland tumor thrombosis, tumor thrombosis, or tumor compression (Figures 14.8 and 14.9).
- Transient increased hepatic enhancement may also be seen due to cirrhosis (Figure 14.3) and aberrant venous drainage although it may also be idiopathic.
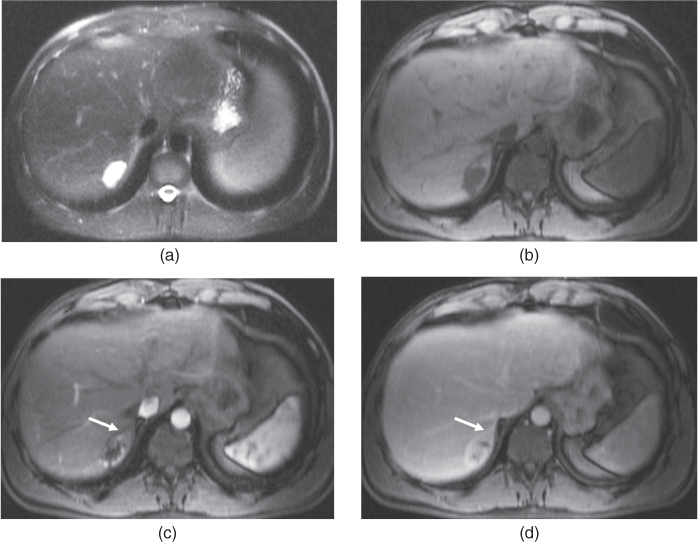
Figure 14.4 Transverse T2-weighted fat-suppressed SS-ETSE (a), T1-weighted fat-suppressed 3D-GE (b), T1-weighted postgadolinium fat-suppressed hepatic arterial dominant phase (c) and hepatic venous phase (d) 3D-GE images show a hemangioma associated with peripheral arterioportal shunting. The arterioportal shunt is characterized by the presence of adjacent early increased enhancement (arrow, c) which tends to fade on the later phase (arrow, d).
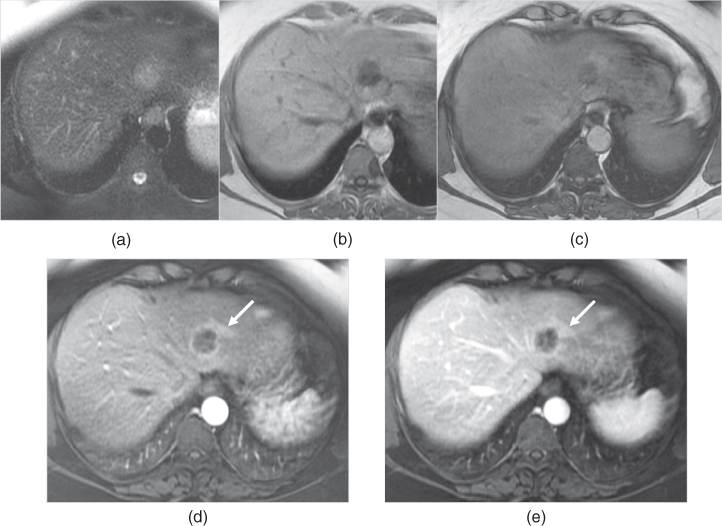
Figure 14.5 Transverse T2-weighted fat-suppressed SS-ETSE (a), T1-weighted in-phase (b) and out-of-phase (c) 2D-GE, T1-weighted postgadolinium fat-suppressed hepatic arterial dominant phase (d) and hepatic venous phase (e) 3D-GE images show a single colorectal cancer metastasis associated with peripheral arterioportal shunting. The arterioportal shunt is characterized by the presence of adjacent early increased enhancement (arrow, d) which tends to fade on the later phase (arrow, e). This area also shows fatty sparing on out-of-phase imaging.
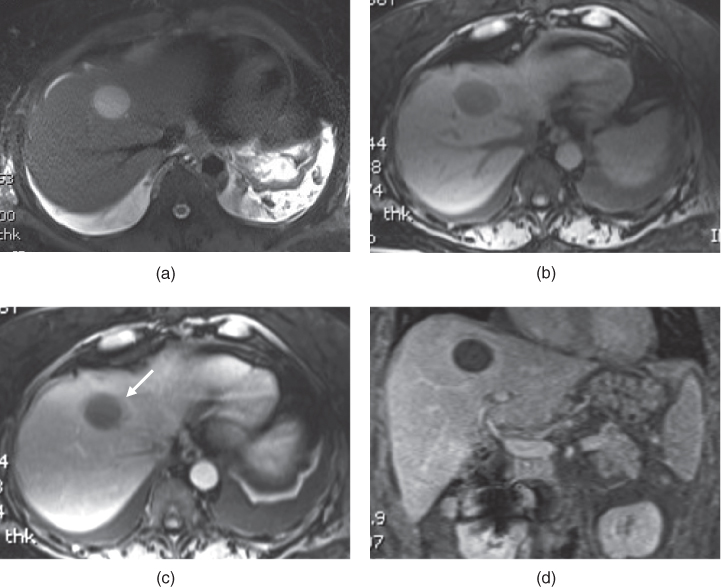
Figure 14.6 Transverse T2-weighted fat-suppressed SS-ETSE (a), T1-weighted fat-suppressed 3D-GE (b), T1-weighted postgadolinium fat-suppressed hepatic arterial dominant phase (c) and coronal hepatic venous phase (d) 3D-GE images show a liver abscess associated with transient peripheral increased enhancement (arrow, c) on the hepatic arterial dominant phase secondary to associated inflammation, hyperemia. The liver abscess shows high fluid content and enhancing thick wall. Note bilateral pleural effusions.
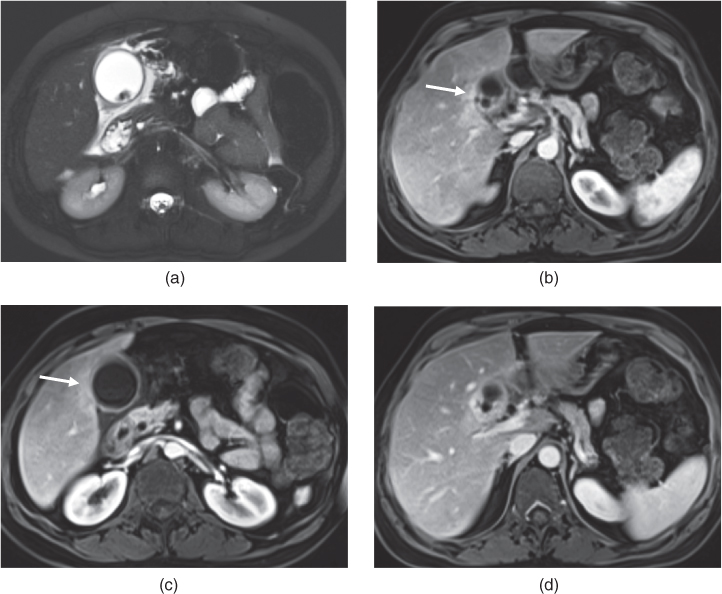
Figure 14.7 Transverse T2-weighted fat-suppressed SS-ETSE (a), T1-weighted postgadolinium fat-suppressed hepatic arterial dominant phase (b, c) and hepatic venous phase (d) 3D-GE images show acute calcolous cholecystitis associated with adjacent transient increased enhancement of the liver parenchyma (arrows; b, c) secondary to inflammation/hyperemia. Note the hydropic gallbladder with thick enhancing walls, pericholecystic fluid/edema and intraluminal stones.
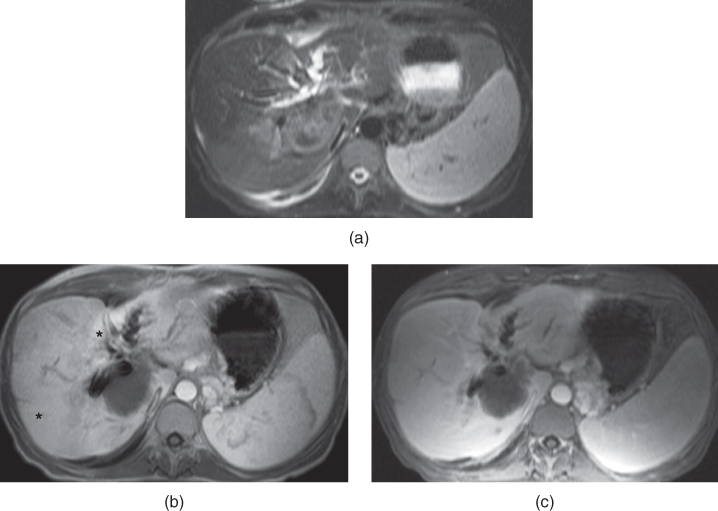
Figure 14.8 Transverse T2-weighted fat-suppressed SS-ETSE (a), T1-weighted postgadolinium hepatic arterial dominant phase (b) and hepatic venous phase (c) 2D-GE image shows an intrahepatic cholangicocarcinoma invading the portal hilum causing intrahepatic biliary dilatation and portal vein compression. Due to the portal vein compression, increased transient enhancement is seen in the liver (asterisk, b) in the hepatic arterial dominant phase with mildly increased enhancement in the later phase (c).
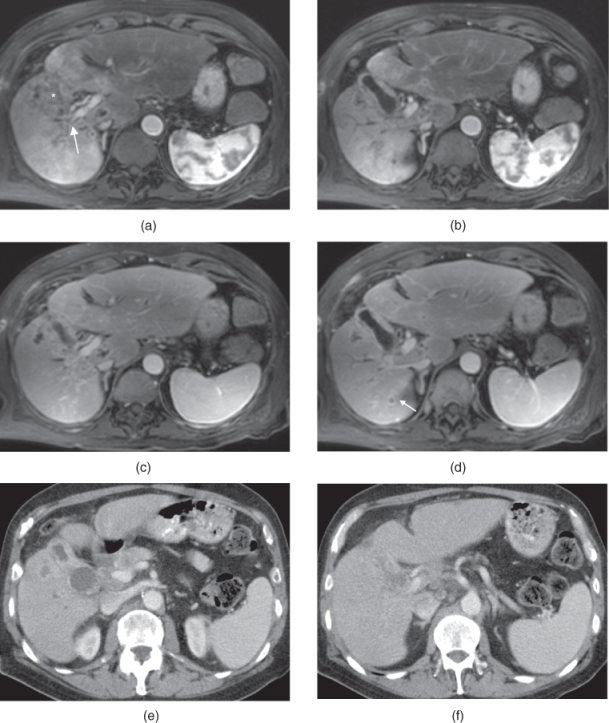
Figure 14.9 Transverse T1-weighted postgadolinium hepatic arterial dominant phase (a, b), hepatic venous phase (c, d) and postcontrast hepatic venous phase CT (e, f) images show the right portal vein compression (arrow, a) due to the infiltrative lesion secondary to the gallbladder cancer. The gallbladder wall is diffuse thickened and shows increased enhancement. Heterogeneously enhancing mass (asteriks, a) is seen in the right lobe. Due to the portal vein compression, early transient increased enhancement is seen in the right lobe of the liver (a, b). Note peripherally enhancing small metastases (arrow, d) in the right lobe of the liver. Postcontrast CT images (e, f) show enhancing thick walls of the gallbladder with small liver metastases.
Portal venous thrombosis
- Portal vein thrombosis is the major cause of presinusoidal hypertension in the United States.
- Acute or Chronic.
- Causes:
- Extrahepatic:
- Massive hilar lymphadenopathy.
- Phlebitis (e.g. secondary acute appendicitis).
- Propagation of splenic vein or superior mesenteric vein thrombosis secondary to pancreatitis.
- Postsurgical thrombosis.
- Hypercoagulable states.
- Massive hilar lymphadenopathy.
- Intrahepatic:
- Cirrhosis.
- Cholangitis.
- Intravascular invasion/tumor thrombosis by HCC or metastases.
- Cirrhosis.
- Extrahepatic:
- Forms of occlusion:
- Bland thrombus.
- Do not cause enlargement of the portal vein.
- Bland thrombus may also show mildly high attenuation on precontrast CT images.
- Bland thrombus may show mild high T2-signal and intermediate T1-signal on precontrast sequences if it is very prominent.
- Bland thrombus does not show enhancement.
- Figures 14.10–14.13
- Do not cause enlargement of the portal vein.
- Tumor thrombus.
- Causes enlargement of the portal vein.
- Tumor thrombus may show mildly high attenuation on precontrast CT images.
- Tumor thrombus may show mild-moderate high T2-signal and intermediate T1-signal on precontrast sequences.
- Tumor thrombus usually shows heterogeneous enhancement on the hepatic arterial dominant phase and may demonstrate wash-out in later phases on postcontrast CT and MRI. These features are more consistently and better observed on MRI.
- Figures 14.14–14.17.
- Causes enlargement of the portal vein.
- Extrinsic compression. Most commonly caused by malignant tumors, and characteristic of intrahepatic cholangiocarcinoma (Figure 14.8) and gallbladder carcinoma (Figure 14.9).
- Bland thrombus.
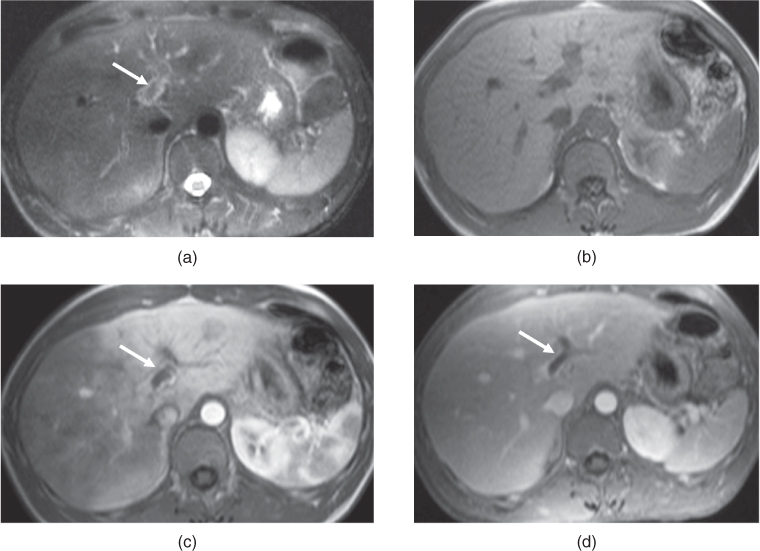
Figure 14.10 Transverse T2-weighted fat-suppressed SS-ETSE (a), T1-weighted 2D-GE (b), T1-weighted hepatic arterial dominant phase 2D-GE (c), hepatic venous phase fat-suppressed 3D-GE (d) images show bland thrombus (arrows) in the left portal vein. The thrombus shows mildly low signal on T2-weighted image (a) and fills the lumen of left portal vein without any enhancement on postgadolinium images (c, d). Increased transient enhancement is seen in the left lobe of the liver in the hepatic arterial dominant phase due to compensatory increase in the hepatic arterial flow and this transient increased enhancement fades in the hepatic venous phase. Note the presence of mild wall enhancement of the left portal vein on postgadolinium images secondary to inflammation.
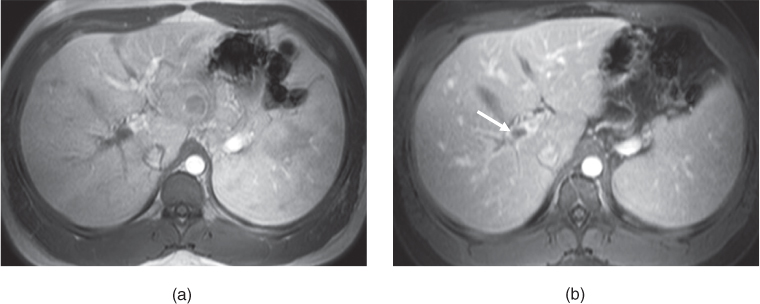
Figure 14.11 Transverse T1-weighted postgadolinium hepatic arterial dominant phase 2D-GE (a) and hepatic venous phase 3D-GE (b) images show bland thrombus (arrow, b) in the right portal vein.

Stay updated, free articles. Join our Telegram channel

Full access? Get Clinical Tree


