N
Validation test
ISR ≥ 70% PSV (cm/s)
ISR ≥ 70% EDV (cm/s)
ISR ≥ 70% ICA:CCA
ISR ≥ 50% (cm/s)
Stanziale 2005 [27]
118
Angio
≥350
≥4.75
PSV ≥ 225ICA:PCA ≥ 2.5
Chi 2007 [11]
260
Angio
≥450
NS
≥4.3
PSV ≥ 240ICA:CCA ≥ 2.5
Lal 2008 [6]
189
CTA/Angio
≥340
≥4.15
PSV ≥ 220ICA:CCA ≥ 2.7
AbuRahma 2008 [28]
215
CTA/Angio
≥325
≥119
PSV ≥ 224EDV ≥ 88ICA:CCA ≥ 3.4
Zhou 2008 [10]
22
Angio
≥300
≥90
≥4
Setacci 2008 [7]
814
Angio
≥300
≥140
≥3.8
PSV ≥ 175EDV ≥ 88ICA:CCA ≥ 3.4
Cumbie 2008 [8]
129
Angio
≥205a
NS
≥2.6
Suggested DUS surveillance protocols for the detection of in-stent restenosis for stented carotid arteries are similar to those following carotid endarterectomy. An early, initial postprocedure DUS should be obtained (preferably within 1 month of the procedure) to establish a baseline velocity profile to which follow-up scans can be compared. Additionally, early initial DUS velocities can be correlated to the poststent angiographic images (Fig. 7.1) as well as confirm the technical success of the procedure and extent of contralateral disease. Additional information from both color flow and B-mode imaging can help corroborate velocity data to better define the lumen diameter. Patency and structural deformities of the stented vessel such as poor wall apposition and stent migration may also be detected at the initial and in subsequent duplex examinations.
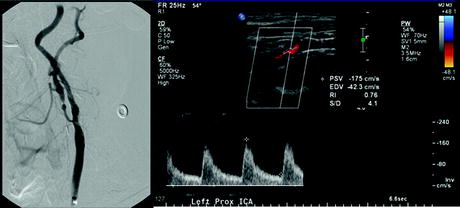
Fig. 7.1
Completion angiography after internal carotid artery (ICA) artery stenting shows <25% residual stenosis. However, postprocedure day 1 baseline duplex ultrasound peak systolic velocity measures 175 cm/s, which would indicate ≥50% stenosis in a native carotid artery. Native artery velocity criteria for internal carotid artery stenosis tend to overestimate actual moderate to mild lesions in stented ICAs
The interval between duplex surveillance of stented carotid arteries should be dictated by the observed timing of recurrence of stenosis. Armstrong found that time to progression of high-grade stenosis after carotid artery stenting was 14 ± 10 months [9]. Zhou had an average time to reintervention of 11 months (range 1–24 months) [10]. A reasonable schedule for follow-up of the stented carotid artery is 6-month intervals for the initial 2 years then yearly thereafter in patients whose initial DUS indicate a ≤50% residual stenosis. If initial DUS indicates ≥50% residual stenosis then the interval between DUS can be shortened to every 3–6 months until adequate stabilization or reintervention occurs.
3.2 Renal Artery Stents
Renal artery stenting is used for treatment of renal artery stenosis that may lead to deterioration in renal function and/or severe hypertension. In-stent restenosis caused by intimal hyperplasia can occur in up to 20% of stented renal arteries, typically in the first 3–12 months after placement. Progression of atherosclerotic disease, typically at either end of the stented arterial segment can also occur during the follow-up period and may require treatment. Reintervention is considered to prevent stent occlusion or recurrence of symptoms when there is hemodynamically significant in-stent restenosis or progression of atherosclerotic occlusive disease.
For the diagnosis of native renal artery stenosis, a PSV ≥200 cm/s and a renal aortic ratio (RAR) ≥3.5 (calculated by dividing the PSV of the renal artery by the PSV of the adjacent aorta) has been shown to correlate with angiographic stenosis of ≥60%. There are no prospective studies validating the use of DUS velocity measurements to angiographic in-stent restenosis in stented renal arteries. However, large elevations in renal artery stent PSVs are likely to indicate in-stent restenosis (Fig. 7.2).
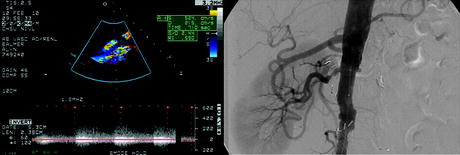
Fig. 7.2
Surveillance duplex ultrasound of renal artery stent demonstrates elevated peak systolic velocity of 524 cm/s and end diastolic velocity of 215 cm/s highly suggestive of a high grade in-stent restenosis. (b) Angiogram showing confirmation of the right renal artery in-stent restenosis
In one study by Chi et al., patients with renal artery stents underwent angiograms if they had suspicion of in-stent restenosis by native artery DUS criteria standards for renal artery stenosis. Less than half studied with angiography actually had ≥50% in-stent restenosis. Based on their analysis of patients studied with both DUS and angiography and who had in-stent restenosis, a PSV ≥395 cm/s would yield a sensitivity of 83%, specificity of 88% with an overall accuracy of 87% to predict a ≥70% renal artery in-stent stenosis. A RAR of ≥5.1 would give an accuracy of 88%, sensitivity of 94%, and specificity of 86% for the detection of ≥70% renal artery in-stent restenosis [11].
Alternatively, findings from the RENAISSANCE renal artery stent trial indicate that native artery criteria (PSV ≥225 cm/s with poststent turbulence and/or an RAR ≥3.5) have a high level of concordance (86.6%) with angiographic stenosis (defined as ≥60%) [12]. Pending a larger prospective trial comparing DUS with angiography to establish in-stent restenosis criteria, the most prudent means of detecting in-stent restenosis seems to be with a combination of clinical status and the PSV and RAR trends. Since restenosis from intimal hyperplasia is most likely to occur in the first year after stent placement, DUS every 3 months in the first year and yearly or every 6 months thereafter is a reasonable approach to DUS surveillance of renal artery stents.
3.3 Superior Mesenteric Artery (SMA) Stents
Superior mesenteric artery stenting is an increasingly utilized treatment of symptomatic chronic mesenteric ischemia (CMI) in patients at high risk for an open surgical revascularization. The celiac artery and SMA are almost always severely stenosed or occluded in clear cases of CMI. Regardless, treatment of the SMA alone, either by surgical revascularization or stenting, appears to be adequate to relieve symptoms in the majority of patients [13]. While associated with lower morbidity and mortality than open surgery, SMA stenting does not appear as durable as surgical reconstruction. Reinterventions on SMA stents for symptom recurrence or restenosis occur in up to a third of patients [14].
There are no established DUS criteria of stented SMAs that have been validated against an angiographic standard. Well-established native artery velocity criteria (SMA PSV of ≥275 cm/s is equivalent to a ≥70% angiographic SMA stenosis) have been applied to stented SMAs to help identify recurrent disease. However, it is unclear if reintervention in stented SMAs with evidence of restenosis based on native SMA DUS criteria for stenosis affects patency rates or recurrence of symptoms [15]. It does appear DUS criteria for native SMA disease likely overestimate the severity of stenosis when applied to stented SMAs. In one study after successful SMA stenting with documented <30% residual angiographic stenosis, SMA PSVs were uniformly found to be ≥275 cm/s on postprocedure DUS examination (Fig. 7.3). Average postprocedure PSVs were 336 ± 45 cm/s after successful stenting, significantly reduced compared to preoperative values, but still in excess of native artery criteria for ≥70% stenosis (Fig. 7.4) [3].
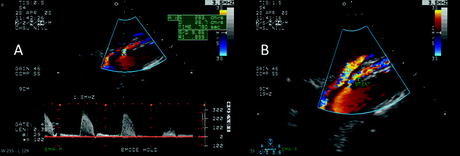
Fig. 7.3
Superior mesenteric artery peak systolic velocities (PSV) before and after SMA stenting in a series of 35 patients. PSV decreased significantly (p = 0.039) after stent placement but remained above native artery criteria for ≥70% stenosis (275 cm/s) despite a less than ≤30% residual stenosis by completion angiography [3]
Fig. 7.4
Surveillance duplex ultrasound scan 1 month following angiographically successful (<30% residual stenosis) superior mesenteric artery (SMA) stenting. (a) SMA stent peak systolic velocity is elevated at 283 cm/s and waveform analysis shows spectral broadening. (b) Color flow image of celiac trunk and SMA origins suggests a widely patent stent consistent with completion angiography
Restenosis can occur at a mean follow-up time of 8.5 ± 1.9 months according to a recent series of 49 patients treated with mesenteric stents. In this group of patients, nearly 30% of treated patients underwent reintervention at a mean of 17 months from the original treatment. Of the patients who underwent reintervention based on ultrasound detected restenosis, there was no significant difference in the PSVs compared to patients that did not undergo reintervention (420 cm/s vs. 403 cm/s). However, EDVs did significantly differ in those undergoing reintervention (169 cm/s) versus those not undergoing reintervention (79 cm/s) [14]. Armstrong had a similar finding of elevated EDV (168 cm/s) in SMA stent patients undergoing reintervention [16]. Given these current figures, a reasonable approach to surveillance seems to be to obtain a DUS soon after placement of an SMA stent to establish baseline PSV and EDV values. Progressive elevation of the PSV and/or EDV may suggest restenosis and can be used to help guide clinical decision making towards repeat angiography and possibly reintervention. B mode imaging and poststenotic turbulence may also play a role to help identify restenosis, but these parameters have not been systematically evaluated. The interval between DUS surveillance scans should be every 3–6 months in light of the observed early mean time to restenosis.
3.4 Superficial Femoral Artery (SFA) Stents
In many centers SFA stenting is now preferred treatment for TASC A and B lesions producing lower extremity symptoms and is frequently used for more extensive lesions as well. The most common mode of failure in the stented SFA is in-stent restenosis which occurs in up to 40% at 1 year. Close surveillance of SFA stents may therefore be important in maintaining patency. Thus far, DUS surveillance of stented SFAs has used criteria extrapolated from those developed for native arteries and vein graft surveillance. Only one study has directly compared DUS with angiography in stented SFAs using DUS as a screening tool to identify recurrent stenoses [17]. Both PSV and velocity ratios were found to accurately predict recurrent stenosis. A greater than 80% stenosis was identified using a PSV of ≥265 cm/s. A velocity ratio between the upstream untreated artery and the treated artery segment of ≥3.5 also had a high sensitivity and specificity for the detection of ≥80% in-stent restenosis. Combining the two does not significantly add to the accuracy of detection of restenosis (Table 7.2). Intimal hyperplasia can at times be seen on color flow imaging during surveillance duplex of SFA stents and may give important clues as to lumen size in the absence of elevated velocities (Fig 7.5).
Table 7.2
In-stent restenosis (ISR) duplex criteria: renal, SMA, SFA
N | Validation test | PSV (cm/s) | Additional factors | |
|---|---|---|---|---|
Renal artery stent | ||||