Very High Frequency Digital Ultrasound Scanning in LASIK and Phakic Intraocular Lenses
VERY HIGH FREQUENCY DIGITAL ULTRASOUND ARC B-SCANNER
Digital signal processing of ultrasound backscatter was pioneered by Coleman and others at the Bio-Acoustic Research Facility in the Department of Ophthalmology of Cornell University in the 1980s. In the early 1990s we began integration of very-high-frequency (VHF) probes originally designed for quality control in the metallurgical industry into the Cornell University three-dimensional (3-D) ultrasound scanning prototype. Pavlin et al. (1), at the University of Toronto, also produced a VHF ultrasound scanner but it was based only on conventional analog signal processing; the Toronto prototype became a commercial unit called the Ultrasound Biomicroscope (UBM) (Humphrey Zeiss; Dublin, CA). The Cornell prototype became a commercial unit called the Artemis (2) (Figure 4.1) (Ultralink LLC; St. Petersburg, FL).
The Artemis arc-scanner was designed to help ophthalmologists in all disciplines, but particularly in refractive, cataract, and presbyopic surgery, to improve anatomic diagnosis for surgical planning and postoperative diagnostic monitoring. The Artemis’s primary functions are to provide very high resolution ultrasound B-scan imaging of the anterior and posterior segment, high-precision 3-D mapping of individual corneal layers, 3-D mapping of anterior segment dimensions, and axial length by a combined additional immersion A-scan probe. The Artemis is designed to scan in an arc of adjustable radius, thus following the curved surfaces of either the cornea, the iris plane, or the globe, and enabling wide segments (up to 15 mm) to be imaged in one scan sweep.
The resolution of the Artemis, when set to scan cornea, is sufficient to distinguish individual corneal layers, such as the epithelium, stromal component of the flap, residual stromal bed, and others, all in 3-D, thanks to multimeridional scanning. The Artemis VHF digital ultrasound technology is able to consistently detect internal corneal lamellar interfaces (such as the keratectomy track) because of the permanent “mechanical” interface present, even years after surgery, and despite total optical transparency. Optical coherence tomography (OCT) has been shown to be capable of detecting the interface in LASIK in the early postoperative period, but this ability diminishes with time as edema subsides in the cornea, and the optical properties of the corneal lamellar interface homogenize. We have scanned former nonfreeze keratomileusis patients more than 10 years after surgery and have been able to clearly delineate, end-to-end, the stromal lamellar interface (Figure 4.4A).
In 1993, we reported the first confirmed measurement of the epithelium of the cornea in vivo, using VHF ultrasound, demonstrating that acoustic interfaces that were being detected were indeed located spatially at the epithelial surface and at the interface between epithelial cells and the surface of Bowman’s layer (3). We also reported the first high-precision 3-D thickness mapping of the corneal epithelium and flap (4). This system, acquiring a series of parallel, rectilinear B-scans, was capable of mapping the epithelial layer thickness within the central 3- to 4-mm area. By using digital signal processing techniques (the I-scan), a 2.0-micron reproducibility
for epithelial thickness measurements was obtained (5). The I-scan is an A-scan like trace produced by digital processing of the stored radiofrequency ultrasonic data. The trace represents the instantaneous energy intensity with time, as opposed to the average amplitude, as is represented by the conventionally used A-scan. Previous studies demonstrated that the I-scan more than doubles the measurement precision afforded by the analog A-scan process (5). We further improved epithelial thickness measurement precision to 1.3 microns by increasing the fidelity of the digitized signal (6). Measurement precision within the cornea in LASIK has been formally tested and published. The axial measurement precision within 9-mm wide corneal scans is of approximately 1 μm (2). When scans are expanded to include the entire anterior segment (15-mm width), the axial precision remains similar, whereas the lateral precision for measuring angle-to-angle is 0.15 mm and from sulcus-to-sulcus is 0.20 mm (7).
for epithelial thickness measurements was obtained (5). The I-scan is an A-scan like trace produced by digital processing of the stored radiofrequency ultrasonic data. The trace represents the instantaneous energy intensity with time, as opposed to the average amplitude, as is represented by the conventionally used A-scan. Previous studies demonstrated that the I-scan more than doubles the measurement precision afforded by the analog A-scan process (5). We further improved epithelial thickness measurement precision to 1.3 microns by increasing the fidelity of the digitized signal (6). Measurement precision within the cornea in LASIK has been formally tested and published. The axial measurement precision within 9-mm wide corneal scans is of approximately 1 μm (2). When scans are expanded to include the entire anterior segment (15-mm width), the axial precision remains similar, whereas the lateral precision for measuring angle-to-angle is 0.15 mm and from sulcus-to-sulcus is 0.20 mm (7).
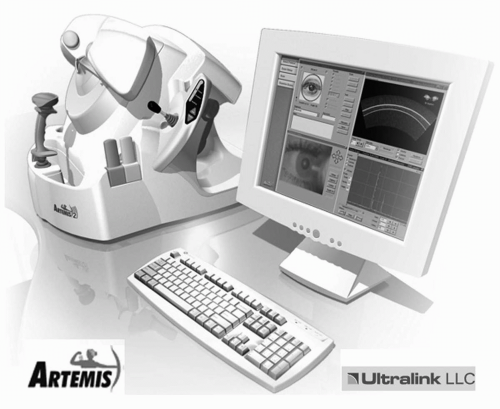 Figure 4.1. Artemis 2: VHF digital ultrasound 50-MHz 3-D arc B-scan (Ultralink, LLC). (see color image) |
The VHF digital ultrasound system has been used to characterize central epithelial lenticular anatomy and to demonstrate that the power of the epithelium is not constant from eye to eye (8). We have also examined the shape of Bowman’s layer (9), the measurement of anterior corneal scars for planning therapeutic keratectomy (10, 11, 12), the quantitative analysis of corneal scarring (haze) after photorefractive keratotomy (PRK) (13), and the measurement of the depth of radial keratotomy incisions (14). In 1999, we were the first to publish on the analysis of epithelial and stromal changes after lamellar corneal surgery, demonstrating significant epithelial changes after uncomplicated LASIK and the masking of stromal surface irregularities that were producing optical complications (6). This chapter will be focused on this application.
ARTEMIS TECHNOLOGY
Details of the scanning and signal processing technology have been described comprehensively elsewhere (2, 3,10,15). A broad-band 50-MHz VHF ultrasound transducer (bandwidth approximately 10 to 60 MHz) is swept by a high-precision arc mechanism to acquire B-scans as arcs that follow the surface contour of anterior or posterior segment (with a reverse arc) structures of interest. The Artemis possesses a unique scan-arc adjustment mechanism that allows maximum perpendicularity (and signal-to-noise ratio) to be obtained for scanning any of the different curvatures within the globe (cornea, iris plane, retina). Ultrasound data are digitized and stored. The digitized ultrasound data are then transformed, using digital signal processing technology. Digital signal processing significantly reduces noise and enhances signal-to-noise ratio. We have demonstrated that using digital signal processing on 50-MHz ultrasound data doubles resolution and increases measurement precision by a factor of 3 when compared to conventional analog processing of the same very-high-frequency data (5). Scanners produced by Paradigm (UBM), OTI (35 MHz), and others use only analog ultrasound processing. As a result of coaxial, simultaneous video image capture at each scan position (Figure 4.2), a correlation of measurements made from the ultrasound scans can be formed into visible ocular landmarks (such as the corneal reflex) that
enable accurate 3-D reconstructions to be made from multiple meridional scans and to allow production of corneal mapping. Simultaneous optical and ultrasound imaging also enables the anterior segment sulcus-to-sulcus distance to be determined in a verified plane, such as the visual axis for surgical planning in phakic intraocular lens (IOL) surgery. For the first time, it also enables localization of the optimum implantation site for devices, such as scleral expansion bands for presbyopia, which need to be positioned based on internal (invisible) landmarks. The Artemis possesses a software application that will give the surgeon external landmarks, identifiable under the operating microscope, that identify the location of lens equator based on a caliper measurement from the corneal reflex (Figure 4.3).
enable accurate 3-D reconstructions to be made from multiple meridional scans and to allow production of corneal mapping. Simultaneous optical and ultrasound imaging also enables the anterior segment sulcus-to-sulcus distance to be determined in a verified plane, such as the visual axis for surgical planning in phakic intraocular lens (IOL) surgery. For the first time, it also enables localization of the optimum implantation site for devices, such as scleral expansion bands for presbyopia, which need to be positioned based on internal (invisible) landmarks. The Artemis possesses a software application that will give the surgeon external landmarks, identifiable under the operating microscope, that identify the location of lens equator based on a caliper measurement from the corneal reflex (Figure 4.3).
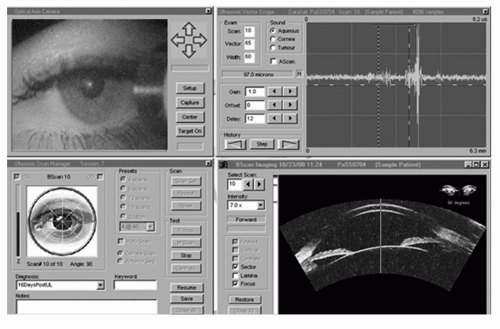 Figure 4.2. Artemis advanced control display panel. The upper left panel shows an infrared real-time video image of the eye being scanned in which eye position can be verified and monitored during scanning. The lower left panel is used for scan motion control, whereas the upper right panel displays the raw ultrasound echo data. In this screenshot, the lower right anterior segment scan was known to have been taken in the horizontal plane when the eye was fixating on a light source coaxial with an alignment beam that is centered on the corneal vertex (corneal reflex visible). The patient’s angle kappa produces a geometric tilt of the anterior segment compared to the visual axis (green line). The corneal reflex is an excellent landmark for correlating scans taken before and after anatomy by subtraction imaging. (see color image) |
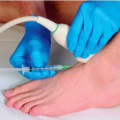
Although Artemis scanning is a noncontact test, it does require an ultrasonic standoff medium, and thus provides the advantages of immersion scanning. The Artemis 2 was designed specifically to enable quick setup of this immersion scanning by a novel reverse-immersion technique. The patient sits and positions his or her chin on a three-point forehead and chin rest, while placing the eye into a soft rimmed eye cup, akin to a swimming goggle (Figure 4.4). The sterile coupling fluid fills the compartment in front of the eye, and the scanning is performed via an ultrasonically transparent (sterile) membrane, without the need for a speculum. Thus, there is no contact by the scanner probe with the eye. Performing a 3-D scan set with the Artemis requires 2 to 3 minutes for each eye.
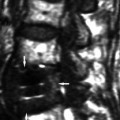
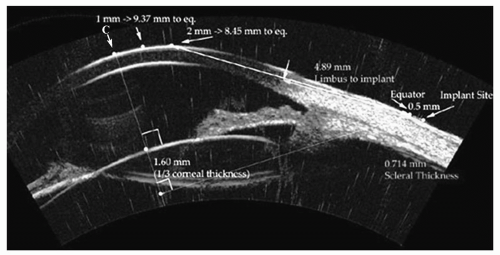 Figure 4.3. Annotated arc B-scan ultrasound image showing all measurements required for the accurate implantation of a scleral expansion band. The intersection of the cornea with the line-of-sight is indicated by arrow and C. The lens equator plane is localized based on the ultrasound image, and the eternal intersection of this plane at the scleral surface is localized. The distance from C to the equatorial plane is identified for exact localization of the scleral implant to achieve maximum effect. The thickness of the sclera is provided to maximize depth without intraoperative exposure of the choroid. (see color image) |
CLINICAL USE
Two-dimensional B-scan Imaging
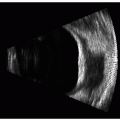
Figure 4.5 demonstrates an arc B-scan taken along the horizontal plane of the cornea of a patient 4 months after LASIK. The interfaces of saline-epithelium (E), epithelium-Bowman’s (B), the keratectomy interface (K), and the posterior surface (endothelial-aqueous) (P) are clearly visualized along the 9-mm chord-length of the B-scan preoperatively. The keratectomy interface can be seen with an entrance track nasally (S), coursing
temporally to a stop at the hinge (H). Magnification of the keratome entrance position shows that the flap was not fully distended and Bowman’s was not fully apposed, potentially inducing astigmatism and/or increasing the risk of epithelial ingrowth. The interface track has a small irregularity (I) (magnified insert), perhaps caused by a patient squeeze during passage of the keratome. The flap can be seen to be thicker temporally and thinner (T) nasally.
temporally to a stop at the hinge (H). Magnification of the keratome entrance position shows that the flap was not fully distended and Bowman’s was not fully apposed, potentially inducing astigmatism and/or increasing the risk of epithelial ingrowth. The interface track has a small irregularity (I) (magnified insert), perhaps caused by a patient squeeze during passage of the keratome. The flap can be seen to be thicker temporally and thinner (T) nasally.
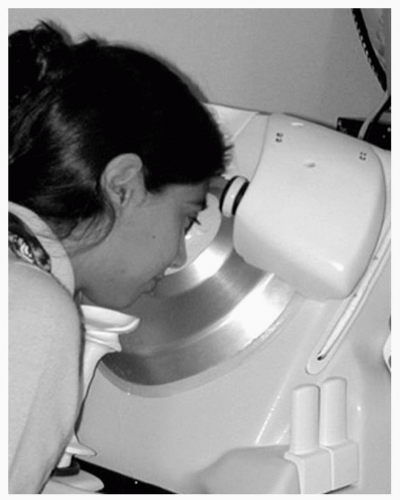 Figure 4.4. Patient demonstrating the simple setup of the reverse immersion scanning system. Head stabilization is achieved by the patient resting against a tripod of support points; an adjustable chin rest and two adjustable forehead rests. The eye rests comfortably in a sterile cushioned eye-seal that produces a separate sterile compartment for the eye, from the fluid-filled scanner mechanism compartment. |
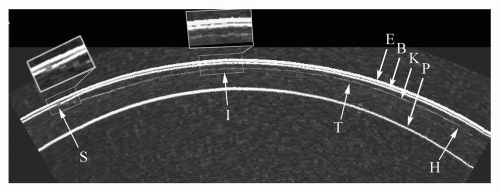 Figure 4.5. Horizontal B-scan through the visual axis of a cornea 4 months post-LASIK. The interface is clearly visualized throughout the length of the keratectomy. See text for annotations. |
Three-dimensional C12 Diagnostic Display
This display configuration and format form the mainstay, and state-of-the-art, in anatomic diagnosis after LASIK. Figure 4.6 shows such a display created from scans of the right cornea of a patient scanned before and 6 months after LASIK for myopia of −4.75, −0.25 × 55. Uncorrected visual acuity (UCVA) was 20/16 with a residual subjective manifest refraction of plano. Videokeratographic examination showed the customary central flattening with a small surface with-the-rule astigmatism. The lamellar interface was only faintly detectable in places by slit-lamp examination.
This display of 12 pachymetric maps was designed as a standardized layered pachymetric summary of corneal anatomic changes following LASIK. We have chosen to name this presentation a C12 diagnostic display, for it consists of 12 corneal pachymetric topographic maps of the same cornea before and after LASIK. Each map depicts the local thickness of a given corneal layer represented on a color scale in μm. The C12 display was designed as a layout of map groupings by time, anatomic depth, and calculation. Columns 1 and 2 depict maps preoperatively and postoperatively, respectively. Within these two columns, the rows represent depth within the cornea. Thus, the first column depicts the thickness profiles of the preoperative corneal epithelium (Figure 4.6; map 1), full stroma (Figure 4.6; map 2), and full cornea (Figure 4.6; map 3), respectively. The second column demonstrates the postoperative thickness profiles of the corneal epithelium (Figure 4.6; map 4), stroma (Figure 4.6; map 5), and full cornea (Figure 4.6; map 6). Epithelium, full stroma, and full cornea color scales are identical for preoperative and postoperative stages to allow direct color (thickness) comparison. The third column consists of calculated maps representing topographic epithelial change (Figure 4.6; map 7) (derived by subtraction of the preoperative from postoperative epithelial map), stromal change (Figure 4.6; map 8) (derived by subtraction of the postoperative from preoperative stromal map), and (calculated) original flap produced at the time of surgery as a Flap Profile (16) (Figure 4.6; map 9). The Flap Profile is calculated by adding the
stromal component of the flap (Figure 4.6; map 12) to the preoperative epithelial thickness. The fourth column represents postoperative corneal layers: the thickness profile of the flap at 6 months (including epithelial changes) (Figure 4.6; map 10), the 3-D thickness profile of the residual stromal layer (stroma excluding the flap) (Figure 4.6; map 11), and the postoperative stromal component of the flap (Figure 4.6; map 12).
stromal component of the flap (Figure 4.6; map 12) to the preoperative epithelial thickness. The fourth column represents postoperative corneal layers: the thickness profile of the flap at 6 months (including epithelial changes) (Figure 4.6; map 10), the 3-D thickness profile of the residual stromal layer (stroma excluding the flap) (Figure 4.6; map 11), and the postoperative stromal component of the flap (Figure 4.6; map 12).
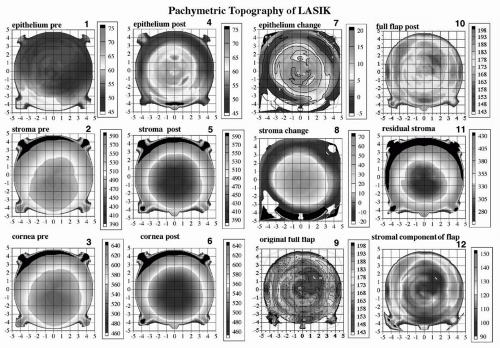 Figure 4.6. C12 display of the cornea of a patient pre- and 6 months post-LASIK OS. All 12 maps are pachymetric representations of particular corneal layers depicted on a color scale in microns. The preoperative epithelial (1), stromal (2), and full corneal (3) thickness maps appear in the first column. To the right of each of these maps (column two) is the post-LASIK pachymetric maps of epithelium (4), stroma (5), and full cornea (6) on identical color scales for direct comparison to preoperative. The third column depicts calculated maps only. The calculated epithelial change map (7) (column 3, row 1) is derived in point-by-point subtraction of the preoperative from the postoperative epithelial pachymetric map. Thus, the epithelial change map shows on a color scale the number of microns that increase as a result of surgery. Note that the pattern of epithelial thickness change is such that it is greatest centrally, with a decrease in a symmetric centrifugal fashion, thus producing an increase in outer curvature of the postoperative cornea. Note that the area of epithelial thickening is confined to the ablation zone or the zone of surgical corneal flattening. The calculated stromal change map (8) (column 3, row 2) is derived in point-by-point subtraction of the postoperative from the preoperative stromal pachymetric map. Thus, the stromal change map shows on a color scale the number of stromal microns that decrease as a result of surgery in a topographic fashion and hence represents the ablation volume of tissue. The calculated map of the “original flap” (9) (column 3, row 3) is derived by addition of the preoperative epithelial thickness profile (1) to the postoperative “stromal component of the flap” (12) (column 3, row 3). One must perform a temporally displaced addition of epithelial and stromal components of the flap separately because of the epithelial changes present post-LASIK, leading to a flap anatomy post-LASIK (10) (column 3, row 1) that is different from that at the time of creation by the keratome. Finally, the pachymetric topography of the “residual stromal layer” comprising all stroma beneath and around the flap is shown in map 11 (column 3, row 2). This map can be critically important in the determination of adequacy of the stromal bed for further LASIK enhancement surgery under the flap in that the thinnest point is not always located centrally and may be missed by any form of intraoperative single-point measurement of the bed. Thus, the “C12” display is set out to be read by temporal grouping (columns) or anatomic grouping (rows). See text for further descriptive analysis. (see color image) |
The profile map of the preoperative epithelium OS was approximately 9.25 mm in diameter (Figure 4.6; map 1). The epithelial change map (Figure 4.6; map 7) shows the pattern of epithelial thickening and thinning. The epithelium thickened between 15 and 20 μm centrally, with a concentric decrease in thickening progressing toward the 7.5-mm diameter zone. Interesting to note is that within a 1-mm annulus at the 8-mm diameter zone there was circumferential epithelial thinning after LASIK. We also note in this case that the pattern of epithelial change increased anterior corneal power (greater tissue addition centrally), but the patient had a plano refraction
postoperatively. This indicates that the optical power shift produced by the epithelium, in this case, was exactly as expected by the nomogram setting used.
postoperatively. This indicates that the optical power shift produced by the epithelium, in this case, was exactly as expected by the nomogram setting used.
The stromal change map (Figure 4.6) shows a wellcentered difference around the center (0,0 coordinate) of the cornea. The difference in stromal thickness prior to surgery is 70 μm centrally, decreasing to zero at the 7.5-mm diameter zone. Thus, the zone depicted on the color scale from green to red represents the effective volume of tissue change in the cornea (the predicted central ablation depth by the Nidek EC5000 readout was 73 μm for a 6.5-mm optical zone, transition to 7.5 mm). Within the peripheral 8- to 9-mm zone there is annular stromal thickening of between 10 and 20 μm. We were the first to publish this finding (2), and Roberts has proposed a mechanism to account for it (17). Also interesting to note is that the annulus of stromal thickening coincides with the annulus of epithelial thinning described previously, consistent with the Law of Epithelial Compensation (see later text).
Examination of the anatomy of the calculated original flap (Figure 4.6; map 9) by the Moria LSK-One keratome (predicted mean 160 μm) reveals a central thickness of 158 μm. Within the 4-mm diameter zone, the flap thickness was generally homogeneous between 160 and 165 μm, although irregularity is evident. Note that direct measurement of the flap thickness at 6 months (Figure 4.6; map 10) would not provide an accurate description of the flap anatomy at the time of creation because of the epithelial thickness changes present after LASIK. The stromal component of the flap (Figure 4.6; map 12) can be seen to possess a thickness profile of approximately 110 to 120 μm within the central 6-mm diameter zone, except for the quadrant superotemporally within the 4-mm diameter zone, where this is decreased to approximately 95 μm. This area may have been thinner because of the presence of thicker epithelium preoperatively in the corresponding quadrant and the passage of the keratome parallel to the surface of the cornea during applanation by the keratome head.
The 3-D thickness profile of the residual stromal layer (Figure 4.6; map 11) shows a thinnest point of 280 μm, approximately 1 mm inferior to the center of the cornea. This is an example of why intraoperative handheld ultrasound residual stromal pachymetry can be misleading lateral position variations of only a few hundred microns could completely alter the course of an ablation by providing a residual stromal thickness that is not the minimum.
PREOPERATIVE ASSESSMENT
Corneal Thickness Profile: Minimum Thickness and Screening for Keratoconus
The importance of accurate preoperative corneal thickness profile determination is now generally accepted as an aid in the determination of candidacy for safe LASIK with avoidance of ectasia (18). Concentricity of the thickness profile around the corneal center is also a contributor in screening for keratoconus. (Because of the significant, added expense to the patient for Artemis scanning, at present we offer to, but do not routinely, use this preoperatively in every patient.) Current indications for Artemis scanning in our practice include a greater than 15-μm discrepancy between Orbscan and handheld ultrasound pachymetry and a predicted residual stromal thickness of less than 300 μm, based on whichever is the thinnest of Orbscan or handheld-ultrasound pachymetry.
The accuracy


Related posts:
Stay updated, free articles. Join our Telegram channel
Full access? Get Clinical Tree
