Ultrasonic Systems
The two most commonly used ultrasonic imaging modalities in ophthalmology are termed A-mode and B-mode. Each presents anatomic information in a distinctive display format. A-mode refers to a graphic display of echo amplitude as a function of distance along one line of sight, or vector (Figure 2.1). A-mode was the first display mode to be used in ophthalmology (1). It is used in characterization of tissues such as intraocular tumors and vitreous hemorrhage. It is also widely used in biometric applications, such as axial length measurement and corneal pachymetry. B-mode, introduced in the late 1950s (2), refers to a display of two-dimensional cross-sectional images (Figure 2.2). These images provide representations of the anatomy of the eye and orbit that have proven useful in diagnosis of a broad spectrum of disease states. A- and B-mode systems may be found in instruments dedicated to one function only or may be combined in a single instrument. A-mode displays may be generated using a special purpose A-mode transducer or may be generated from individual vectors comprising a B-mode display.
Although the basic physical principles discussed in Chapter 1 underlie the operation of all ultrasonic systems, it is electronic and computer technology that translates these principles into practical clinical instruments. The electronic and computer components of modern ultrasound scanners are used to generate ultrasonic pulses, process echoes, and display images and information. This chapter discusses the electronic components used in each of these stages for generation of A- and B-mode images and how the characteristics of the individual components influence the quality of the resulting images. It also discusses the means of recognizing and eliminating misleading results stemming from improper system adjustment. Throughout this chapter, emphasis is given to the overall quality of an ultrasonogram in terms of three parameters: resolution, sensitivity, and dynamic range. Spatial resolution, defined in Chapter 1, refers to the ability to distinguish two nearby reflectors. Temporal resolution, also to be considered here, refers to the ability to visualize tissue changes occurring over time. Sensitivity refers to the weakest reflector that can be detected in a displayed ultrasonogram. Dynamic range describes the spread of echo amplitudes that can accurately be portrayed in an ultrasonogram.
In addition to A- and B-modes, this chapter will describe modalities less commonly used or more recently introduced in ophthalmology, including Doppler, M-mode, and swept-mode.
SYSTEM COMPONENTS
The ultrasound system, schematically represented in Figure 2.3, consists of the following components:
Transducer/probe
Servo (for B-mode systems)
Pulser
Receiver
Scan converter and display
The trend for system design in modern instrumentation is toward integrated digital components. By placing the previously mentioned functions on a single computer board, the system becomes less expensive, more reliable, and easier to repair. Because of this integration, not all of the components are represented as stand-alone devices, but we shall consider them as functionally separate entities.
PROBE
In B-mode systems, a mechanism is needed to sweep the ultrasound beam across a scan plane. In mechanical sector
scan systems, which dominate in ophthalmology, the transducer is enclosed within a sealed, fluid-filled housing with an acoustically transparent cap at one end. In operation, the transducer is pivoted over an angle of 45 to 60 degrees at a rate of several times per second. This refresh rate, called the frame rate, is typically about 10 Hz, but in some instruments rates of 30 Hz or more have been attained.
scan systems, which dominate in ophthalmology, the transducer is enclosed within a sealed, fluid-filled housing with an acoustically transparent cap at one end. In operation, the transducer is pivoted over an angle of 45 to 60 degrees at a rate of several times per second. This refresh rate, called the frame rate, is typically about 10 Hz, but in some instruments rates of 30 Hz or more have been attained.
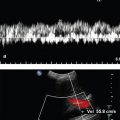
 Figure 2.1. A-scans consist of a plot of echo amplitude as a function of range. This figure shows a typical A-scan along the axis of a normal eye performed in contact mode through the eyelid. Peaks correspond to eyelid (L), cornea (C), anterior (AL), and posterior lens (PL) surfaces and retina (R). |
SERVO
The servo is a device that controls the motion of the transducer within the probe and registers the orientation of the transducer at each moment of time. The servo controls a motor incorporated within the probe, and, as the transducer moves, the servo continually monitors its position. Each scan frame consists of a fixed number of vectors (typically 256) that are evenly spaced within each scan frame. As the motor sweeps the transducer, the servo monitors its position and issues signals to the pulser and other components such that pulse/echo vectors are acquired at appropriate positions.
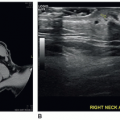
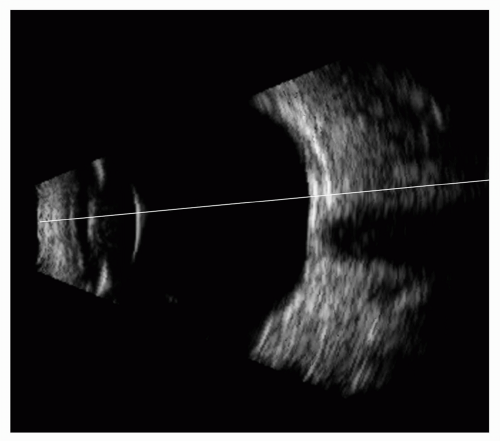 Figure 2.2. Figure 2.1 illustrates the difficulty in establishing context for an A-scan seen in isolation. This B-mode image shows the vector from which the A-scan in Figure 2.1 was derived but in the context of the ocular anatomy revealed in B-mode. |
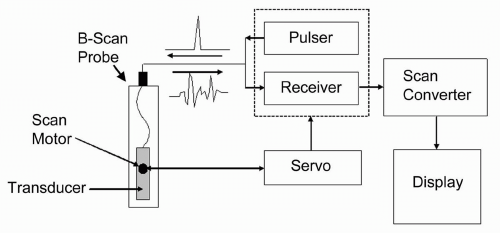 Figure 2.3. Schematic representing electronic components comprising a B-mode system. These include the probe (containing the transducer and mechanical scan mechanism), the pulser/receiver (which excites the transducer and amplifies echoes), the servo (which controls and monitors transducer orientation), the scan converter (which digitally formats echo data for display), and the display device. |
PULSER
The ultrasonic pulser repeatedly “shock excites” the transducer with short voltage pulses applied across the electrodes of its piezoelectric element. Each excitation results in the generation of an ultrasonic pulse. The pulse repetition frequency (PRF) must be low enough to allow all returning echoes to be received by the transducer before the next pulse is generated. If we consider the distance to the optic chiasm (the longest distance that we would need to consider) to be approximately 6 cm, then we can determine the two-way travel time for an acoustic pulse to be 2 × 0.06 m ÷ 1,540 m/sec = 0.078 msec. Typically, a 1 KHz pulse repetition frequency is used so that pulses are generated at 1-msec intervals, much longer than the time for pulse and echo travel from the deepest portion of the orbit.
The nature of the ultrasonic pulse is an important factor in determining the characteristics of the emitted acoustic pulse, and hence, of the attainable resolution of the ultrasound system. The characteristics of the pulse that are significant include its form, duration, and amplitude. The most common pulse form used in A- or B-mode imaging is a negative spike, although other modes, such as monocycle (a single sine-wave) are sometimes used. Long excitation pulses result in correspondingly long ultrasonic pulses and concomitantly poor axial resolution. Thus, negative spike impulses are normally designed to be of short duration. Unlike negative spike impulses, monocycles can be tuned to a specific frequency that may or may not correspond to the natural harmonic frequency of the transducer. Monocycles can thus be used to alter
the output of a given transducer to frequencies that are somewhat higher or lower than its natural frequency. The amplitude of the excitation pulse is important in achieving adequate sensitivity. Typically, an amplitude of 100 to 400 volts will result in ultrasonic pulses large enough to produce detectable echoes from weakly reflecting interfaces, such as the vitreoretinal interface. Although higher voltages provide higher amplitude pulses, and, consequently, increased sensitivity, extremely high voltages can result in distortion of the acoustic pulse (e.g., ringing) that results in decreased axial resolution. In some systems, access to pulser characteristics, such as damping and energy, allows the excitation pulse to be varied between extremes of a short, low-amplitude pulse (providing high resolution and low sensitivity) and a long, high-amplitude pulse (providing low resolution and high sensitivity). In instruments where pulse characteristics are accessible to the user, the clinician can determine the combination of resolution and sensitivity most advantageous in a given situation.
the output of a given transducer to frequencies that are somewhat higher or lower than its natural frequency. The amplitude of the excitation pulse is important in achieving adequate sensitivity. Typically, an amplitude of 100 to 400 volts will result in ultrasonic pulses large enough to produce detectable echoes from weakly reflecting interfaces, such as the vitreoretinal interface. Although higher voltages provide higher amplitude pulses, and, consequently, increased sensitivity, extremely high voltages can result in distortion of the acoustic pulse (e.g., ringing) that results in decreased axial resolution. In some systems, access to pulser characteristics, such as damping and energy, allows the excitation pulse to be varied between extremes of a short, low-amplitude pulse (providing high resolution and low sensitivity) and a long, high-amplitude pulse (providing low resolution and high sensitivity). In instruments where pulse characteristics are accessible to the user, the clinician can determine the combination of resolution and sensitivity most advantageous in a given situation.
RECEIVER
Following transducer excitation, echoes from intraocular and orbital structures impinge upon the transducer, which generates small voltages that are proportional to echo amplitude. These voltages must be processed by the amplifier and associated electronics before they can be displayed in a useful format. The required operations are carried out by the electronic receiver, whose most important function is amplification of the minute voltages generated by the transducer. Gains of 100 (40 dB) or more are needed to raise the amplitudes of these signals from their initially low levels (e.g., 1 millivolt) to levels that are compatible with display requirements. The receiver’s functions include a limiter to prevent damage from the high voltage excitation spike produced by the pulser, sometimes a low-noise pre-amplifier (which, in some systems, is incorporated in the probe) to boost gain, and a variety of other functions, possibly including time-gain control (TGC), compression, noise reject, and envelope detection.
A factor of prime importance when regarding receiver gain is saturation. This occurs whenever the amplified pulse reaches the maximum level (e.g., 5 volts) that the amplifier can supply. If an input signal is too large (or if the gain is too high), saturation occurs and can eliminate clinically significant information regarding echo strength (Figure 2.4). Saturation is always encountered at the beginning of an A- or B-mode display, when a part of the large excitation pulse is picked up by the amplifier. This so-called “main bang” causes a dead space directly in front of the transducer and obliterates echoes from close objects. For this reason, the region of the main bang is not displayed in most scan systems and is the reason that all transducers require some sort of a “stand off” between the transducer and the tissue of interest.
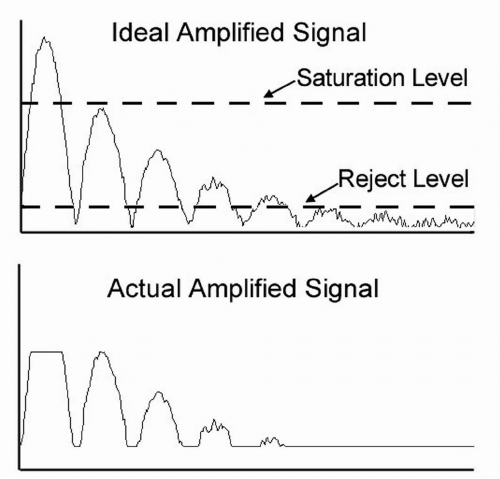 Figure 2.4. All amplifiers have a saturation level above which signals are truncated or otherwise distorted. Reject levels, which may be user-controllable, allow low-level signals (such as noise) to be suppressed. The figure demonstrates the effects of saturation and reject on high- and low-level signals. |
Electronic noise limits the detection of small echoes and can present severe problems with large bandwidth amplifiers. Noise consists of small, random voltage variations that arise because of statistical fluctuations of electrons in system components. At high gains the resultant noise signals appear as “grass” in an ultrasonogram and obscures low amplitude echoes. Some ultrasound units provide reject controls that establish a threshold level that can be set to prevent noise from being displayed. Reject controls, if improperly adjusted, can suppress the display of small or modest echoes that may be diagnostically significant (Figure 2.4).
Amplifiers often include filters that pass signals within only a certain frequency range (usually surrounding the transducer center frequency). This frequency bandpass operation reduces noise from extraneous sources.
Saturation and noise combine to determine the dynamic range of an amplifier. Dynamic range is defined as the spread of input signal amplitudes that result in meaningful output signals. The largest useful input signal is one that just causes saturation; the smallest useful input signal is one that yields an output just above the amplifier noise level (or reject level). Typical amplifiers have dynamic ranges of 60 dB, that is, the maximum input signal is one million times larger than the minimum input signal. This range is sufficient for accurate displays of tissue echoes.
TGC is a form of amplification in which gain increases as a function of range. This feature is designed to compensate for the reduction in echo amplitude that occurs with depth as a result of attenuation of acoustic energy with depth. As noted in Chapter 1, absorption causes a progressive loss in the strength of a propagating ultrasonic pulse. Absorptive attenuation of echo strength increases exponentially with distance. Compensation for this effect involves increasing amplifier gain with time, t, in a manner which is the inverse of absorptive
decay. The appropriate gain is thus of the form of eαct, where α is the absorption coefficient and c is the velocity of ultrasonic propagation. Although TGC is useful, it cannot compensate exactly for absorption in the eye and orbit because absorption coefficients differ greatly in specific ocular and orbital tissues. Most instruments, therefore, do not use the function shown previously, but rather let the user adjust gain arbitrarily over a series of “gates,” that is, successive nonoverlapping range windows. An example of a TGC-modified image is provided in Figure 2.5.
decay. The appropriate gain is thus of the form of eαct, where α is the absorption coefficient and c is the velocity of ultrasonic propagation. Although TGC is useful, it cannot compensate exactly for absorption in the eye and orbit because absorption coefficients differ greatly in specific ocular and orbital tissues. Most instruments, therefore, do not use the function shown previously, but rather let the user adjust gain arbitrarily over a series of “gates,” that is, successive nonoverlapping range windows. An example of a TGC-modified image is provided in Figure 2.5.
Envelope detection, or demodulation, is used to convert the positive and negative voltages (and nulls) that are present in the raw radiofrequency (RF) echo data to positive signals, sometimes referred to as the video signal or envelope. This operation, shown schematically in Figure 2.6, includes a rectification stage, in which all negative voltages are converted to positive values, followed by a suitable low-pass filter operation, which is designed to smooth out the nulls in the rectified RF waveform, without excessive blurring. Demodulation is a crucial step for formation of images, because A- and B-mode images can represent positive values only. It is the signal envelope that is generally used for formation of A-mode and B-mode images.
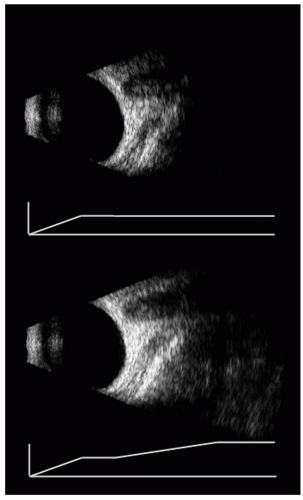 Figure 2.5. Time gain control (TGC) consists of manipulation of gain as a function of range, thus allowing enhancement of signals that would otherwise be lost as a result of attenuation. Top: B-scan of an eye and orbit without use of TGC, as indicated by the flat TGC curve below the image. Bottom: Same image with TGC applied, demonstrating enhancement of the orbit. |
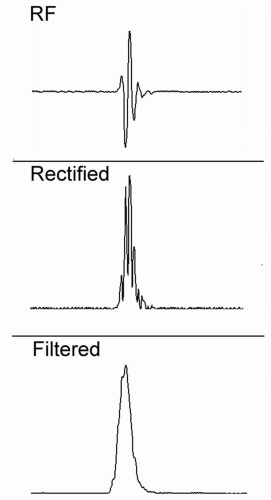 Figure 2.6. This schematic illustrates stages in processing of echo data. Radiofrequency (RF) data represent the positive and negative voltages associated with the positive and negative pressures of the acoustic waves but are inconvenient for display purposes. The first stage of processing is rectification, in which the negative voltages are rendered positive. Center: The rectified data, however, are choppy due to the nulls in the RF waveform. The rectified data are therefore smoothed using a low-pass filter, as shown in the lowermost waveform. This waveform is termed the “envelope” and is used for A- and B-mode displays. |
Compression is an operation that reduces the contrast between high and low amplitude echoes. This operation is important because display devices have a dynamic range that is far less than the amplitude range of linearly amplified echoes. Logarithmic amplification is one such compression scheme. In a standard (linear) amplifier, the gain, G, is independent of the input signal level, and an output voltage is equal to G times the corresponding input pulse. In a logarithmic amplifier, the
output voltage is proportional to the logarithm of the input voltage. As shown in Figure 2.7, this type of amplification yields a large gain for small signals and a small gain for large signals. Thus, a logarithmic characteristic reduces differences in echo levels and permits a wider range of input signals to fall between the noise and saturation levels of an amplifier or digitizer. Logarithmic amplification can be used effectively in B-mode systems, where it compresses the large range of input echo signals to the smaller range of brightness levels that can be presented on digital displays. Other nonlinear functions have also been used to advantage in ultrasonography. An S-shaped function, for example, provides the greatest dynamic range at intermediate signal levels and has proven useful in A-mode examinations, as used in “standardized” A-scan ultrasonography (3). However, such nonlinear amplification makes it difficult to recognize relative echo amplitudes and to compare clinical echo patterns with those obtained in standard systems. Characteristic A-mode patterns can be easily distorted, unless great care is exercised in adjusting all system parameters.
output voltage is proportional to the logarithm of the input voltage. As shown in Figure 2.7, this type of amplification yields a large gain for small signals and a small gain for large signals. Thus, a logarithmic characteristic reduces differences in echo levels and permits a wider range of input signals to fall between the noise and saturation levels of an amplifier or digitizer. Logarithmic amplification can be used effectively in B-mode systems, where it compresses the large range of input echo signals to the smaller range of brightness levels that can be presented on digital displays. Other nonlinear functions have also been used to advantage in ultrasonography. An S-shaped function, for example, provides the greatest dynamic range at intermediate signal levels and has proven useful in A-mode examinations, as used in “standardized” A-scan ultrasonography (3). However, such nonlinear amplification makes it difficult to recognize relative echo amplitudes and to compare clinical echo patterns with those obtained in standard systems. Characteristic A-mode patterns can be easily distorted, unless great care is exercised in adjusting all system parameters.
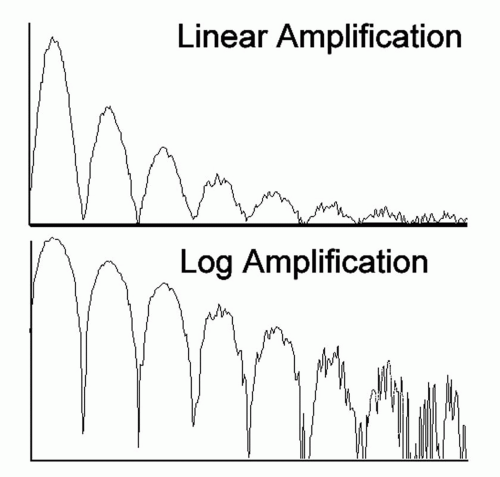 Figure 2.7. Logarithmic amplification may be used to extend dynamic range by reducing contrast between bright and faint echoes. This allows display of faint echoes without causing saturation of bright echoes. |
Demodulation converts RF data into a convenient format for display but does this at the sacrifice of some of the information content inherent in the original echo data. If we recall that the reflection coefficient is defined as (Z2-Z1)/(Z1 + Z2), where (as in Chapter 1) Z refers to acoustic impedance, then we can see that the interface reflection, though of the same magnitude, will change in sign when going from a medium of high to low impedance (Z1 > Z2), versus low to high impedance (Z1 < Z2). This effect is illustrated in Figure 2.8. Thus, RF data can provide information about the direction and magnitude of impedance change across an interface, whereas the demodulated signal provides information regarding the magnitude only. RF data processing is now the preferred approach for extracting subtle characteristics regarding tissue microstructure, and many manufacturers of sophisticated ultrasound systems used in specialties outside of ophthalmology now incorporate RF signal capture.
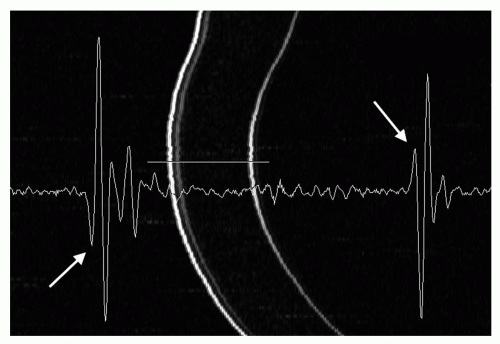 Figure 2.8. Radiofrequency data derived from indicated (horizontal line) vector segment of 50-MHz scan of cornea. Note that the phase of the posterior corneal surface echo (right arrow) is inverted in relation to that of the anterior surface echo (left arrow). This effect arises from the opposite signs of the reflection coefficients of the surfaces, which is positive anteriorly [(1640−1540)/(1640 + 1540) = 0.031] and negative posteriorly [(1540−1640)/(1540 + 1640) = −0.031], where the speed of sound in cornea is 1,640 msec−1, and the saline coupling medium and aqueous are 1,540 msec−1. |
SCAN CONVERTER AND DISPLAY
Early ultrasound instruments used analog devices, such as oscilloscopes or television monitors, as display devices. This has been virtually superseded by digital displays. An analog-to-digital converter (ADC) is needed to use digital display devices.
Analog-to-digital conversion involves transformation of a continuous signal into a discrete binary representation of the kind used in computers. The ADC samples the output of the amplifier at a specific rate, which is normally at least twice the highest frequency component present in the signal. Although the original analog signal is unconstrained in its amplitude values (within the dynamic range of the amplifier), ADC limits the range and number of levels of data that can be acquired. An 8-bit ADC, for instance, can store up to 28 = 256 voltage levels. If a voltage level exceeds the range of the ADC, then it is “clipped.” At present, 8-bit digitizers are most common in ophthalmic ultrasound systems, but deeper bit-depth components are available. A 12-bit digitizer, for instance, can represent 4,096 levels. As deep bit-depth digitizers become incorporated in instruments, the need for compression, which always involves some information loss, will decrease.
For digital display of ultrasound data, a special type of ADC, the scan converter, is used. The scan converter
holds a series of memory locations that map directly to pixels of the digital display. The primary function of the scan converter is transformation of B-mode data into an image representation in digital memory. This operation includes a remapping of every displayed pixel to specific scan vectors and ranges, such that proper image geometry is obtained. With each successive scan frame, scan converter memory is overwritten and the new information displayed on the monitor. When the freeze frame button of the scanner is pushed, the last update of the scan converter memory is continually shown, allowing prolonged examination of individual frames and storage as computer files. Some systems also include a cine-loop feature in which not one but several successive frames, or even short segments of real-time display, are stored in digital memory. This feature allows segments, usually a few seconds in length, of the real-time exam to be reviewed and individual frames to be chosen and stored.
holds a series of memory locations that map directly to pixels of the digital display. The primary function of the scan converter is transformation of B-mode data into an image representation in digital memory. This operation includes a remapping of every displayed pixel to specific scan vectors and ranges, such that proper image geometry is obtained. With each successive scan frame, scan converter memory is overwritten and the new information displayed on the monitor. When the freeze frame button of the scanner is pushed, the last update of the scan converter memory is continually shown, allowing prolonged examination of individual frames and storage as computer files. Some systems also include a cine-loop feature in which not one but several successive frames, or even short segments of real-time display, are stored in digital memory. This feature allows segments, usually a few seconds in length, of the real-time exam to be reviewed and individual frames to be chosen and stored.
Most systems also include a digital-to-analog converter, whose purpose is to convert the digital image information into standard video formats, such as NTSC or S-Video that allow the exam to be recorded on analog devices, such as printers and video recorders.
Most modern instruments use digital displays similar to those used in general purpose computers. Much work by computer designers has gone into high-speed display of images for the very lucrative computer game market, and the ultrasound manufacturers have taken advantage of this technology to develop digital systems that can display images at high refresh rates, with high resolution and with many colors. Digital ultrasound images are typically 512 X 512 pixels in dimension and represent 256 shades of gray.
BANDWIDTH
The electronic components through which the ultrasound signal is processed before being displayed have a property known as bandwidth, which refers to the range of frequencies that a component can process without distortion (usually defined as within a 3 dB range of a perfectly linear response). The echo data undergoing amplification contain a broad spectrum, or bandwidth, of frequency components that must be accommodated by the amplifier and other components. The bandwidth of a pulse is approximately equal to the reciprocal of its duration. If this bandwidth is reduced by a hardware component having a smaller bandwidth, the amplified echo data will be stretched in time, and axial resolution will suffer. Amplification of 0.15-μsec pulses, therefore, necessitates a bandwidth of at least 7 MHz. Failure of one or more components to achieve adequate bandwidth is analogous to listening to a fine classical music recording on a system with a cheap amplifier and/or speakers. In general, an instrument manufacturer will choose components with just sufficient bandwidth for the application, because this is cost-effective and because as bandwidth is increased, noise levels tend to increase. As a consequence, one cannot simply plug a 20 MHz probe into a system designed for a 10-MHz transducer, because (among other things) the bandwidths of one or more components may be inadequate.
A-MODE SYSTEMS
A-mode is the most fundamental ultrasonic modality and forms the basis for more complex modes of operation. The A-mode format consists of a plot of signal amplitude versus range in a single line of sight. As such, A-scan can be performed with a dedicated A-mode instrument (Figure 2.9) or a combined A/B-mode instrument. A-mode displays can also be produced using a B-scan instrument by displaying the envelope along individual vectors comprising the B-mode display.
A-mode systems exist in ophthalmology because of their special role in determining biometric properties of the eye, such as axial length, which play a crucial role in surgical planning (i.e., correct lens implant powering). In design, the A-mode system does not require a motorized probe and, hence, a servo system or scan converter. A-scan units require a high-resolution display to present the A-scan plot, but they do not need to provide many gray levels; even a simple bilevel display will suffice.
For A-mode, the probe typically consists of an unfocused or weakly focused transducer. This is then placed in contact with the eye either directly (usually after application of a drop of a topical anesthesia) or indirectly, using a fluid standoff such as can be established using an eye cup. Most systems for axial measurements with
dedicated A-scan probes provide a fixation light in the center of the transducer that allows the transducer to be aligned with the visual axis.
dedicated A-scan probes provide a fixation light in the center of the transducer that allows the transducer to be aligned with the visual axis.
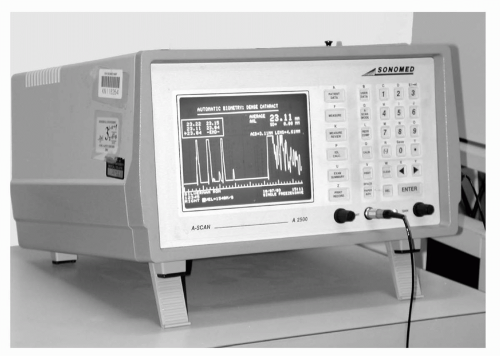 Figure 2.9. A-scan instruments are designed to determine axial length and perform lens-power calculations. Their simplicity allows compact design, with the most modern instruments being virtually handheld. |
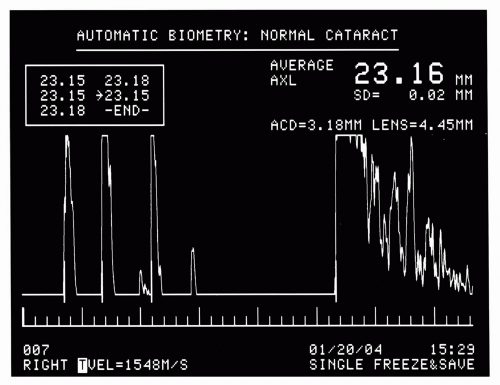 Figure 2.10. Typical A-scan printout for axial length measurement. Left to Right: Echoes represent cornea, anterior and posterior lens, and retina. Note automatic determinations of anterior chamber and lens thickness, in addition to axial length. |
The most common use of A-scan is for axial length measurement (Figure 2.10). These units generally operate at a 10-MHz center frequency with weakly focused transducers: a 5-mm aperture and 20-mm focal length are typical. A-scan probes may be either handheld or attached to a slit-lamp type mount. During operation, excitation pulses are emitted at a high PRF, such that many waveforms are captured per second. A-scan units typically incorporate pattern recognition software that detects the shape of A-scans and automatically acquires those that meet criteria expected when the probe is properly aligned. These data can then be analyzed for measurement of axial length, anterior chamber depth, and lens thickness. Numerous formulas (4, 5, 6, 7) have been developed for computation of lens implant power, based on these measurements and keratometry readings. These computations must take into account speed of sound in special instances, such as a cataractous lens, aphakia, and so forth. A-scan instruments also allow measurements to be made manually from the A-scan trace, which may be necessary in circumstances of unusual ocular anatomy.
Corneal pachymetry (derived from the Greek pachy, meaning “thick,” and metron, meaning “measure”) (8) is a form of A-scan, whose aim is to measure corneal thickness, which is, in principle, no different from axial length measurement. In the case of corneal pachymeters, a transducer frequency of 20 MHz and aperture less than 2 mm are typical, although units operating as high in frequency as 50 MHz are available. Data over a range of about 1.5 mm are plotted. Pachymetry probes, like axial length probes, can be either handheld or mounted. Pachymetry can also be performed intraoperatively in LASIK to measure the thickness of the residual stroma (9). A system whose bandwidth is sufficient for processing 20-MHz data can readily process 10-MHz data as well. In fact, some A-scan instruments incorporate both types of probes. In such a case, the manufacturer will provide excitation pulses and filters suitable for each transducer configuration, along with software suitable for performing the appropriate biometric determinations.
A special purpose A-scan probe is used in an ophthalmic ultrasound technique called standardized echography


Related posts:
Stay updated, free articles. Join our Telegram channel
Full access? Get Clinical Tree
