and Lori Ann Lewis1
(1)
Clinical Research Center of North Texas, Denton, TX, USA
Abstract
Densitometry has primarily been a quantitative measurement technique. The first skeletal images of the spine from a densitometer, as previously seen in Fig. 2.7 in an earlier chapter, were only vaguely reminiscent of the actual bone. The poor image quality had little effect on the ability to quantify the bone density, which was the primary purpose of the various techniques. Continued improvements in DXA technology combined with modern computer capabilities have resulted in dramatic improvements in imaging and acquisition speed. Densitometry manufacturers have proprietary names for lateral spine imaging with their respective devices. Based on the primary application of these images, lateral spine imaging is generically called vertebral fracture assessment or VFA. Truly remarkable images of the spine such as the Hologic Discovery lateral spine image seen in Fig. 13.1 are possible today. When combined with the very low radiation exposure in comparison to conventional X-ray studies, the use of lateral spine DXA imaging for the diagnosis of vertebral fractures and assessment of aortic calcification has become a clinical reality.
VFA Imaging
Densitometry has primarily been a quantitative measurement technique. The first skeletal images of the spine from a densitometer, as previously seen in Fig. 2.7 in an earlier chapter, were only vaguely reminiscent of the actual bone. The poor image quality had little effect on the ability to quantify the bone density, which was the primary purpose of the various techniques. Continued improvements in DXA technology combined with modern computer capabilities have resulted in dramatic improvements in imaging and acquisition speed. Densitometry manufacturers have proprietary names for lateral spine imaging with their respective devices. Based on the primary application of these images, lateral spine imaging is generically called vertebral fracture assessment or VFA. Truly remarkable images of the spine such as the Hologic Discovery lateral spine image seen in Fig. 13-1 are possible today. When combined with the very low radiation exposure in comparison to conventional X-ray studies, the use of lateral spine DXA imaging for the diagnosis of vertebral fractures and assessment of aortic calcification has become a clinical reality.
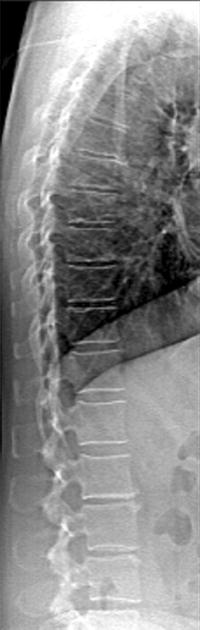
Fig. 13-1.
A VFA image from the Hologic Discovery. The vertebrae are seen with remarkable clarity enabling structural diagnoses to be made at a fraction of the radiation exposure of plain spine films (Case courtesy of Hologic, Inc., Beford, MA).
The Relationship Between Prevalent Spine Fracture and Future Fracture Risk
Knowing whether the patient has a spine fracture is of paramount importance in determining both their diagnosis and future fracture risk. Both obviously effect the decisions to be made by the patient’s treating physician. The clinical dilemma, with which we must deal, is that most spine fractures are not diagnosed because they are relatively asymptomatic. They may be dismissed by the patient as a self-limited episode of back pain or not remembered at all. The loss of height that follows a fracture may not be noticed by the patient. Consequently when asked, the patient denies ever having had a spine fracture. None of this should be construed however, as meaning that these fractures are not important. A number of studies have demonstrated that the presence of a spine fracture is predictive of future fractures, independent of the measured bone density [1–7]. The strongest association is between existing spine fractures and future spine fractures with estimates of the increase in risk from only 1 prevalent spine fracture ranging from 3 to 11.1-fold. One of the first such studies was from Ross et al. [1]. In this study, the presence of one vertebral fracture at baseline resulted in a fivefold increase in the risk for new vertebral fractures. If two vertebral fractures were present at baseline, the risk for new vertebral fractures increased 12-fold. Existing spine fractures have also been shown to be predictive of future non-spine fractures in general and hip fracture specifically [4–6].
Klotzbuecher et al. [7] reviewed the available literature in 2000 to summarize the known associations between prevalent fracture and future fracture risk of all types. They performed a literature search that spanned 1966 through 1999, identifying 15 publications that reported associations between prevalent spine fractures and subsequent fractures. Based on this review, Klotzbuecher et al. concluded that prevalent spine fracture increases the risk for future spine fracture 4.4-fold (95 % confidence interval 3.6–5.4). The risk of subsequent hip fracture was increased 2.3-fold (95 % confidence interval 2.0–2.8), and the risk of subsequent wrist fracture was increased 1.4-fold (95 % confidence interval 1.2–1.7). The authors noted that in 5 of the 15 studies reviewed, the associations between prevalent spine fracture and subsequent fracture were reduced by only 20 % or less when adjustments were made for BMD. Nevertheless, BMD was also a strong predictor of future fractures, independent of prior fractures. Klotzbuecher et al. concluded that BMD and prevalent fractures were complementary in the prediction of future fracture risk. In other words, both BMD and prevalent fractures were predictive of future fractures. Both captured something about future fracture risk that the other did not.
Diagnosing Vertebral Fractures
It is reasonable then to state that the assessment of fracture risk is incomplete without an assessment of the presence of vertebral fracture. Only 33 % of vertebral fractures are symptomatic [8]. Of those fractures that are not clinically symptomatic, 78 % go unrecognized [9]. It has also become sadly apparent that vertebral deformities are not being recognized on plain films or that they are not regarded as clinically important even when they are noted [10–13]. Identification of a vertebral fracture may result in a different diagnosis than would otherwise result based on the bone density alone. This may also result in a different approach to the management of the patient. In addition, the presence of vertebral fracture is unquestionably an independent predictor of fracture risk. A more aggressive effort to evaluate patients for vertebral fracture is clearly indicated.
A change in the size or shape of a vertebral body is characterized generically as a deformity. The “gold standard” for defining the types of vertebral deformities that are the result of bone fragility and therefore considered fractures remains controversial. Both semiquantitative and quantitative approaches for defining vertebral fractures are used clinically. Either can be applied to plain radiographs as well as densitometric spine images. In clinical trials in which vertebral fractures must be identified, both approaches are generally used.
Vertebral Fracture Assessment with Genant Semiquantitative Technique
The semiquantitative (SQ) technique of Genant relies on the expertise of the observer rather than specific measurements of the physical dimensions of the vertebrae [14]. Based on the physical appearance, vertebrae are characterized as being normal or deformed. The types of deformation are mild (grade 1), moderate (grade 2), and severe (grade 3). Deformed vertebrae are also described based on the nature of the deformation as wedged (anterior fracture), biconcave (middle fracture), or crushed (posterior fracture). These deformities are illustrated in Fig. 13-2. Although physical measurements are not made with this technique, a grade 1 deformity roughly corresponds to a 20–25 % reduction in the anterior, middle, or posterior height of the vertebra and a 10–20 % reduction in vertebral area. A grade 2 deformity is the result of a 25–40 % reduction in any of the three heights and a reduction in vertebral area of 20–40 %. A grade 3 deformity occurs when there is a 40 % reduction in any of the three heights and a 40 % reduction in vertebral area. This technique has been traditionally used with plain radiographs of the spine, but semiquantitative vertebral fracture assessments can be performed with fan-array DXA spine images as well. In fact, some DXA software will automatically assign a fracture type and grade to a vertebral deformity, based on the Genant semiquantitative technique.
Fig. 13-2.
The Genant semiquantitative vertebral fracture grading system (Reproduced courtesy of Dr. Harry Genant, San Francisco, CA).
Vertebral Fracture Assessment with Quantitative Techniques
Quantitative techniques rely on physical measurements to diagnose vertebral fracture. Reference points are placed on each vertebral body. A common method is the placement of six points, one point at each corner of the vertebral body and one point at the midpoint of each of the endplates. Using these points, the anterior, mid-, and posterior heights (h a, h m, and h p, respectively) of the vertebra are measured. The vertebral area is calculated as the polygon area defined by the 6 points. In addition to the heights themselves, the anterior–posterior height ratio (h a/h p) and the middle–posterior height ratio (h m/h p) are calculated. Other ratios include the wedge index (I w = h p/h a) [15] and the biconcavity index (h m/h a) [16]. These measurements were originally made on plain radiographs. In recent years, measurements were made using digitized films. This is called morphometric radiography (MXR). With the advent of fan-array DXA spine imaging and morphometry software, quantitative vertebral morphometry can be performed using DXA as well, an approach which is called morphometric X-ray absorptiometry (MXA).
For either MXR or MXA, criteria must be established for the magnitude of reduction in any of the measurements that would indicate a fracture. The differing proposals for such criteria make the use of MXR or MXA much more complex than the use of the Genant semiquantitative technique. Several authorities have proposed that a prevalent fracture should be diagnosed if there is a 15 % or greater reduction in the h a/h p or h m/h p ratio or the ratio of the posterior height of one vertebra to the posterior height of an adjacent vertebra (h p/h pa) when compared to the mean value for a normal population [17–19]. A more stringent 20 % reduction in these ratios has also been proposed. A reduction of 3 SD in the h a/h p or h m/h p compared to normative data to define vertebral fracture was proposed by Ross et al. and Eastell et al. [20, 21]. McCloskey and Kanis [22, 23] also proposed utilizing a 3 SD reduction in any of the ratios combined with reductions in ratios calculated using a predicted posterior vertebral height. These morphometric definitions of vertebral fracture require comparisons to reference data for a population. Heights may also be adjusted for body size using the dimensions of the fourth thoracic vertebra (T4). In other words, the h p for T12 can be adjusted or normalized for size by dividing it by the h p at T4 in the individual. The resulting posterior dimension for T12 is then abbreviated nh p, reflecting the normalization for size. Minne et al. [24] proposed defining vertebral fracture as being present when any of the three normalized heights was below the third percentile of the normal range. Because vertebrae are expected to have slightly different shapes depending on the vertebral level, individual heights must be compared to normal values that are specific for that vertebral level.
The definition of incident fractures tends to be more straightforward. A decrease of 15 % in the h a, h m, or h p from the baseline study is indicative of an incident fracture. Other authorities have proposed a reduction of 20–25 % alone for the definition of an incident fracture [25] or this amount of reduction in any of the three heights in combination with a minimum absolute reduction of 4 mm [26].
Performance Comparisons of Semiquantitative and Quantitative Techniques
Quantitative techniques rely heavily on the accuracy of point placements as well as comparisons to reference databases. Point placement can be subjective and affected by the deformity itself or patient positioning. Differences of opinion exist regarding the validity and design of reference databases for vertebral morphometry, just as they do for bone densitometry. Genant’s semiquantitative technique is based on the visual recognition of quantitative changes in vertebral shape. The performance of quantitative and semiquantitative techniques in identifying vertebral fractures has been compared in several studies [27–32]. In order to compare the techniques, a “gold standard” for the diagnosis of vertebral fracture was generally created by a consensus reading of radiographs by experts. When done in this manner, the semiquantitative and quantitative approaches generally performed equally well, but the criteria used to define fracture for the quantitative morphometry assessment profoundly effected the agreement between the two techniques. The combination of a semiquantitative and quantitative technique may be better than either alone. Spine imaging with fan-array densitometry combined with modern computer technology makes it possible for the densitometrist to utilize either or both approaches. Lateral spine images, such as the VFA image from a GE Lunar Prodigy shown in Fig. 13-3, can be evaluated using Genant semiquantitative method. Morphometric software can also be used to define and measure vertebral heights, as shown in Fig. 13-4.
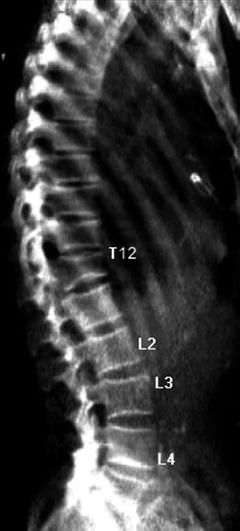
Fig. 13-3.
A VFA image from a Lunar Prodigy showing a grade 2 fracture at T12 (Case courtesy of GE Healthcare, Madison, WI).
Fig. 13-4.
Computerized morphometric analysis of vertebral heights for T12, as seen in Fig. 13-3 (Case courtesy of GE Healthcare, Madison, WI).
Spine Imaging with DXA for Diagnosis of Vertebral Fracture
Using fan-array DXA spine imaging, the spine can be imaged from T4 to L5 in the lateral or PA projection. DXA spine imaging can be performed in seconds to minutes, depending on the scan mode, but always at a fraction of the radiation exposure of conventional spine radiographs. Fan-array DXA imaging also largely avoids the problem created by parallax1 in plain radiography of the spine. Because the movement of the scan arm allows the DXA beam to pass parallel to the vertebral endplates throughout the entire length of the spine, the vertebral dimensions are not distorted by the angle of the beam. If the patient has severe scoliosis, some parallax effect may be unavoidable.
Rea et al. [33] evaluated 161 postmenopausal women for fractures using conventional lateral spine radiographs and fan-array lateral spine imaging. Plain films were evaluated using the Genant semiquantitative method, while a more general visual assessment of the VFA images was done in which the vertebrae were considered normal, equivocal, or deformed. The two approaches were then compared. The simple visual assessment of the VFA image resulted in the correct identification of 91.9 % of the grade 2 and grade 3 spine fractures seen on plain films using the SQ technique. When the grade 1 (mild) fractures were included in the total, 77.4 % were correctly identified on the VFA image. 98.4 % of the unfractured vertebrae were also correctly identified on the VFA images. This suggests that DXA VFA spine imaging was an excellent means of excluding the diagnosis of vertebral fracture. If a fracture was not seen using this technique, it was highly unlikely that a fracture was present at all and extremely unlikely that a grade 2 or grade 3 fracture was present. The agreement in fracture diagnoses between the visual assessment of DXA spine images and the semiquantitative assessment of standard spine radiographs for vertebrae that could be evaluated with both techniques was 96.3 %.
Although DXA spine imaging spans T4 to L5, it is not uncommon for the uppermost thoracic vertebrae to be poorly visualized. In the study noted above from Rea et al. [33], 94.9 % of the vertebrae could be evaluated. T4 and T5 were the most common vertebrae that were too poorly visualized to be evaluated. In a study from Schousboe et al. [34] in which 342 women underwent DXA lateral spine imaging, 92.1 % or 4,096 of the 4,446 vertebrae studied could be evaluated. In this study, T4 to T6 were less likely to be adequately visualized.
The inability to consistently evaluate T4 to T6 on lateral DXA spine images does not present a significant problem in osteoporotic fracture identification. Several studies have demonstrated that the majority of fractures occur below these levels. The most common locations for vertebral fractures would appear to be T11 to L1, followed by T7 and T8 [2, 31, 34, 35].
Simply because a patient does not have an osteoporotic bone density is not a reason to assume that they do not have a spine fracture. In studies that have utilized DXA spine imaging for spine fracture diagnosis, a surprising percentage of women with non-osteoporotic bone densities have been found to have fractures. In the study from Schousboe et al. [34], 27.4 % of the patients aged 60 and older with osteopenic bone densities according to World Health Organization criteria were found to have vertebral deformities consistent with a diagnosis of fracture on DXA spine images. Forty-two percent of the patients aged 60 and older with osteoporotic bone densities were found to have vertebral deformities as well. In this study, the diagnosis of fracture on the DXA image was based primarily on the Genant semiquantitative method. Faulkner et al. [36] evaluated 231 women with a mean age of 65 with DXA spine imaging utilizing proprietary morphometric software in which a diagnosis of spine fracture was based on a reduction in vertebral height or height ratio of 3 SD or more from the expected mean value. Using this definition of prevalent fracture, more than half of the women were found to have vertebral fractures. Based on bone density at the PA lumbar spine or proximal femur, 46.7 % of the women had osteopenia and 26.4 % had osteoporosis. Of the women with osteopenia, 49.1 % were found to have spine fractures. Over 72 % of the women with osteoporosis were also found to have spine fractures based on these MXA measurements.
MXA, like densitometry, is a quantitative measurement technique. Like densitometry then, the utility of MXA can be characterized in part by its reproducibility or precision.2 After studying 48 normal postmenopausal women and 50 osteoporotic postmenopausal women, Ferrar et al. [37] concluded that the long-term precision of MXA was comparable to that of MXR. In this study, the RMS-SD was 0.60 mm in the normal women and 0.77 mm in the osteoporotic women. The RMS-SD for height ratios in the normal women was 0.03. These values were obtained using the “compare” feature. Use of the compare feature resulted in better precision than when the compare feature was not used. Rea et al. [38] also evaluated the long-term precision of MXA. They noted, as had Ferrer et al. [37], that the precision errors for MXA were substantially smaller than the 20–25 % reduction in vertebral height often used as a criteria for the diagnosis of incident vertebral fracture. The diagnosis of incident fracture from these images based on quantitative spine morphometry is therefore not adversely affected by the precision of the measurement technique.
The potential contribution of VFA to the diagnosis of osteoporosis, prediction of fracture risk, and thus the decision to intervene with prescription medications must not be minimized. Even though a patient may have an osteopenic bone density, using WHO criteria,3 the presence of a fracture implies that they have met the conceptual definitions of osteoporosis proposed by consensus conferences over the last decade. Such a patient would meet the current National Osteoporosis Foundation guidelines [39] for treatment. If a patient has an osteoporotic bone density by WHO criteria but also has a fracture, their diagnosis would change to the WHO category of severe osteoporosis. In both cases, the presence of a fracture clearly increases the risk of future fractures, over and above that implied by the bone density alone. These additional considerations must become part of the decision-making process for treatment. Consequently, in the absence of having current plain films of the spine with their attendant greater cost and radiation exposure to the patient, VFA with DXA should be considered an indispensable part of the evaluation of the patient’s skeletal status.
VFA Patient Selection and Reporting
In 2007, the International Society for Clinical Densitometry (ISCD) published extensive guidelines on patient selection for VFA [40] which are shown in Table 13-1 and also in Appendix C. These guidelines assume that current plain films of the spine are not available. ISCD recommended the use of the Genant semiquantitative approach for the diagnosis of vertebral fracture with VFA. In reporting the VFA results, ISCD recommended that any such report document the methodology used to determine the fracture (e.g., SQ or MXA4), unevaluable vertebrae, vertebral deformities, and unexplained vertebral and extra-vertebral pathology.
Table 13-1
2007 ISCD guidelines for VFA
Consider VFA when the results may influence clinical management |
Postmenopausal women with low bone mass (osteopenia) by BMD criteria, plus any one of the following: |
Age greater than or equal to 70 years |
Historical height loss greater than 4 cm (1.6 in.) |
Prospective height loss greater than 2 cm (0.8 in.) |
Self-reported vertebral fracture (not previously documented) |
Two or more of the following: |
Age 60 to 69 years |
Self-reported prior non-vertebral fracture |
Historical height loss of 2 to 4 cm |
Chronic systemic diseases associated with increased risk of vertebral fractures (e.g., moderate to severe COPD or COAD, seropositive rheumatoid arthritis, Crohn’s disease) |
Men with low bone mass (osteopenia) by BMD criteria, plus any one of the following: |
Age 80 years or older |
Historical height loss greater than 6 cm (2.4 in.) |
Prospective height loss greater than 3 cm (1.2 in.) |
Self-reported vertebral fracture (not previously documented) |
Two or more of the following: |
Age 70–79 years |
Self-reported prior non-vertebral fracture |
Historical height loss of 3–6 cm |
On pharmacologic androgen deprivation therapy or following orchiectomy |
Chronic systemic diseases associated with increased risk of vertebral fractures (e.g., moderate to severe COPD or COAD, seropositive rheumatoid arthritis, Crohn’s disease) |
Women or men on chronic glucocorticoid therapy (equivalent to 5 mg or more of prednisone daily for three (3) months or longer) |
Postmenopausal women or men with osteoporosis by BMD criteria, if documentation of one or more vertebral fractures will alter clinical management |
Aortic Calcification Assessment
During the performance of VFA, calcification in the abdominal aorta may be seen. This presents an opportunity to provide the referring physician and/or patient with information that is relevant to cardiovascular risk, even though the VFA study was not performed for this purpose. There are clinical observations that suggest a link between low bone density and cardiovascular risk [41–45], low bone density and aortic calcification [46–49], and aortic calcification and cardiovascular risk [50]. Clearly, aortic calcification and cardiovascular risk should be kept in mind during the performance of a VFA study, even though the study is being done as part of the assessment of fracture risk.
The prevalence of aortic calcification clearly increases with advancing age. In Schulz et al. [49], the prevalence of any aortic calcification was 32.4 % in women 50–54, 57.3 % in women 55–59, 67.4 % in women 60–64, and 74.2 % in women 65–69. In women aged 70 and older, the prevalence was over 90 %. In the Framingham Heart Study, the prevalence of aortic calcification in women and men with a mean age of 61 was 57 % and 68 %, respectively [51–53].
In densitometry, concern regarding the prevalence of abdominal aortic calcification has largely centered around its potential effect on the measurement of BMD in the PA lumbar spine.5 It is one reason for relying more heavily on proximal femur studies for the diagnosis of osteoporosis based on the BMD in older women. On a lateral VFA image however, the presence of aortic calcification does not affect the identification of vertebral fracture. One use then, of identifying aortic calcification on a VFA image, is to document the presence or lack of aortic calcification because of its potential effect on the BMD measured at the PA lumbar spine. But the presence of aortic calcification has far-reaching implications for cardiovascular event risk as well.
It seems clear that the risk for myocardial infarction increases with increasing severity of aortic calcification [50]. Aortic calcification was also found to be an independent predictor of stroke [52]. The risk for heart failure and coronary heart disease also increased with increasing severity of aortic calcification in the Framingham Heart Study6 [51, 53].
Aortic Calcification Scoring Systems
In the Framingham Heart Study, a 24-point grading system was used to determine the extent of abdominal aortic calcification which was initially described by Kaupila et al. [54]. The 24-point scale has since become the accepted standard for grading aortic calcification on plain films. Both the anterior and posterior walls of the aorta at each of four lumbar vertebral levels (L1–L4) are assigned a grade based on the length of the calcification seen in the wall. The scoring system is shown in Table 13-2. Because both the anterior and posterior aortic walls at each vertebral level could potentially receive a maximum combined score of six and four vertebral levels are evaluated, the worst possible score is 24. In studies which assessed the risk of coronary heart disease and the congestive heart failure by tertile7 of aortic calcification [51–53], the third tertile corresponded to an AAC-24 score of ≥5. It was in this tertile that the greatest risks were seen.
Aortic calcification length in the anterior or posterior aortic wall at L1, L2, L3, or L4 | Score |
|---|---|
None | 0 |
≤1/3 of aortic wall | 1 |
>1/3 but ≤2/3 of aortic wall | 2 |
>2/3 of aortic wall | 3 |
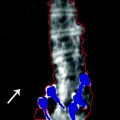
In 2006 Schousboe et al. [55] proposed a simplified abdominal aortic calcification scoring system, called the AAC-8. In this approach, the total length of aortic calcification which spans L1–L4 is estimated for the anterior and posterior aortic walls separately. A possible score for each wall can range from 0 to 4, such that a maximum worst-case score is 8. The AAC-8 scoring system is shown in Table 13-3. The application of the AAC-8 to a lateral DXA image is shown in Fig. 13-5


Related posts:
Stay updated, free articles. Join our Telegram channel
Full access? Get Clinical Tree
