FIGURE 5-1 Electrocardiography showed sinus rhythm, low voltage, and left-axis deviation.
Based on his presenting symptoms he underwent a TTE, with the notation of poor image quality but grossly normal LV systolic function and mild RV dysfunction. The mitral valve inflow and tissue Doppler velocities were consistent—a pseudonormalization pattern, indicating grade 2 diastolic dysfunction. Due to the poor image quality of the TTE and the abnormal finding of right heart dysfunction as well as diastolic dysfunction, CMR was ordered.
Assessment of cardiac function is a key element in the standard CMR protocol for cardiomyopathies. Left and right ventricular function is assessed using ECG-gated SSFP cine imaging. Figures 5-2, 5-3 and Video 5-1 show horizontal and vertical long-axis SSFP cines for functional assessment. There is evidence of concentric myocardial hypertrophy and biatrial enlargement.
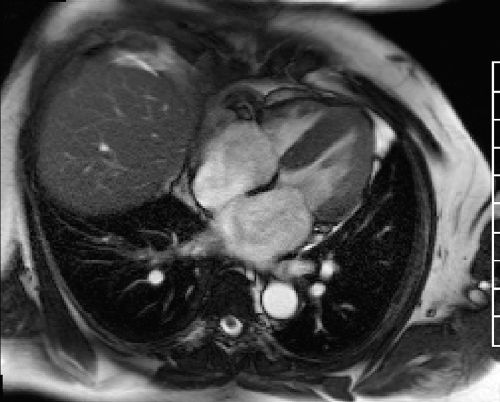
FIGURE 5-2 End-systolic horizontal long-axis cine frame shows preserved thickening of all LV myocardial segments.
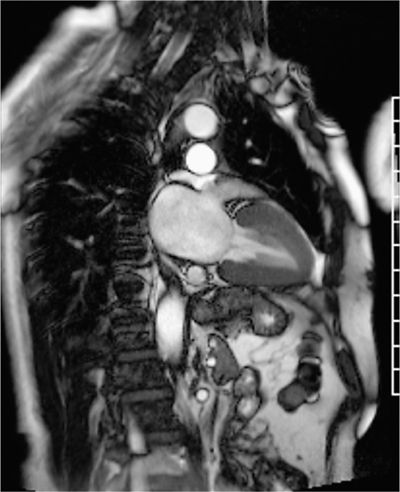
FIGURE 5-3 End-systolic vertical long-axis cine frame shows preserved thickening of LV myocardial segments.
Late gadolinium enhancement (LGE) imaging is employed for identification of fibrosis/scar. Patterns of hyperenhancement can be used to distinguish ischemic from nonischemic myocardial disease.1,2 A standard LGE protocol involves intravenous administration of 0.1 to 0.2 mmol/kg Gd3+-based contrast agent. After 10 minutes, LGE imaging is performed using an ECG-gated, T1-weighted technique such as a segmented inversion recovery-prepared fast gradient-echo sequence. These are typically breath-held, and identification of the correct timing of the inversion recovery pulse is important to optimize the contrast difference between normal and abnormal myocardium.3
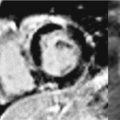
Post-gadolinium imaging in short-axis planes is shown in Figures 5-4 and 5-5 and in Video 5-2. There is a remarkable pattern of diffuse fibrosis present with both subendocardial as well as epicardial hyperenhancement. Differential diagnosis of such diffuse hyperenhancement included hypertensive heart disease or diffuse infiltrative disease. Amyloidosis was of particular concern given relatively low voltage on the ECG for the degree of myocardial thickening. Uremic cardiomyopathy would potentially produce similar findings; however, the patient’s renal dysfunction was considered mild.
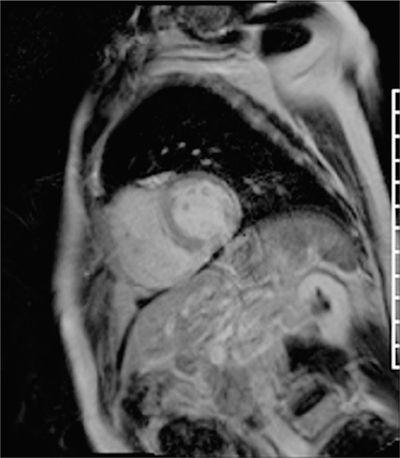
FIGURE 5-4 Late post-gadolinium enhancement imaging in a short-axis plane shows diffuse hyperenhancement of the septal, inferior, and lateral myocardium.
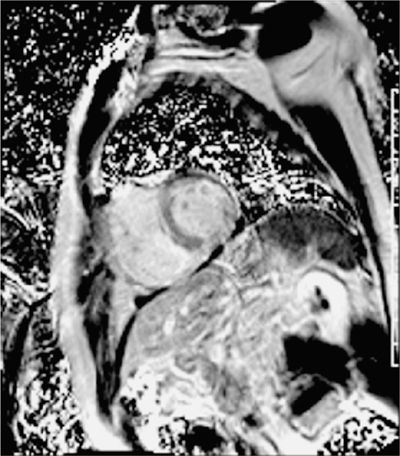
FIGURE 5-5 Late post-gadolinium enhancement imaging using a phase-sensitive inversion recovery reconstruction is shown in the same short-axis plane as the previous figure with diffuse myocardial hyper-enhancement.
Discussion
This patient went on to have an endomyocardial biopsy with a Congo red stain that was negative, but immunofluorescence yielded evidence of kappa and lambda light chain deposition. Thus, the most likely diagnosis was AL amyloidosis. With this patient, amyloid was suggested by the CMR exam, a biopsy was required to confirm the diagnosis.
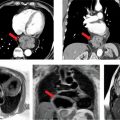
More classic CMR findings of amyloid are shown in Figures 5-6 and 5-7, also underscoring the utility of earlier LGE acquisition (eg, 2- to 5-minute postcontrast) when this disease is suspected. Amyloid pattern seen is evident with a TI scout obtained 2 minutes after intravenous administration of Gd3+-based contrast agent (Figure 5-6). Figure 5-7 shows the typical subendocardial ‘stripe’ pattern of amyloidosis as well as the dark blood pool due to circulating amyloid protein. This patient also underwent endomyocardial biopsy that was confirmatory of myocardial amyloid. Figure 5-8 shows the Congo red staining of the biopsy specimen and Figure 5-9 demonstrates the apple green birefringence of the amyloid protein deposits.
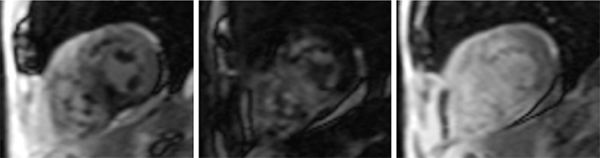
FIGURE 5-6 serial images obtained with an inversion time (ti) scout sequence obtained 2 minutes after intravenous injection of gadolinium-based contrast show a typical pattern of blood pool and myocardial signal changes due to amyloidosis over longer tis.
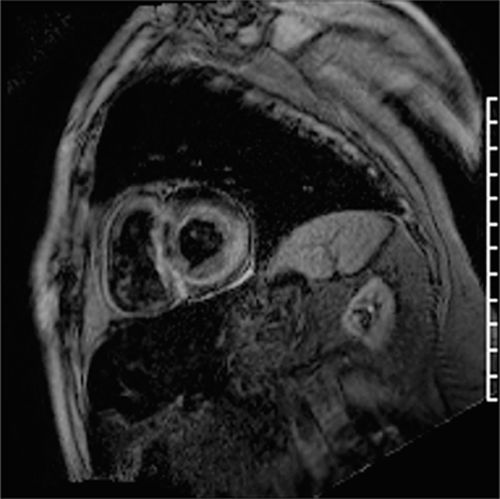
FIGURE 5-7 Late post-gadolinium enhancement image acquired with an inversion time of 280 milliseconds at 2 minutes after IV contrast is shown in a short-axis plane with very dark signal in the blood pool and diffuse sub-endocardial enhancement due to amyloid deposition.
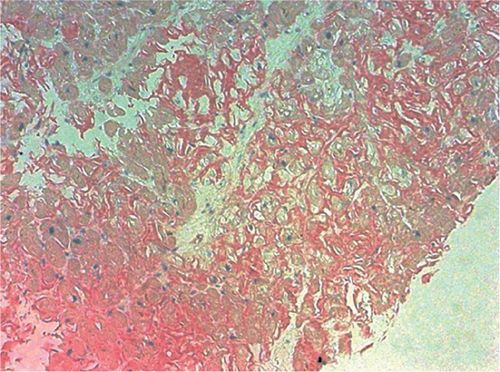
FIGURE 5-8 Congo red staining of an endomyocardial biopsy specimen is positive for amyloidosis.
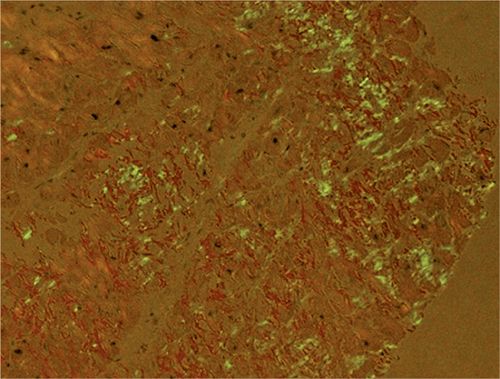
FIGURE 5-9 Polarized light microscopy of the Congo red stain shows the apple green birefringence, which is diagnostic of amyloidosis.
Typical morphologic characteristics of myocardial amyloidosis include concentric hypertrophy with biatrial enlargement. Diastolic dysfunction is present with restrictive filling demonstrated by either echo Doppler assessment or CMR flow quantification.4
Amyloid protein deposition increases the myocardial interstitial space. The distinct kinetics of gadolinium in the myocardium in the presence of amyloid infiltrative disease can help distinguish it from hypertensive heart disease.5,6 The LGE pattern in amyloidosis may be patchy, transmural, or subendocardial. With the TI scout the blood pool appears dark due to contrast uptake and a quick “washout effect”. This “washout effect” can be lessened by early imaging post-gadolinium (2 minutes postcontrast administration). LGE findings consistent with cardiac amyloid correlate well with biopsy-proven amyloid.7 In addition, parameters associated with gadolinium kinetics have been associated with mortality.8,9 Pre- and postcontrast T1 mapping techniques are now available to directly quantify the extracellular volume fraction that may be markedly elevated in amyloidosis (Figure 5-10).10,11
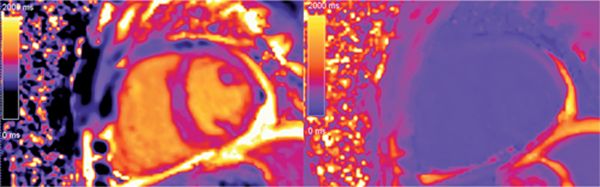
FIGURE 5-10 T1 mapping techniques now allow computation of the extracellular volume fraction from pre- and postcontrast T1 maps plus knowledge of the hematocrit level. In this case the following T1 values were used: precontrast blood 1609 milliseconds, precontrast myocardium 1079 milliseconds, postcontrast blood 198 milliseconds, post-contrast myocardium 168 milliseconds. With a hematocrit of 34.8%, this yields a markedly elevated extracellular volume fraction of 73%.
CASE 2 Myocarditis
The patient is a 41-year-old man with no prior medical history presenting with a 3-day history of malaise, fever, chest pain, and dyspnea. After over-the-counter cough and cold medications provided no significant symptoms relief, he sought medical attention in the emergency department.
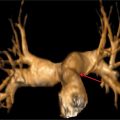
At the time of presentation, he had anterolateral ST elevation by ECG (Figure 5-11) as well as a markedly elevated serum troponin-I level of 31 ng/mL indicating significant myocardial injury. His white blood cell count was also elevated at 15,000/mL. The patient underwent emergent cardiac catheterization due to the ECG changes and troponin elevation that showed no evidence of obstructive CAD. Ventriculography performed at the time of the catheterization (Figure 5-12, Video 5-3) showed global LV systolic dysfunction with an ejection fraction of 25%. The patient subsequently disclosed an extensive alcohol history, consuming over 6 drinks per night for several years. Therefore, while the clinical presentation favored a diagnosis of myocarditis, the extensive alcohol history could also have contributed to LV dysfunction. Therefore, CMR examination was ordered to evaluate for evidence of myocardial inflammation.
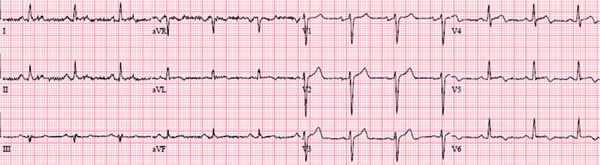
FIGURE 5-11 Electrocardiography at the time of presentation to the emergency department in a 41-year-old man with a variety of symptoms demonstrated diffuse ST segment elevation.
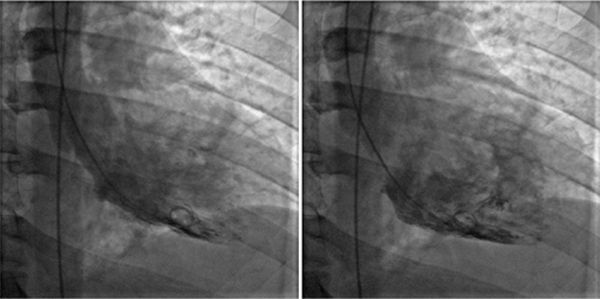
FIGURE 5-12 End-systolic (left) and end-diastolic (right) frames of the ventriculogram performed after invasive angiography showed normal coronary arteries indicates significant LV systolic dysfunction.
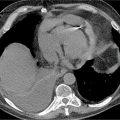
Reduction of both left and right ventricular systolic function was evident on cine imaging (Video 5-4). T2-weighted STIR imaging demonstrated evidence of increased myocardial T2 (Figure 5-13). T1-weighted late post-gadolinium imaging (Figures 5-14 and 5-15) revealed extensive hyperenhancement involving the epicardium as well as septal mid-wall and RV hyperenhancement.
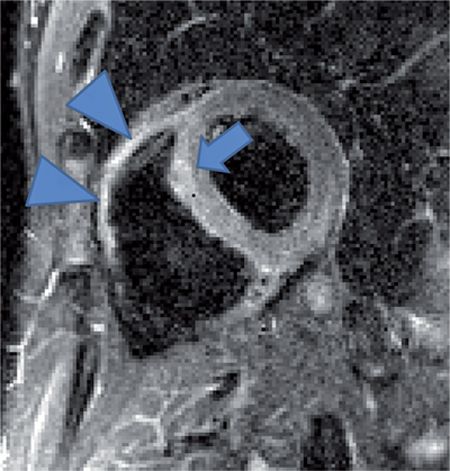
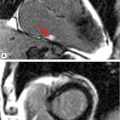
FIGURE 5-13 T2-weighted-short tau inversion recovery (STIR) image in a short-axis plane demonstrates evidence of increased myocardial signal intensity (arrow). There is likely increased signal in the right ventricle as well beyond what might be explained by surface coil inhomogeneity (arrowheads).
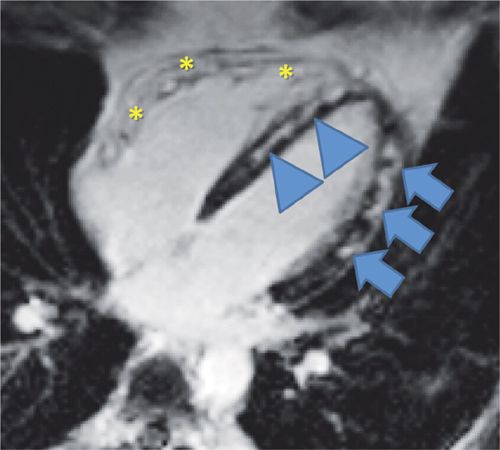
FIGURE 5-14 T1-weighted late post-gadolinium imaging demonstrates extensive hyperenhancement involving the lateral epicardium (arrows) and septum (arrowheads) as well as RV hyperenhancement (asterisks) consistent with myocarditis and biventricular involvement.
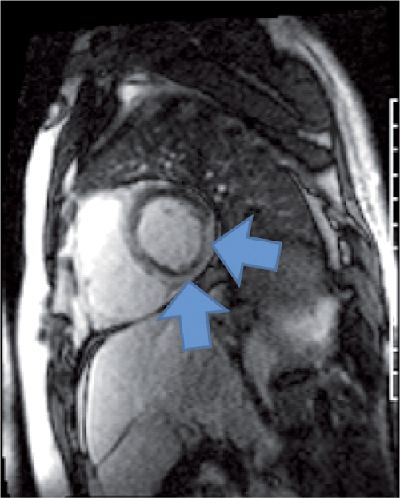
FIGURE 5-15 Late gadolinium enhancement CMR in a short-axis plane showed extensive epicardial hyperenhancement (arrows), a pattern typically seen in myocarditis.
T2-weighted STIR imaging is limited by the SNR with issues in artifacts, breath-holding and arrhythmia. Newer techniques to allow for T2 quantification are allowing for better detection of myocardial edema and inflammation in myocarditis.12,13
Discussion
In clinical situations where the diagnosis of myocarditis is suspected, especially in the setting of LV dysfunction of unknown or multiple possible etiologies, CMR is useful with a high specificity of epicardial hyperenhancement by LGE for the diagnosis of myocarditis. Patterns on LGE that support the diagnosis of myocarditis include subepicardial lateral and mid-wall septal hyperenhancement. While the lateral wall is classically affected, enhancement in myocarditis can be anywhere in the myocardium or involve the RV as well.14,15 The presence of a typical pattern weighs strongly towards a diagnosis of myocarditis, but its absence does not exclude it; in such instances, T2 mapping has been shown to better demonstrate the presence and extent of myocarditis.13 In addition, CMR abnormalities have been used to help guide endomyocardial biopsy to give this technique a higher clinical yield.16 Concomitant pericardial involvement is readily demonstrated with CMR, particularly dark blood sequences for pericardial thickening and LGE for pericardial inflammation.
Another distinct pattern of enhancement in myocarditis is shown in Figure 5-16. This patient presented with wide complex tachycardia and preserved LV systolic function. Late gadolinium enhancement showed a distinct region of septal enhancement with elevated myocardial T2 suggesting inflammatory myocardial disease. He underwent an endomyocardial biopsy that diagnosed giant cell myocarditis (GCM).
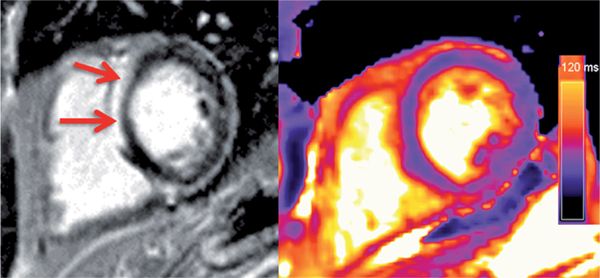
FIGURE 5-16 Late post-gadolinium imaging in a short-axis plane shows striking hyper-enhancement (left panel, arrows) in a patient who presented with ventricular tachycardia. Myocardial T2 values were elevated (right panel), suggesting inflammation in this patient. Abnormal CMR prompted endomyocardial biopsy that showed giant cell myocarditis.
Related posts:
Stay updated, free articles. Join our Telegram channel

Full access? Get Clinical Tree


