Rine Nakanishi, MD, PhD
Troy Labounty, MD
INTRODUCTION
Rapid improvements in cardiac computed tomography (CT) technologies have resulted in the ability to acquire high-quality images of the moving heart and coronary arteries, permitting new diagnostic paradigms to evaluate patients with suspected coronary artery disease (CAD). Electron-beam CT (EBCT) became available in 1987; this technique utilizes an electron beam that sweeps across fixed targets around the patient without motion of the source, providing rapid image acquisitions that result in high temporal resolution.1,2 EBCT provides reproducible and accurate measurement of coronary artery calcification.3 The accuracy for the diagnosis of anatomically obstructive CAD using contrast-enhanced (CE) coronary angiography has been less robust, given its limited spatial resolution to approximately 3 mm.4 Multidetector CT (MDCT), which utilizes multiple detector rows to simultaneously acquire images while rotating with the source around the patient, emerged as an alternative to EBCT, offering the advantage of improved spatial resolution while slightly compromising temporal resolution. With the advancement of MDCT to 64-detector row CT in the year 2005, noninvasive coronary CT angiography became clinically feasible during a single breath-hold of approximately 5 to 8 seconds. MDCT has largely replaced the use of EBCT due to its widespread availability, high spatial resolution, and ability to reliably perform high-quality coronary angiography in addition to noncontrast coronary imaging.5 MDCT with at least 64-detector rows has been demonstrated to have high diagnostic performance to identify and exclude obstructive CAD.6–8 It is now considered an appropriate test in selected patients with suspected CAD.9 This text will focus on the application of MDCT given the limited clinical role of EBCT for coronary angiography at the present time.
BASICS OF CARDIAC CT
On typical CT scanners the source and detectors are housed in the gantry and rotate around the patient. The X-ray photons are created when electrons are accelerated at an X-ray target. When these photons hit the target, X-ray photons are created and ejected from the X-ray tube.10 These photons represent a spectrum of photon potential energies, and the highest photon energy is called the peak tube voltage, which is called the kilovolt peak (kVp).11 For example, the X-ray photons produced by a scanner with a set tube voltage of 120 kVp will include a spectrum of photon energies, with a peak photon energy of 120 kV. Tube current represents the number of photons emitted by the X-ray tube. Both tube voltage and tube current will impact radiation dose and image characteristics as discussed below.
After X-ray photons are produced by the X-ray tube and pass through the collimator, they transverse the patient, and some photons are attenuated. The attenuation of these photons depends on their potential energy and the specific materials they encounter.10 For example, bone will result in much higher attenuation than fat, resulting in differences in the number of photons and energy of photons that reach the detectors on the opposite side of the source.11 These detectors measure photons that pass through the patient as the source and the detector rotates around the patient. By computing the detector measurements as it rotates around the patient in 3D space, images of attenuation can be reconstructed for viewing.12
CT images may be acquired in a helical or axial mode (Figure 2-1). In a helical technique, there is continuous motion of the patient table as the gantry (the X-ray source and detectors) rotates around the patient. The result is a helical dataset and for cardiac imaging there is a significant overlap of these images to permit reconstruction of multiple phases of the cardiac cycle, permitting reconstruction of images at multiple time points in systole and diastole. For axial imaging, the patient and table are stationary as images are acquired; the patient table is then moved in increments to new positions where it again stops for each additional image acquisition. This technique results in datasets in an axial plane, rather than helical datasets and can be used to reduce radiation dose.13,14
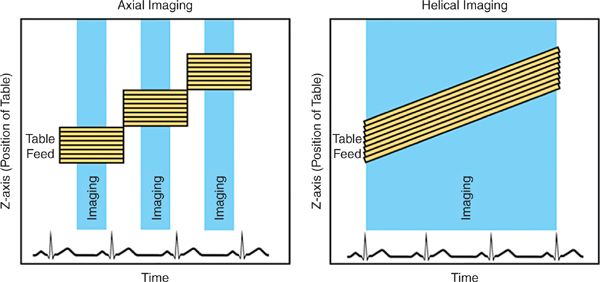
FIGURE 2-1 Imaging modes. During basic axial imaging (left), the table alternates between moving to a new position and stopping for image acquisition. Images from multiple detector rows are acquired simultaneously when the table is stationary. During basic helical imaging (right), there is continuous motion of the patient on the table, and images from multiple detector rows are acquired continuously. Images are retrospectively reconstructed for specific time points in the cardiac cycle.
MDCT consists of several rows of detectors, and a larger number of rows results in a larger z-axis coverage (the cephalo-caudal direction). Early MDCT scanners had a small number of detector rows (eg, 4); as a larger number of detectors became available, this permitted greater coverage and a shorter scan time (Figure 2-2). In comparison to 16-detector CT, 64-detector CT resulted in a large decrease in acquisition time—from greater than 20 seconds to 5-8 seconds.15 As a patient breath-hold is required for CT acquisitions, this greatly improved the clinical feasibility. Further, 64-detector CT was demonstrated to have significant reductions in the number of noninterpretable scans, and had significant improvement in the diagnostic accuracy of cardiac computed tomography angiography (CCTA) to identify obstructive CAD as compared to invasive coronary angiography.15 MDCT with at least 64-detector rows is recommended for CCTA performance16 and has been established as having high diagnostic performance to identify obstructive CAD in comparison to invasive coronary angiography in multiple multicenter studies.6–8
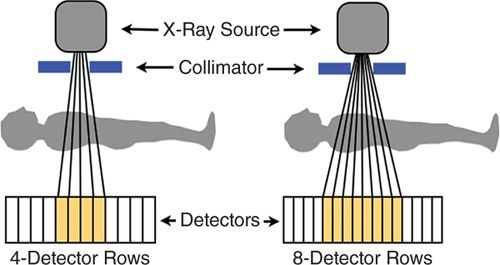
FIGURE 2-2 X-ray photons (vertical lines) are generated by the X-ray source and then emitted through the collimator. These photons pass through the patient and are counted by rows of photon detectors (orange boxes). This diagram demonstrates the increased coverage available with a larger number of detectors as scanners move from 4-to 8-detector rows; current scanners have at least 64-detector rows. The size of the detectors has also decreased over time to result in improved spatial resolution. The X-ray source and detectors rotate around the patient to provide 3D CT images.
Recent technical improvements have further improved the ability of MDCT to image coronary arteries. Scanners with a higher number of detector rows (eg, 128, 256, 320) have become available and may permit whole-heart coverage, further shortening the time of scan acquisition and reducing some artifacts.17–19 Dual-source MDCT combines paired arrays of sources and detectors, at an offset of approximately 90 degrees; this technique improves the temporal resolution by a factor of 2, as one-quarter rotation of the gantry provides sufficient data to reconstruct images as compared to the half rotation that is required by single-source scanners. The improvement in temporal resolution has been demonstrated to reduce motion artifact and may reduce the need for heart rate control in patients undergoing CCTA.20 Finally, new scanners provide increased spatial resolution, which may be particularly helpful in evaluating small structures such as the coronary arteries.21 Currently, the smallest available in-plane spatial resolution is 0.23 mm × 0.23 mm × 0.625 mm.22
CLINICAL INDICATIONS FOR CARDIAC CT
Clinical appropriate use criteria have been developed for cardiac CT. While these criteria are expected to evolve over time, the criteria report of 2010 outlines the appropriateness of cardiac CT for 93 clinical scenarios. Each scenario is graded as inappropriate, uncertain, or appropriate. In general, CCTA is graded as appropriate for risk assessment and diagnosis of CAD in individuals with a low or intermediate pretest probability of disease, while a noncontrast CT to measure coronary artery calcium score (CACS) is considered appropriate in intermediate-risk and some low-risk individuals. Further, cardiac CT is graded appropriate for evaluation of cardiac structures and function in selected patients.9
Appropriate patient selection is critical for cardiac CT studies. Generally, optimal patients for cardiac CT include individuals with a regular and slow heart rate after premedication, who can cooperate and hold their breath during the acquisition, can lie supine and hold their arms above their head, have a body mass index (BMI) less than 40 kg/m2, have normal renal function, and can tolerate nitroglycerin and rate-control medications.9,23
While cardiac CT studies in patients who do not meet all of these criteria may result in adequate images, there is a risk of reduced image quality; such individuals should be evaluated on a case-by-case basis prior to the study to consider the potential likelihood that the study will provide adequate data to address the specific clinical indication.
PERFORMANCE OF CARDIAC CT
PATIENT PREPARATION
Patients should be adequately screened for any contraindications that may interfere with adequate CCTA image quality, as listed in the prior section. Further, these individuals should be assessed for a history of severe or anaphylactic iodine contrast reaction, hemodynamic instability, use of phosphodiesterase inhibitors such as sildenafil within the prior 24 hours, or known intolerance or contraindication to nitroglycerin or rate-control medications such as beta-blockers. Evaluation of renal function should be calculated using the glomerular filtration rate (GFR) rather than creatinine alone, to better identify patients at risk for contrast-induced nephropathy (CIN).16
Before scanning begins, there are many steps that need to take place to ensure acquisition of high-quality images and optimal patient safety. When the procedure is scheduled, patients are given a list of set instructions which includes hydration without solid food for approximately 3 to 4 hours prior to scan, avoiding caffeine products for 12 hours before examination, and avoiding metformin for at least 48 hours after the study. Patients should also be advised not to perform any cardiovascular activity prior to the examination and take all regular medications as scheduled, especially antihypertensive medications.16
Intravascular access in the antecubital vein with an 18-gauge intravenous catheter is optimal for the high flow rate needed for intravenous contrast, while a 20-gauge intravenous line may be adequate in smaller individuals in which a lower flow rate can be utilized.16 Central lines should not be used unless labeled for power injections, and hand veins should be avoided when possible due to their smaller size that may limit the flow rate of contrast.
It is advised to initially clean the skin with alcohol and possibly shaving the site of electrode placement to ensure adequate contact and obtain an accurate ECG tracing. It is also important to consider placing ECG leads outside the scan range to avoid streak artifact. For a reliable ECG triggering and accurate gating, it is important to obtain high QRS amplitude with minimal baseline noise.
HEART RATE CONTROL
The success of CCTA is highly dependent on achieving a regular and slow heart rate (HR). Image quality is generally higher at lower HRs, and current guidelines suggest that a HR less than 60 beats per minute is generally recommended, although the requirement may vary by specific scanner characteristics such as temporal resolution.16 Images used for CCTA interpretation are typically from quiescent phases of the cardiac cycle (eg, the diastasis phase of diastole), with optimal imaging typically during mid-diastole, when the coronary arteries have the least amount of motion. The slower the HR, the longer the quiescent period and the less likely there will be cardiac motion during imaging. Therefore, a slower HR may result in less blurring and motion artifact and improved image quality.
Beta-blockers such as metoprolol are typically used for rate control due to their good safety profile and low cost.24 Several protocols may be used, and they may employ oral, intravenous (IV), or both routes of drug administration. In patients with an elevated HR, a common oral regimen is to give metoprolol 100 mg by mouth 1 hour before the scan, or to give 50 mg 12 hours before the scan and another 50 mg 1 hour before imaging. If the HR remains high, metoprolol 5 mg IV every 5 minutes can be given until a slow HR is attained. Alternatively, an IV method can be used alone to reduce overall preparation time; this would use the above dosing of IV metoprolol alone.16 Caution should be used in patients with a history of reversible airway disease, and beta-blockers should not be used in individuals with high-grade conduction block or hypotension.24
In patients with a contraindication to beta-blockers, alternative medications may be considered. Calcium channel blockers such as verapamil or diltiazem may represent alternative medications to slow the HR and have been utilized for CCTA in the past.25,26 Nevertheless, based upon clinical experience, calcium channel blockers appear to be less effective in short term control of HR as compared to beta-blockers and have not been systematically studied in patients undergoing CCTA. Current guidelines caution that the comparative efficacy of calcium channel blockers to control the heart rate for CCTA is unknown.16
Ivabradine is a novel agent that is a highly selective and specific inhibitor of the If current, which contributes to sinus node pacemaker activity. Notably, ivabradine lowers HR at concentrations that do not affect other cardiac ionic currents.27 As a result, ivabradine has few other observed direct cardiovascular effects.28 In a study of 123 patients referred for CCTA, Guaricci et al examined individuals with or without chronic beta-blockade and reported that ivabradine was safe and effective in decreasing heart rate and increased the percentage of patients achieving a target HR—less than 65 bpm. Further, this effect was observed both in patients with and without chronic beta-blocker therapy, and ivabradine reduced the need for additional IV beta-blocker administration prior to CCTA.29 Most recently, Pichler et al have shown that ivabradine decreases HR before CCTA sufficiently, with significantly less depression of systolic blood pressure compared to metoprolol.30 While this agent is not yet widely available or utilized, it exists as a potential alternative agent for HR control in CCTA.
Importantly, not all cardiac CT studies require HR control. For example, CT studies to map the left atrium and pulmonary veins prior to atrial ablation procedures31 and studies to assess the anatomy of the aortic valve and annulus prior to transcatheter aortic valve implantation32 are often performed in patients with atrial fibrillation at the time of the study and/or with HRs above typical goals. In these cases, motion artifact may preclude interpretation of the coronary arteries but not interpretation of these larger structures.
CORONARY VASODILATATION
Nitroglycerin results in coronary vasodilation, which may significantly improve the ability to visualize the coronary artery lumen. The use of sublingual nitroglycerin has been demonstrated to approximately double the cross-sectional area of the epicardial coronary arteries and to result in visualization of a larger number of small coronary artery branches.33 The use of 0.4 to 0.8 mg of sublingual nitroglycerin is recommended by guidelines to improve image quality and is typically given a few minutes prior to the coronary angiogram acquisition. Nitroglycerin may result in reduced blood pressure and is contraindicated in patients with baseline hypotension, or in patients with recent use of phosphodiesterase inhibitors such as sildenafil due to the potential for inducing hypotension.16
BREATHING INSTRUCTION
As adequate images require a heart that is stationary in the chest, CCTA is performed during a breath-hold. It is important that the patient practice the breath-hold instructions before the actual scan. This is required to confirm that patients can hold their breath for an adequate duration and that they have a reproducible technique in which the heart is in a similar position for the different series requiring breath-holds.16 As the HR can change during a breath-hold34, it is useful to practice this while observing the effect on HR, as further rate control medications may be needed if the HR increases during this time.
PATIENT POSITIONING
Proper patient positioning is essential for ensuring a good field of view and reducing streak artifacts and image noise. Patients should be imaged in the supine position with both arms raised above the head to remove the arms from the field of view.35 Additionally, the table height should be adjusted so the heart is within the center of the gantry to optimize spatial and temporal resolution. ECG leads and other metals, leads, or radio-opaque material should be away from the field of view to avoid any artifacts.16
CONTRAST
Iodinated contrast is required to increase the signal and contrast of the coronary artery lumen and to distinguish lumen from vessel wall and plaque. It is important to achieve a high-contrast density of the coronary artery lumen for adequate signal-to-noise (SNR) and contrast-to-noise ratios (CNR), and generally a coronary artery attenuation of at least 250 Hounsfield units (HU) is needed, which requires a power injection of at least 4 mL/s in a large IV line.16 The volume of contrast and contrast protocol depends on the indication for the study, as the study must be timed for optimal opacification of the region of interest. For example, optimal timing for visualization of the coronary arteries will be later than timing for the left atrium and pulmonary veins. Further, as imaging a larger volume of coverage takes longer, a CCTA that includes imaging of arterial bypass grafts will take longer, and both contrast timing and contrast volume may need to be adjusted. In general, typical contrast volumes range from 50 to 120 mL.
Contrast timing is critically important in CCTA, and a common cause of reduced image quality is imaging before or after optimal coronary opacification. The use of a standard delay is not recommended, as there is significant variation in the time from contrast administration in an intravenous line and peak opacification in the coronary arteries, which may be related to the patient’s size and intravascular volume, hemodynamic changes such as cardiac output and the rate of superior vena cava flow, and the contrast injection rate. Two general approaches to optimize contrast timing include the use of bolus tracking and a timing bolus. For bolus tracking, a region of interest is placed in the aorta, and sequential imaging occurs every few seconds after starting contrast administration. Once a specified attenuation level (such as 150 HU) is reached in the aorta, the CCTA acquisition is initiated. A timing bolus injects a small amount of contrast such as 10 to 20 mL, and acquires sequential images in the aortic root every few seconds. The resulting images can be reviewed to identify the optimal time delay for peak opacification in the aorta, and this is used to calculate the scan delay for the CCTA study.16,36,37
Alternate contrast protocols are available. Uniphasic contrast protocols inject only contrast, while biphasic injection protocols initially inject contrast followed by an injection of saline. Advantages of this protocol over uniphasic protocols include the need for less contrast volume, and decreased streak artifacts due to decreased high-density unmixed contrast entering the right atrium from the superior vena cava. Triphasic protocols inject contrast followed by a contrast and saline mixture (or a slower rate of contrast alone), followed by saline only and provide similar reductions in contrast volume as biphasic protocols, with improved visualization of right-sided cardiac structures.38 In general, biphasic or triphasic contrast injection protocols are recommended for CCTA when available.16
Multiple contrast agents are available, and selection of agents is generally dependent on site-specific practice, costs, and availability. Generally, agents with a high iodine concentration are preferred for CCTA to improve CNR in the coronary arteries.16,39,40
CORONARY ARTERY CALCIUM SCORING
Coronary artery calcium scoring (CACS) uses a noncontrast CT acquisition to image coronary artery calcification. As both calcium and contrast greatly increase the image signal of the coronary artery lumen, it can be challenging to differentiate these 2 using current techniques, and a separate noncontrast acquisition is required.41 This scan is performed using a prospective ECG gating, an axial technique in which images are acquired only during a short period of diastole, with generally less spatial resolution (2.5-3 mm) and is associated with a low radiation dose of approximately 1 to 2 mSv.42
There is a large amount of data suggesting that the CACS can provide significant prognostic information and improve our ability to classify individual risk of cardiac events.43,44 Further, the CACS is reproducible45 and may be useful to follow changes in calcified plaque burden over time.46 In addition to providing data on patient prognosis, the CACS can be used to better define the smallest possible coverage needed to image the heart, reducing radiation dose.16 Further, identification of extensive CACS may reduce the specificity of CCTA6, and some clinical sites will use the score to determine whether the patient is a good candidate for a CCTA.
In order to quantify coronary calcium, a HU of 130 is the cut-off for calcium. There are 3 ways of scoring calcification, including the Agatston score, volume score, and mass score. These scores are used to weigh the overall calcium burden in the coronary arteries and can be used to define the specific calcium score for each vessel as well as the total for each patient. The Agatston score is the most widely used score and has the most robust data regarding prognostic implications. The volume score is more reproducible, while the mass score has even higher reproducibility, although it requires careful calibration and is not commonly used in clinical practice.47 The total coronary calcium score is the sum of all the lesions in all the coronary vessels and excludes calcium in the aorta, aortic valve, mitral annulus or valve, and pericardium or myocardium.
SCAN SETTINGS AND RADIATION DOSE
Over the last several years there has been increasing attention to the potential risks associated with imaging tests that utilize ionizing radiation, with significant attention focused on the potential risks associated with cardiac CT.48–51 In response to these concerns, numerous methods have been developed which have resulted in marked reductions in radiation dose while preserving image quality.52
GATING TECHNIQUE
As described above, CT studies can be performed using helical or axial acquisitions. Initially, CCTA utilized retrospective ECGgating, which is a helical technique with significant scan overlap, such that each portion of the heart is imaged over multiple time points, and images can be reconstructed from all phases of the cardiac cycle.53 One of the advantages of this approach is that images can be reconstructed from any phase of the cardiac cycle; if significant motion artifact is observed on 1 phase, many additional phases can be evaluated, which may address many artifacts caused by motion.
One of the first developments to reduce radiation dose was dose modulation, in which standard tube current is utilized during diastole when the coronary arteries are most motion-free, and a reduced tube current is used during the rest of the cardiac cycle. This technique results in increased image noise outside diastole, but the images are still adequate for evaluation of larger cardiac structures. This results in an approximate 25% reduction in radiation dose,54–57 and is generally recommended when retrospective ECG gating is used.16
Using a dual-source CT scanner (DSCT), the tube current modulation can be reduced to as low as 4% of the full current outside a predefined window, further reducing the radiation dose.58–60 Image noise is increased during the phases of the cardiac cycle in which tube current is suppressed, particularly with maximal dose modulation. Nakazato et al reported that when left ventricular (LV) function measurements or wall motion evaluation or both are needed, LV wall motion and function can be accurately assessed by a low-radiation helical DSCT protocol that uses maximal ECG-gated tube current modulation applied for the briefest allowable time period in the cardiac cycle (70% phase only), with reduction of the nominal tube current down to 4% for all parts of the cardiac cycle. Imaging with this approach resulted in a low radiation dose and produced measures of LV regional wall motion and LV ejection fraction (EF) similar to 2D transthoracic echocardiography (TTE).59
Prospective ECG triggering results in a radiation dose reduction by an approximate 80%. This technique uses an axial acquisition method in which the heart is imaged only during a window during diastole, and the current is turned off and the table moves between these acquisitions. This technique has been demonstrated to result in comparable image quality, although the heart is not imaged during systole, and chamber function (such as LVEF) cannot be evaluated.13,61–64 Further, this method requires a regular HR and rhythm during image acquisition, which can be triggered at the wrong time during the cardiac cycle and result in misregistration artifact. Current guidelines support the use of prospective ECG triggering in appropriate patients.16 Further shortening of the scanner on time is possible on many scanner platforms, and this can result in a further decrease in radiation. This technique should only be considered in selected patients with low and regular HRs, as often only a single cardiac phase is available for reconstruction.65
High-pitch helical imaging is another technique that has been demonstrated to result in large reductions in radiation dose, which has been demonstrated to be feasible in patients with well-controlled HR using DSCT scanners. Using this technique, the table moves rapidly, and the entire heart is imaged in a single heart beat, resulting in doses that are comparable or lower than studies using prospective ECG-triggering.66,67
TUBE VOLTAGE
Tube voltage refers to the potential energy of photons created by the X-ray tube. Traditionally, 120 kVp has been used for cardiac imaging studies and was utilized for the majority of studies evaluating the diagnostic accuracy of CCTA.6–8 A higher tube voltage results in photons with higher energy, which will result in less attenuation by tissue structures and reduced image noise. Conversely, a lower tube voltage may result in improved image signal and contrast of iodinated contrast media, as this is closer to the k-edge of iodine. However, reduced tube voltage would be expected to result in excess image noise in larger patients and is only feasible in nonobese individuals. Reduced tube voltage is one means of reducing radiation dose, and as the radiation dose is proportional to the square of the tube voltage, this results in a marked decrease. Several studies have evaluated the use of reduced 100-kVp tube voltage in nonobese patients and reported similar image quality using both qualitative and quantitative parameters.55,68,69 One large international multicenter study observed that radiation doses for nonobese individuals undergoing 100-kV CCTA was approximately 50% lower than those derived from traditional 120-kV CCTA imaging, without compromise in image quality.63 An additional multicenter study reported that further reduced 80-kVp imaging may result in comparable image quality in individuals with a normal body size,70 but this has not been evaluated in further studies.
At present, guidelines suggest the use of 100- to 120-kVp tube voltage for CCTA studies, while 80 kVp may be considered in children and small adults, and 140 kVp may be considered in rare cases for extremely large patients.16 Reduced tube voltage is second only to the use of prospective ECG gating or high-pitch helical gating as a method to lower radiation dose.63
TUBE CURRENT
Tube current represents the number of X-ray photons emitted by the X-ray tube. Increasing the tube current will decrease image noise, increase tissue contrast and increase the radiation dose. Any increase in tube current results in a proportionally greater radiation dose. As smaller patients have less tissue to attenuate photons, less tube current may be needed in these individuals.
Many methods exist to adjust tube current based on patient body size. Husmann et al utilized a BMI-based approach to tube current selection in a prospective study of patients imaged using prospective ECG gating.70 This method has been widely applied71,72 and assumes that chest attenuation is proportional to the patient’s BMI. Nevertheless, there are significant variations in chest wall tissue even in patients with similar BMI, which may relate to the presence of breast tissue between genders and the relative composition differences between fat and muscle tissue. These differences have prompted sites to examine alternative methods, including examination of current selection based on image noise from noncontrast scans73 and chest area measurements.74
ITERATIVE RECONSTRUCTION
Iterative reconstruction utilized advanced statistical modeling to reduce image noise and improve image quality. As this method reduces image noise, it may permit the use of a lower tube current with preserved image quality as compared to standard tube current using traditional filtered back projection.75,76 Leipsic et al have demonstrated that the use of this method may be associated with the use of reduced tube current and a resulting decrease in radiation dose with preserved image quality.77,78
SCAN LENGTH
Scan length in the z-axis (cranial-caudal direction) is proportional to radiation dose,63 and to minimize radiation dose, imaging should be limited to the z-axis of interest. Using scout images, one can select coverage from just below the carina to the inferior margin of the heart.16 If noncontrast CACS images are available, these can be utilized to visualize the locations of the coronary arteries to further refine the coverage. In cases where additional imaging is required (eg, bypass grafts, thoracic aorta, pulmonary vasculature), this z-axis may be extended to provide the entire area of interest.
COMBINED USE OF DOSE REDUCTION METHODS
There are now numerous methods that can be used to lower the radiation dose of CCTA studies. Importantly, these methods are additive, and can be combined to result in markedly lower radiation doses. Compared to initial doses that often exceeded 20 mSv, current studies have reported large reductions CCTA doses. Alkhadi and colleagues recently evaluated the permutations of combining these methods for dose reduction and observed a stepwise reduction in radiation doses (from highest to lowest):
1. retrospective ECG helical CCTA with 120 kV tube imaging, 9 mSv
2. retrospective ECG helical CCTA with 100 kV tube imaging, 4 mSv
3. prospective axial triggering CCTA with 120 kV tube imaging, 3 mSv
4. prospective axial triggering CCTA with 100 kV tube imaging, 1 mSv
Importantly, this study observed similar image quality between these groups.79 More recent studies have also reported protocols achieving radiation doses approximating 1 mSv,66 representing 4 months of background radiation in the United States.80
Sites performing cardiac CT studies should develop specific protocols that take into account the specific scanner capabilities and manufacturer recommendations; the patient population being imaged; and specific patient characteristics such as body size, the presence of known CAD or prior revascularization, and the HR and HR variability. The development and use of such standardized protocols may optimize image quality and minimize radiation dose in a consistent manner for sites.52
CARDIAC CT INTERPRETATION
Accurate interpretation of cardiac CT requires significant training and experience, an understanding of the potential limitations and artifacts of this imaging modality, and continued education in the setting of technologic advances. Criteria have been proposed to determine levels of competence in cardiac CT interpretation and can include several pathways.81,82
As compared to invasive coronary angiography, CCTA possesses high diagnostic performance to identify obstructive CAD.6–8 However, invasive angiography can only visualize the vessel lumen and the presence of stenoses but cannot evaluate the coronary wall and plaque. In contrast, CCTA can identify plaque which may or may not result in coronary stenosis, can characterize plaque composition, and can identify other features such as positive remodeling (outward dilatation of the coronary artery and plaque to preserve vessel lumen)83 and the presence of low-attenuation plaque (which is correlated to the presence of lipid-rich plaque).84 As a result, CCTA interpretation may include data about the presence and characteristics of plaque in addition to the presence of luminal stenosis.85
Cardiac CT interpretation may also include extra-coronary cardiac structures within the field of view, including cardiac chamber size and function, cardiac valves, pericardium, epicardial fat, and anatomy of the great vessels and veins. Finally, interpretation may also encompass extracardiac structures such as the lungs, more distal arteries and venous structures, lymph nodes, and other surrounding tissue within the reconstructed field of view. Due to the large number of imaged structures, a systematic approach to interpretation is required that addresses the clinical indication for the study as well as additional findings of potential clinical relevance.
As CT data represent 3D datasets, cardiac images should be evaluated on a workstation capable of 3D postprocessing. These formats include multiplanar reformations, maximum intensity projections, curved multiplanar reformations, and volume-rendered images. As cardiac motion may introduce a number of motion-related artifacts, it is often useful to utilize multiple postprocessing techniques to optimally visualize the cardiac structures. Further, with most cardiac CT studies, multiple time points are available for reconstruction, and the reviewer may need to evaluate several time points to find optimal images with minimal motion artifacts.
Images are presented as a gray-scale representation of the image HUs, which reflect the relative attenuation of X-ray photons by the imaged structure. By convention, the HU for air is -1000 and for water is 0. These HU values can be assigned gray-scale values by adjusting the window width and level. The level reflects the center HU value, in which the color is exactly halfway between white and black. The width reflects the distance in HU between values represented by white or black. For example, a level of 300 HU and a width of 900 HU indicates that pure gray is represented by 300 HU, while black will be -150 HU and white will be 750 HU. Any values lower or higher than these values will be black or white, respectively. Assigning an optimal window width and level for CCTA interpretation is critically important to separate the contrast-enhanced lumen from calcified and noncalcified plaque. In general, the optimal level should be set at the HU value of the imaged structure. For example, if the mean opacification in the coronary arteries is 300 HU, a level of 300 HU may be optimal. Guidelines suggest setting a width that is approximately 2.5 times the level value. For CCTA studies using 120 kVp, an optimal starting point is often a width of 800 HU and a level of 300 HU.85
NONCONTRAST CORONARY INTERPRETATION
When noncontrast CACS is performed, these images should be reviewed to assess the presence and patterns of coronary calcification. Commercially available software packages can compute the calcium score on a per-artery and per-patient level, and these values should be provided using the Agatston score or other methods. It may also be helpful to report the presence and qualitative severity of calcification in other locations such as the aorta and valves.
CORONARY ARTERY INTERPRETATION
Axial Images
The first step in evaluating cardiac CT images is to scroll through the axial datasets. The raw data from the CT data acquisition are converted into digital images that are then converted to pixels expressed in HU and are reconstructed as a series of 2D images stacked in the cephalo-caudal direction. Axial images provide an overview of the dataset and can yield information for closer examination with maximum resolution and minimal distortion or errors secondary to postprocessing. One drawback to this format is that small structures such as the coronary arteries are only partially visualized and may move in and out of axial slices, requiring the reader to visually follow the path of imaged structures to mentally reconstruct the 3D images.
Volume Rendered Images
Volume rendering is a technique used for general anatomic analysis that creates a volumetric 3D display of the heart. This approach should not be used to assess coronary stenosis. However, this technique may be very useful to evaluate 3D spatial relationships, such as the course of anomalous arteries or the path of bypass grafts. These images are often included in CT reports, as they can highlight the spatial relationship between areas with pathology to other anatomic structures.
Multiplanar Reformatted Images
Multiplanar reconstructions (MPRs) offer additional perspective by allowing visualization of images at orthogonal or oblique planes through the acquisition volume. Oblique MPR imaging is the most sensitive for finding and characterizing lesions as it is easy to rotate the vessel on its longitudinal axis through 360 degrees or scroll through transverse MPRs along the vessel. MPR can be used to hone in on a suspected problem for further analysis, and the smallest available slice thickness is used to optimize image quality unless excess image noise requires an increased slice thickness. On many workstations, 2 or more MPRs of the same structure can be viewed simultaneously from different planes.
Curved Multiplanar Reformatted Images
Curved multiplanar reformatted (cMPR) images is a type of MPR image in which a centerline is placed in the coronary artery, and a sequence of MPR images is created that follows the artery along its course. This allows for the visualization of an entire artery simultaneously. A significant limitation with this technique is that this can produce artifacts when the centerline does not track the artery correctly. As these artifacts can mimic severe stenosis, it is important to verify correct centerline selection and to use additional postprocessing techniques to evaluate the coronary arteries.85
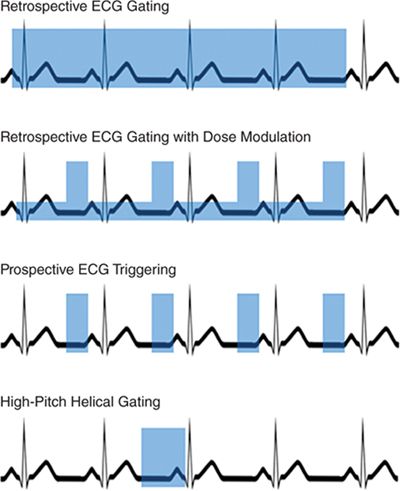
FIGURE 2-3 Gating techniques. This diagram demonstrates 4 methods of ECGgating, with the blue boxes demonstrating current on-time. In the case of retrospective ECG gating with dose modulation, the taller boxes represent full tube current, while the shorter boxes represent reduced tube current.
Related posts:
Stay updated, free articles. Join our Telegram channel

Full access? Get Clinical Tree


