Parkinson disease (PD) is the most common neurodegenerative cause of parkinsonism, followed by progressive supranuclear palsy and multiple system atrophy (MSA). Despite published consensus operational criteria for the diagnosis of PD and the various atypical parkinsonian disorders (APD) such as progressive supranuclear palsy, Parkinson variant of MSA, and corticobasal degeneration, differentiation of these clinical entities may be challenging, particularly in the early stages of the disease. Diagnosis of PD and its distinction from APD and symptomatic parkinsonism is crucial for the clinical evaluation, as these disorders differ in prognosis, treatment response, and molecular pathogenesis. Despite limitations the different modern magnetic resonance (MR) techniques have undoubtedly added to the differential diagnosis of neurodegenerative parkinsonism. This article focuses on static or structural conventional MR imaging techniques including standard T2-weighted, T1-weighted, and proton-density sequences, as well as different advanced techniques, including methods to assess regional cerebral atrophy quantitatively such as magnetic resonance volumetry, diffusion tensor and diffusion-weighted imaging, and magnetization transfer imaging, to assist in the differential diagnosis of neurodegenerative parkinsonian disorders.
Parkinson disease (PD) is the most common neurodegenerative cause of parkinsonism, followed by progressive supranuclear palsy (PSP) and multiple system atrophy (MSA). Despite the publication of consensus operational criteria for the diagnosis of PD and the various atypical parkinsonian disorders (APD) such as PSP, MSA—especially the Parkinson variant of MSA (MSA-P)—and corticobasal degeneration (CBD), differentiation of these clinical entities may be challenging, particularly in the early stages of the disease, where overlapping clinical signs lead to a high rate of misclassification. Indeed, clinicopathologic series have revealed error rates for a clinical diagnosis of PD during life of up to 24% even in the hands of experienced neurologists. On the other hand, diagnosis of PD and its distinction from APD and symptomatic parkinsonism are crucial for clinical evaluation, as these disorders differ in prognosis, treatment response, and molecular pathogenesis.
This article focuses on static or structural magnetic resonance (MR) techniques such as conventional MR (cMR) imaging, including standard T2-, T1-weighted, and proton-density sequences, as well as different advanced MR imaging techniques, including methods to assess regional cerebral atrophy quantitatively such as magnetic resonance volumetry (MRV), diffusion-weighted and diffusion tensor (DW/DT) imaging, and magnetization transfer (MT) imaging, to assist in the differential diagnosis of neurodegenerative parkinsonian disorders. Except for MR spectroscopy (MRS), functional MR imaging techniques including perfusion MR imaging (PW-MR imaging) and blood oxygenation level-dependent (BOLD) functional MR imaging, which are mainly experimental and only of limited usefulness for diagnostic aspects in a parkinsonian patient, are not covered here. For the review, the authors systematically searched PubMed from 1983 until May 2009 by using a highly sensitive though arduous search strategy adding the terms “brain,” “magnetic resonance imaging,” “MRI”, “magnetic ∗ ,” “DWI,” “DTI,” “diffusion,” “diffusion ∗ ,” “tensor,” “volumetry,” “MRV,” “VBM,” “voxel based morphometry,” “voxel ∗ ,” “spectroscopy,” “MRS,” “imaging,” “atrophy,” “diagnosis,” “diagnos ∗ ,” combined with “PD,” “APD,” “MSA,” “PSP,” “CBD,” “CBS,” “Richardson disease,” “Richardson ∗ ,” “atypical parkinsonism,” “parkinsonism,” “neurodegenerative,” “Parkinson’s disease,” “parkinson ∗ ,” “multiple system atrophy,” “multiple system,” “supranuclear,” “akinesia,” “progressive supranuclear palsy,” “corticobasal degeneration,” “corticobasal,” “corticobasal syndrome,” using free text or MESH terms, or both where appropriate. Only articles published in English were considered for the review.
Brain magnetic resonance imaging techniques
Since the early 1980s, MR imaging has been established in the routine diagnostic workup of neurologic disorders. The publication of 2 MR imaging studies on neurodegenerative parkinsonism in the same issue of the journal Radiology in 1986, dealing with Parkinson plus syndromes, represents the starting point for an increasing interest in different MR imaging techniques for the differential diagnosis in neurodegenerative parkinsonian disorders.
The principles of MR imaging are based on the ubiquitous presence of hydrogen in body tissues and the spin of the hydrogen atom proton, which induces a small magnetic field. In general, T2-weighted sequences are sensitive to changes in tissue properties, including tissue damage, due to changes of the transverse magnetization or T2 decay. Therefore, neurodegenerative processes characterized by cell loss, increased age-related deposition of iron or other paramagnetic substances, and by astroglial reaction and microglial proliferation may lead to signal changes in affected brain areas, like the basal ganglia or infratentorial structures, in neurodegenerative parkinsonism. Due to a lengthening of the T2 decay, gliosis increases signal intensity on T2-weighted imaging, consistent with findings in a postmortem case of MSA, where brain areas with the most pronounced microgliosis and astrogliosis correlated with the areas of hyperintense signal changes on MR imaging during life. Nonheme iron in ferritin and hemosiderin in the brain are visualized by MR imaging due to selective shortening of T2 but not T1 relaxation time, thus leading to signal loss and hypointensity on T2-weighted images with minimal or no intensity change on T1 images. The sensitivity for signal changes due to iron deposition in the brain can be increased by using T2 ∗ -weighted gradient echo sequences or susceptibility weighted contrasts, or by applying conventional spin echo instead of fast spin echo T2-weighted scans. Signal changes on T2-weighted images in the basal ganglia as well as in infratentorial structures have been reported for all APDs at 1.5 T, where they have been used as a differentiating criterion from PD. However, whereas hyperintense putaminal rims at T2-weighted images at 1.5 T are common in MSA-P and rare in PD or healthy controls, a hyperintense putaminal rim on T2-weighted images at 3.0 T seems to be a nonspecific, normal finding. When discussing signal changes at T2-weighted images in parkinsonian disorders here, the authors refer to 1.5 T field strengths, which is still the most commonly used technique in clinical routine and for which the most data are available.
T1-weighted sequences are important for anatomic details and provide good gray matter/white matter contrast. By using an inversion pulse, the contrast of T1-weighted images can be improved as in a magnetization-prepared rapid acquisition with gradient echo (MP-RAGE) sequence of high-resolution 3-dimensional (3D) datasets. Another attempt to improve gray versus white matter differentiation makes use of a ratio of images acquired by 2 distinct inversion recovery sequences, which depends only on T1, one designed to suppress white matter and the other to suppress gray matter. The combination of these pulse sequences for inversion recovery ratio imaging has been postulated to be sensitive to cell loss, and was used in an attempt to image structural changes within the substantia nigra.
As an indirect measure of brain structures known to be atrophic in different parkinsonian disorders, different groups have applied simple quantitative measures of diameters, areas, and volumes of different structures on MR imaging for the differential diagnosis of neurodegenerative parkinsonism. More recently, voxel-based morphometry (VBM) has aroused interest in detecting volume loss in neurodegenerative parkinsonism. VBM is based on coregistration of high-resolution 3D datasets as obtained by MP-RAGE sequences, which are normalized to a study-specific template for detection of volume differences between 2 or more groups. Contrary to operator-dependent segmentation techniques including region of interest (ROI) selection, VBM permits an operator-independent and automated detection of significant differences in different tissue types of the whole brain, involving voxel-wise statistical analysis of preprocessed structural MR images. Voxel-based relaxometry (VBR) is a technique based on voxel-by-voxel calculation of whole brain T2 relaxation rate (R2) maps derived from multi-echo T2-weighted images to assess signal abnormalities. However, as VBM and VBR involves groupwise comparisons, at this time it is not appropriate for routine diagnostic workup of individual patients. Furthermore, in performing a voxel-based study many methodological options are available and known for pitfalls, which are summarized in a recent review.
DW/DT imaging visualizes the random movement of water molecules in the tissue by applying diffusion-sensitizing gradients to assess changes in diffusion magnitude and orientation of water molecules in tissue. Quantification of the diffusivity is achieved by applying diffusion-sensitizing gradients of different degrees in 3 orthogonal directions and calculating the apparent diffusion coefficient (ADC) for each direction. The ADC is very dependent on the direction of diffusion encoding. To overcome this limitation, one can perform 3 orthogonal measurements and average the results to obtain a better approximation of the diffusion coefficient. This method is equivalent to the derivation of the trace from the diffusion tensor (Trace(D)). Therefore, the Trace(D) is sometimes also called averaged ADC (ADCave) or mean diffusivity. The random translational motion (diffusion) of water molecules in tissue is restricted by the highly organized architecture of fiber tracts in the central nervous system. Neuronal loss and gliosis disrupt this architecture, resulting in an increase of diffusivity and ADC. The complex neuronal architecture with its organization in fiber bundles that are surrounded by dense myelin sheaths leads also to a distinct anisotropy of water diffusion, which is facilitated along the direction of fiber tracts and restricted perpendicular to the fibers. The degree of anisotropy can be quantified by applying diffusion-sensitizing gradients in at least 6 directions, which permits calculation of fractional anisotropy (FA). Decreased FA values represent tissue degeneration due to normal aging or due to pathologic reasons such as neurodegeneration. Both diffusivity and FA can be combined to form the so-called diffusion tensor, which indicates direction and extent of diffusivity with the help of a vector.
MT imaging is based on the interactions between bound protons within structures as myelin or cell membranes and the mobile protons of free water. In MT imaging, a new contrast, depending on the exchange rate between coupled and free water protons, is induced by application of radiofrequency pulses that selectively destroy the magnetization of bound protons whereas free protons are unaffected. This process leads in turn to a decrease of the free water signal as exchange between free and bound water protons increases. The difference between signal intensities with and without MT is measured by calculating the MT ratios (MTRs), which correlate with the density of macromolecules, which are clearly reduced in demyelinated lesions and neurodegeneration. However, most studies using MTR do not account for T1 relaxation, which can modulate MT rates and thus lead to ambiguous results.
In proton magnetic resonance spectroscopy ( 1 H-MRS), protons chemically bound to different molecules can be differentiated by characteristic imprints of spectral resonances, the so-called chemical shifts. The main resonances in brain 1 H-MRS relate to N -acetylaspartate (NAA) as an indirect expression of the integrity and function of neurons, choline (Cho)-containing compounds as marker for cell membrane turnover indicating glial activity, creatine (Cr)-including phosphocreatine as a marker for energy metabolism, as well as lactate as an indicator for anaerobic glycolysis detected under pathologic conditions.
Diagnosis of neurodegenerative parkinsonian syndromes with different magnetic resonance imaging techniques
Conventional MR Imaging
In PD, standard T2-weighted, T1-weighted, and proton-density sequences at 1.5 T do not show disease-specific changes. Because cMR imaging is usually normal in early PD, cMR imaging takes a major part in excluding underlying pathologies such as vascular lesions, multiple sclerosis, brain tumors, normal pressure hydrocephalus, bilateral striopallidodentate calcinosis, and other potential, but rare causes of symptomatic parkinsonism such us Wilson disease, manganese-induced parkinsonism, or different subtypes of neurodegeneration associated with brain iron accumulation. Furthermore, visual assessment of MR imaging can point toward alternative diagnosis from PD, when abnormalities that are characteristic of one of the APDs are seen (see later discussion and figures). At 1.5 T, patients with advanced PD, and sometimes those with APD, may show distinct abnormalities of the substantia nigra (SN), including signal increase on T2-weighted MR images or smudging of the hypointensity in the SN toward the red nucleus. By using inversion recovery ratio imaging, structural changes in the SN have been reported in patients with PD. Although some investigators were able to discriminate completely between PD patients and controls by using inversion recovery ratio imaging, there was considerable overlap between normal and PD values in some of the studies published.
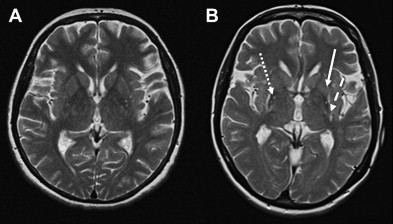
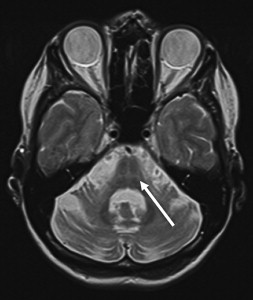
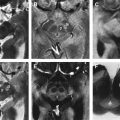
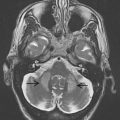
Several findings on conventional structural MR imaging have been described as diagnostic pointers for MSA-P. These pointers include atrophy and signal alterations (at 1.5 T) in the putamen ( Fig. 1 ) and several infratentorial regions, such as the presence of a hyperintense putaminal rim with or without hypointensity in the dorsolateral part of the putamen, pontine atrophy, the “hot-cross bun” sign of the pons ( Fig. 2 ), atrophy of the cerebellum, and hyperintensity in the middle cerebellar peduncle (MCP). Whereas putaminal atrophy appears to discriminate MSA from PD, T2 putaminal hypointensity and a putaminal hyperintense rim may be observed also in PD. In fact, on T2-weighted images at 3.0 T a hyperintense putaminal rim seems to be a nonspecific, normal finding. Specificity of the aforementioned abnormalities to differentiate MSA-P from PD and healthy controls is considered high, whereas sensitivity, especially in the early disease stages, seems to be insufficient. Sensitivity of signal alterations, however, can be somewhat improved by modifying technical aspects such as spatial resolution by using thinner slices, or relaxation contrast by using conventional spin-echo (CSE) or T2 ∗ -weighted gradient echo sequences.
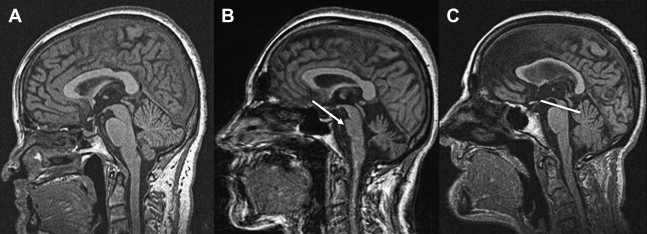
Specific brain MR imaging findings associated with PSP include midbrain atrophy with enlargement of the third ventricle and tegmental atrophy, signal increase in the midbrain and in the inferior olives, atrophy of the superior cerebellar peduncle (SCP) as well as frontal and temporal lobe atrophy. Indirect parameters of midbrain atrophy comprising reduced anteroposterior (AP) midbrain diameter, dilated third ventricle, and abnormal superior profile of the midbrain (flat or concave versus convex aspect in healthy people) may assist in the differential diagnosis of PSP. Another indirect sign of midbrain atrophy in patients with PSP is the “penguin silhouette” or “hummingbird” sign ( Fig. 3 ), where the shape of the midbrain tegmentum (the bird’s head) and pons (the bird’s body) on midsagittal MR images resemble a lateral view of a standing king penguin or hummingbird.
Visual assessment of atrophy of the SCP has been shown to distinguish PSP patients from controls and patients with other parkinsonian disorders including MSA and PD, with a sensitivity of 74% and a specificity of 94%. Moreover, some of the PSP patients may have increased signal changes in the SCP on fluid-attenuated inversion recovery (FLAIR) images, which seem to be absent in PD and MSA.
In patients with CBD, only few studies have investigated the role of cMR imaging, showing cortical (especially frontoparietal) atrophy, which tends to be asymmetric, putaminal hypointensity as well as hyperintense signal changes in the motor cortex or subcortical white matter on T2-weighted images. However, none of these cMR imaging abnormalities seems to be of diagnostic relevance for CBD. Indeed, a review of 40 autopsy cases presenting with a corticobasal syndrome in life and with different pathologies at postmortem confirms that MR imaging findings are similar regardless of the differing underlying pathology.
Overall, although specificity of cMR imaging for discriminating the different APDs from PD or healthy controls has been shown to be high, specificity of cMR imaging between the different APDs is inefficient.
MR Planimetry and ROI-based MR Volumetry
As an indirect measure of brain structures known to be atrophic in different parkinsonian disorders, groups have applied simple quantitative measures of diameters and areas on MR imaging for the differential diagnosis of neurodegenerative parkinsonism. In terms of infratentorial atrophy, differentiation of PSP and MSA from each other and from PD have been based on studies showing that patients with PSP have relatively greater midbrain atrophy and greater SCP atrophy whereas, conversely, patients with MSA have relatively greater pontine and MCP atrophy. A reduced AP midbrain diameter of less than 14 mm has been proposed to optimally separate PSP from other types of neurodegenerative parkinsonism and healthy controls, whereas there were overlapping individual values in more recent studies. The average MCP width was shown to be significantly smaller in patients with MSA than in those with PD or control subjects without any overlap between MSA patients and PD patients or healthy subjects, using a cutoff value of 8 mm. The separation of MSA from PSP patients, however, was inaccurate. Consistent with the well-known atrophy of the pons in MSA, the area of the pons measured on midsagittal T1-weighted MR images has been shown to be smaller in MSA-P patients compared with patients with PD and PSP as well as healthy controls, albeit with some overlap at the individual level. On the other hand, midbrain areas measured on midsagittal T1-weighted MR images are smaller in PSP patients compared with healthy controls and patients with PD and MSA-P. Calculation of the ratio between pontine and midbrain areas has been demonstrated to discriminate completely between PSP patients and patients with PD, MSA-P, or healthy controls, whereas there were overlapping individual values in another study. For this reason, Quattrone and colleagues proposed an index termed the MR parkinsonism index (MRPI), which was calculated by multiplying the ratio of pontine-to-midbrain area (P/M) by the ratio of the MCP-to-SCP width (MCP/SCP). The MRPI was significantly larger in patients with PSP than in healthy controls and patients with both PD and MSA-P, and completely separated PSP patients from the other groups, such that further confirmatory studies seem warranted.
Volume loss of different supratentorial and infratentorial brain structures, measured by MRV with semi-automatic segmentation techniques on a ROI approach, has been reported in patients with MSA, PSP, and CBD. On the other hand, most of the ROI-based MRV studies were not able to detect any volume differences in the basal ganglia, whole brain, infratentorial brain structures, or different brain lobes between PD patients and controls. With advancing disease, however, hippocampal atrophy has been reported in patients with PD compared with healthy controls at a group level.
Patients with MSA showed significant reductions in mean striatal, brainstem, and cerebellar volumes, and patients with PSP showed significant reductions in whole brain, striatal, brainstem (especially midbrain), and frontal volumes. Only one study used the volumetric approach in CBD, and found atrophy of the parietal cortex and corpus callosum. The strength of this latter study is the use of postmortem confirmed cases of PSP and CBD, and controls to construct a mathematical model derived from a discriminant analysis. The volumes of midbrain, parietal white matter, temporal gray matter, brainstem, frontal white matter, and pons were identified to separate best between groups predicting the diagnosis correctly in 95% of controls, as well as in 76% of all PSP and 83% of all CBD patients.
Voxel-based Morphometry and Relaxometry
More recently, VBM has aroused interest in detecting volume loss in neurodegenerative parkinsonism. Whereas most of the ROI-based MRV studies were not able to detect any volume differences between PD patients and controls, various VBM studies revealed gray matter loss of frontal cortical areas, including motor areas, especially in advanced PD.
In patients with MSA, VBM confirmed previous ROI-based volumetric studies showing basal ganglia and infratentorial volume loss in MSA-P patients. Furthermore, these data also revealed volume loss in several cortical regions in patients with MSA-P and MSA-C. VBM has also been used to investigate the progression of cortical and subcortical atrophy patterns in MSA-P compared with PD, and revealed early degeneration of the basal ganglia followed by later onset cortical atrophy.
Most recently, VBR was used to study brain morphology of MSA-C versus MSA-P and healthy volunteers. In accordance to the VBM analysis in MSA-C that showed reductions of gray and white matter in the cerebellum and brainstem, VBR analysis revealed reduction of relaxation rate R2 in the same regions, reflecting infratentorial brain atrophy. In addition, R2 was increased in the putamen, a region in which VBM did not show abnormalities, thus suggesting that the combination of VBR and VBM may provide convergent and complementary information about the brain morphology of MSA-C. Using VBM and VBR, direct comparison of MSA-C and MSA-P showed differences only in infratentorial brain regions where structural abnormalities were more pronounced in MSA-C than in MSA-P. In MSA-C, there was a stronger volume reduction of gray matter in the basal parts of the cerebellum and of white matter in the brainstem, as well as a stronger reduction of the relaxation rate R2 in the cerebellum and brainstem.
By applying VBM, gray matter loss in PSP patients has been found in frontotemporal cortical areas such as the prefrontal cortex, the insular region comprising the frontal opercula, the supplementary motor areas, and the left mediotemporal area, whereas white matter loss has been additionally reported in the midbrain including cerebral peduncles and central midbrain. A further study compared patients with PSP not only to controls but also to PD patients, and described a similar pattern of white matter volume loss in the midbrain comprising subthalamic region, cerebral peduncles, and midbrain tegmentum. Of note, this latter study tested the clinical utility of the VBM results as a guide for the differential diagnosis of PSP from PD and controls by allocating the subject to either PSP or “non-PSP” based on the presence or absence of the midbrain tissue loss on T1-weighted images as detected by the VBM analysis, and achieved a sensitivity of 83% and a specificity of 79%. A more recent study used VBM to compare neuroanatomical differences between clinically diagnosed PSP and CBD patients. Midbrain structures were more atrophied in PSP than in CBD, whereas dorsal frontal and parietal cortices were more atrophied in CBD than in PSP.
Diffusion-Weighted and Diffusion Tensor Imaging
Whereas earlier studies focusing on measures of diffusivity, but not FA, mainly in the midbrain and SN did not find any differences between PD patients and healthy controls, several newer studies detected a decrease in FA in the SN in patients with PD compared with healthy controls. This observation is in line with the well-known neurodegeneration of the SN in PD, although the exact mechanism of the reported FA changes is not known. Whereas FA measures could not identify PD patients on an individual basis consistently in 2 older studies using DT imaging at 1.5 T, a recent study including only patients with newly diagnosed PD used high-resolution DT imaging at 3 T to evaluate rostral, middle, and caudal ROIs within the SN on a single slice of the midbrain and this study found that PD patients could be completely separated from the control group based on reduced FA values in the caudal ROI of the SN, such that further confirmatory studies seem warranted.
Other groups drew attention by performing whole brain DT imaging analyses in patients with PD. The finding of an increase of the 25th percentile of the whole brain FA histograms in patients with de novo PD compared with age-matched controls in the absence of total brain, gray matter, and white matter volume changes between the 2 groups was interpreted as subtle whole brain gray matter loss in patients with PD, even in the early clinical stages. By using statistical parametric mapping analysis of DT imaging, changes in FA were found in the frontal lobes, including the supplementary motor area, the presupplementary motor area, and the cingulum in nondemented PD patients relative to controls, whereas VBM analysis in the same patients revealed no volume loss. These results confirm that the neurodegenerative process extends beyond the basal ganglia in PD.
By applying voxel-wise analysis on Trace(D) maps, MR structural changes of the olfactory tract were found in patients with PD, a particularly intriguing finding given that hyposmia is present some 90% of patients with PD.
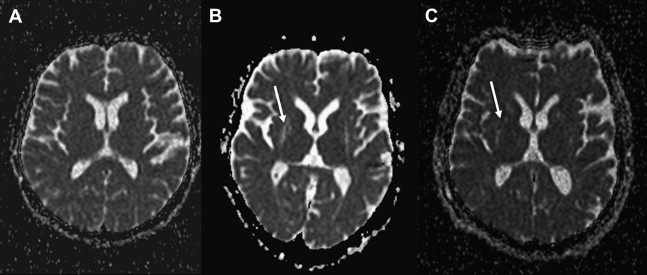
Over the past decade, there has been growing interest also in the use of DW/DT imaging for the differential diagnosis of APDs from PD. The most relevant studies are summarized in Table 1 . Several studies performed on a ROI basis have shown that DW imaging permits discrimination between MSA-P in early disease stages and PD as well as healthy subjects, based on putaminal diffusivity measure values. Whereas increased putaminal ADC and Trace(D) values ( Fig. 4 ) overlapped in MSA-P and PSP patients, abnormal diffusivity measures in the MCP and SCP have been reported for MSA and PSP, respectively, with some studies reporting a good differentiation of PSP and MSA from each other or from controls, PD, or even corticobasal syndrome (CBS).
| Study, Year | Cohort Size/Methods | Results | Diagnostic Predictor | Sensitivity (%) | Specificity (%) |
|---|---|---|---|---|---|
| Schocke et al, 2002 |
|
| ADCs in the basal ganglia, pons, white matter; sensitivity and specificity values given for putaminal ADCs (best discriminator) | ||
| Putaminal ADCs > 0.760 × 10 3 mm 2 /s | 100 (MSA-P) | 100 (vs PD and HC) | |||
| Seppi et al, 2003 |
|
| |||
| Putaminal ADCs > 0.760 × 10 3 mm 2 /s | 100 (MSA-P)/90 (PSP) | 100 (vs PD) | |||
| Kanazawa et al, 2004 |
|
| |||
| Seppi et al, 2004 |
|
| Striatal ADCs | ||
| Striatal ADCs > 0.795 × 10 3 mm 2 /s | 93 (MSA-P) | 100 (vs PD and HC) | |||
| Schocke et al, 2004 |
|
| Putaminal diffusivity values | ||
| Putaminal Trace(D) > 0.80 × 10 3 mm 2 /s | 100 (MSA-P) | 100 (vs PD and HC) | |||
| Shiga et al, 2005 |
|
| |||
| Seppi et al, 2006 |
|
| Putaminal ADC values of the whole, anterior, and posterior putamen | ||
| Putaminal ADC > 0.80 × 10 3 mm 2 /s | 93 (MSA-P) | 100 (vs PD and HC) | |||
| Posterior putaminal ADC > 0.80 × 10 3 mm 2 /s | 100 (MSA-P) | 100 (vs PD and HC) | |||
| Nicoletti et al, 2006 |
|
| ADC values in the basal ganglia, pons, white matter; sensitivity and specificity values given for putaminal and MCP diffusivity (best discriminators) | ||
| MCP ADC > 0.875 × 10 3 mm 2 /s | 100 (MSA-P) | 100 (vs all groups) | |||
| Putaminal ADC > 0.953 × 10 3 mm 2 /s | 100 (MSA-P) | 100 (vs PD and HC) 81 (vs PSP) | |||
| Putaminal ADC > 0.93 × 10 3 mm 2 /s (estimated from Fig. 2 of the article) | 75 (PSP) | 97 (vs PD and HC) 100 (vs PD) 94 (vs HC) | |||
| Blain et al, 2006 |
|
| |||
| Padovani et al, 2006 |
|
| |||
| Nilsson et al, 2007 |
|
| |||
| Köllensperger et al, 2007 |
|
| Putaminal ADC values | ||
| Putaminal ADC > 0.79 × 10 3 mm 2 /s | 100 (MSA-P) | 100 (vs all groups) | |||
| Paviour et al, 2007 |
|
| ADC values in the basal ganglia, pons, MCP, SCP, thalamus; sensitivity and specificity values given for MCP diffusivity (in the article) | ||
| MCP ADC > 0.733 × 10 3 mm 2 /s | 91 (MSA-P) | 82 (vs all groups)/ 84 (vs PSP) | |||
| Ito et al, 2007 |
|
| FA and ADC in the pons, cerebellum, and putamen at 3.0 T; sensitivity and specificity values given for MSA-P10 vs PD | ||
| ADC pons > 0.98 × 10 3 mm 2 /s | 70 | 70 | |||
| ADC cerebellum > 0.96 × 10 3 mm 2 /s | 60 | 88 | |||
| ADC putamen > 0.83 × 10 3 mm 2 /s | 70 | 64 | |||
| FA pons < 0.38 | 70 | 100 | |||
| FA cerebellum < 0.30 | 70 | 64 | |||
| FA putamen < 0.35 | 70 | 88 | |||
| both low FA and high ADC values in any of the 3 areas | 90 | 100 | |||
| Nicoletti et al, 2008 |
|
| SCP ADC values | ||
| SCP ADC > 0.943 × 10 3 mm 2 /s | 100 (PSP) | 93 (vs PD and MSA-P)/100 (vs HC) 100 (vs PD) 87 (vs MSA-P) | |||
| Rizzo et al, 2008 |
|
| ADC values of all ROIs, medians of left and right cerebral hemispheres and of left and right deep gray matter regions, and symmetry ratios for both hemispheres and deep gray matter regions; sensitivity and specificity values given for best discriminators | ||
| Putaminal ADC > 0.745 × 10 3 mm 2 /s | 86 (CBS) | 91 (vs HC and PD) 92 (vs PD) | |||
| Putaminal ADC > 0.735 × 10 3 mm 2 /s | 80 (PSP) | 82 (vs HC and PD) 77 (vs PD) | |||
| SCP ADC > 0.815 × 10 3 mm 2 /s | 90 (PSP) | 75 (vs all groups) 91 (vs HC and PD) 85 (vs PD) | |||
| Median ADC in the higher valued hemisphere > 0.925 × 10 3 mm 2 /s | 86 (CBS) | 81 (vs all groups) 77 (vs HC and PD) 85 (vs PD) 90 (vs PSP) | |||
| Median ADC in the higher valued hemisphere > 0.895 × 10 3 mm 2 /s | 100 (CBS) | 72 (vs all groups) 64 (vs HC and PD) 62 (vs PD) 90 (vs PSP) | |||
| Hemispheric symmetry ratio > 0.981 | 100 (CBS) | 100 (CBS) | |||
| Boelmans et al, 2008 |
|
| |||
| Pellecchia et al, 2009 |
|
| |||
| Tir et al, 2009 |
|
|
Although most reports have found clearly increased putaminal diffusivity measures in MSA-P at 1.5 T, there was one study which did not confirm this. Methodological reasons (ie, segmentation error as demonstrated by a published figure where the delineated ROI of the putamen clearly contains parts of the globus pallidus and the thalamus is larger than that displayed; inadequate DW-MR protocol with a slice thickness of 7 mm compared with 2–5 mm used in other studies) and demographic (longer disease duration of the PD group) might explain this discrepancy. The same study also failed to detect diffusivity changes in the SCP of PSP patients, again in contrast with previous reports showing significantly increased diffusivity measures in the SCP in PSP patients at 1.5 T. Although abnormal diffusivity in the MCP has been reported to have a high diagnostic accuracy for MSA-P in some articles, this could not be confirmed by others.
Of particular relevance to the use of MR imaging measures as biomarkers for disease progression, several studies have found a correlation of putaminal diffusivity measures with disease severity.
Using 3.0 T in patients with MSA, PD, and controls, all patients that had both significantly low FA and high diffusivity values in the 3 areas studied (pons, putamen, and cerebellum) were MSA-P cases, and those that had both normal FA and Trace(D) values in the pons were all PD cases. More recently, DW imaging has also been studied in patients with CBS, as summarized in Table 1 .
Magnetization Transfer Imaging
Abnormalities of the basal ganglia and SN by using MT imaging have been reported in patients with PD, MSA, and PSP. It has been suggested that in patients with PD, MTR in the pars compacta of the SN is decreased at a group level, with overlapping individual values. One study investigated the potential of MT imaging in the differential diagnosis of neurodegenerative parkinsonism, including 37 patients with different parkinsonian syndromes and 20 age-matched controls. The main finding in this study was a change in the MTRs in the globus pallidus, putamen, caudate nucleus, SN, and white matter in PD, MSA, and PSP patients, matching the pathologic features of the underlying disorder. MTRs were significantly reduced in the putamen in MSA patients compared with PD patients and healthy controls, as well as in the SN in patients with PSP, MSA, and PD. By application of stepwise discriminant analysis, there was a good discrimination of PD patients and controls from the MSA and PSP patients, with only 1 out of 12 MSA patients wrongly classified into the control group. On the other hand, separation between PD patients and controls as well as between MSA and PSP patients was insufficient.
Proton Magnetic Resonance Spectroscopy
Studies using 1 H-MRS have shown reduced NAA/Cr and NAA/Cho ratios in the lentiform nucleus or striatum, not only in APD but also in PD, disproving previously published results that suggested that 1 H-MRS of striatal structures might differentiate APDs from PD by virtue of reduced NAA/Cr ratios in MSA but not PD. Technical factors, including the application of different echo and relaxation times, voxel sizes, and pulse sequences, mostly may account for some of the contradictory results.
The development of 1 H-MRS at higher magnetic field strengths may lead 1 H-MRS to a more important role as imaging tool in the differential diagnosis of parkinsonian disorders. 1 H-MRS at higher magnetic field strengths increases sensitivity and dispersion of the chemical shift, even though greater magnetic susceptibility may diminish this benefit. A recent study applied multiple regional single-voxel 1 H-MRS including putamen, pontine base, and cerebral white matter at 3.0 T in 24 patients with MSA compared with 11 PD patients and 18 controls. In both MSA-C and MSA-P significant NAA/Cr reductions were shown in the pontine base, whereas reduced putaminal NAA/Cr was found in the patients with MSA-P. There was a significant NAA/Cr reduction in the pontine base as well as in the putamen in patients with MSA-P compared with both controls and PD, which suggests that the combined assessment of NAA/Cr in the pontine base and putamen may help to distinguish MSA-P from PD.
Related posts:
 Current Role of Functional MRI in the Diagnosis of Movement Disorders
 Anatomy of the Substantia Nigra and Subthalamic Nucleus on MR Imaging
The Role of Imaging in the Diagnosis of Vascular Parkinsonism
Anatomy of the Substantia Nigra and Subthalamic Nucleus on MR Imaging
The Role of Imaging in the Diagnosis of Vascular Parkinsonism
 How Can Neuroimaging Help in the Diagnosis of Movement Disorders?
The Role of Imaging in the Surgical Treatment of Movement Disorders
How Can Neuroimaging Help in the Diagnosis of Movement Disorders?
The Role of Imaging in the Surgical Treatment of Movement Disorders
 Role of Transcranial Ultrasound in the Diagnosis of Movement Disorders
Stay updated, free articles. Join our Telegram channel

Full access? Get Clinical Tree


