Cardiac
 CLINICAL CONSIDERATIONS
 CLINICAL INDICATIONS
 ANATOMIC CONSIDERATIONS
 GETTING STARTED
 TECHNIQUE AND NORMAL ULTRASOUND FINDINGS
 MEASUREMENTS
 COMMON AND EMERGENT ABNORMALITIES
 COMMON VARIANTS AND SELECTED ABNORMALITIES
 PITFALLS
 CASE STUDIES
Echocardiography is the gold standard for the diagnosis of many cardiac abnormalities. Point-of-care echocardiography (or focused cardiac ultrasound), performed and interpreted by clinicians, was described 25 years ago.1–3 Since then, there has been a significant amount of accumulated data to demonstrate that this practice changes management and improves patient care.4–73 Clinician-performed echocardiography is now a well-accepted part of the practice of emergency medicine.43,74,75 In addition, clinicians who manage critically ill or injured patients in other clinical settings are adopting the practice of focused cardiac ultrasound.76–115
Focused cardiac ultrasound is not meant to replace comprehensive echocardiography; it is a completely different paradigm in which a goal-directed examination is meant to answer specific clinical questions, not to detect all possible cardiac pathology. Some clinicians may use cardiac ultrasound to answer just one clinical question and others may use it for a wide variety of applications. Regardless, most focused cardiac ultrasound applications are relatively straightforward to learn because they rely on simple two-dimensional (2D) imaging and pattern recognition.116
 CLINICAL CONSIDERATIONS
Focused transthoracic echocardiography is an ideal diagnostic tool for detecting life-threatening cardiac conditions in the ED. Some of the information obtained from focused cardiac ultrasound could be obtained by invasive monitoring techniques, but it is not practical to use invasive techniques on all patients with potentially life-threatening conditions. In addition, placement of invasive monitoring devices is time consuming and is associated with complications.
Without bedside echocardiography, clinicians are left to manage critically ill patients with only indirect information about cardiac structure and function. “Classic” physical examination findings are often absent and unreliable for making critical diagnoses. Electrocardiograms (ECGs) are very helpful in patients with certain cardiac problems, but the majority of critically ill patients have nonspecific ECG findings. Chest radiographs provide very limited information about cardiac structure and function.
In cardiac arrest with pulseless electrical activity (PEA), it is critical to determine whether the patient has true electromechanical dissociation (EMD) with cardiac standstill or pseudo-EMD with mechanical cardiac contractions too weak to generate a palpable blood pressure.117 Many patients with PEA have severe hypovolemia, while others have cardiac tamponade, massive pulmonary embolism (PE), or severe left ventricular dysfunction. All of these conditions can be detected with bedside transthoracic echocardiography. Echocardiography can be performed serially during a critical resuscitation as long as the examination itself does not interfere with resuscitative efforts.
Point-of-care cardiac ultrasound is also useful in stable patients with a wide variety of presentations. Pericardial effusions often cause nonspecific or minimal symptoms until tamponade develops. Focused echocardiography is the most efficient method to evaluate for a “silent” pericardial effusion since it is not reasonable to order a comprehensive echocardiographic examination on every patient with vague complaints who may have a pericardial effusion. Also, about 6% of all patients over 45 years of age have “silent” heart failure.118,119 Many patients also have “silent” valvular disease and may benefit from focused echocardiography, even if the valves are not fully evaluated and the only information gained is the presence or absence of gross chamber enlargement. Transesophageal echocardiography (TEE) is used widely in the perioperative and intensive care settings and has the potential to be very useful in the hands of emergency physicians.7
 CLINICAL INDICATIONS
Any patient at risk of significant CV compromise is a candidate for a focused bedside echocardiographic examination. Patients with significant disease have widely varying presentations, from cardiac arrest to vague symptoms of dizziness, shortness of breath, or chest discomfort.6,40 The challenge is to determine which echocardiographic findings can be readily recognized by noncardiologists with minimal training and which patients need comprehensive echocardiography.
Primary indications for focused cardiac ultrasound include:
 Cardiac arrest
 Pericardial effusion and tamponade
 Massive pulmonary embolism
 Left ventricular structure and function
 Volume status and fluid responsiveness
 Unexplained hypotension
 Guidance of emergency cardiac pacing
Other indications for focused cardiac ultrasound include:
 Valvular abnormalities
 Proximal aortic dissection
 Myocardial ischemia and infarction
CARDIAC ARREST
Bedside echocardiography is invaluable for directing management in cardiac arrest or near cardiac arrest states. Prior to the 1980s, all patients who had an organized electrical rhythm but no pulse were thought to have EMD. In the mid-1980s, using arterial catheters and echocardiography, physicians discovered that many patients with apparent EMD have mechanical contractions that are too weak to produce a blood pressure detectable by palpation.1,2,10,117,120
A 1988 study described two very different categories of EMD, those with “true” EMD and those with mechanical cardiac contractions. It observed that those with “true” EMD, or cardiac standstill, have a dismal prognosis, similar to the prognosis for asystole.2 Several studies reported that more than half of patients with PEA have mechanical cardiac contractions.10,13,63,121 In addition, multiple studies reported that patients initially thought to be in asystole may have cardiac contractions.13,63,122
Studies have confirmed that palpation of pulses is an unreliable means of assessing cardiac function and blood pressure. One study questioned whether carotid, femoral, or radial pulses correlated with certain blood pressure measurements.123 They attempted to palpate pulses in 20 hypotensive patients who had arterial lines and invasive blood pressure measurement already established. They found that as systolic blood pressure declined the radial pulse always disappeared before the femoral pulse, which always disappeared before the carotid pulse. Surprisingly, the absence of pulses from a specific location did not correlate with an absolute blood pressure but was widely variable; for instance, several patients had palpable carotid pulses with a measured systolic blood pressure between 30 and 60 mm Hg. More worrisome was the finding that about 10% of these patients had no palpable carotid pulse with measured systolic blood pressures between 50 and 80 mm Hg.123
Since carotid pulses have been shown to be an unreliable means for determining true cardiac arrest, basic life support guidelines put forth by the American Heart Association have de-emphasized carotid pulse checks for both lay rescuers and healthcare providers.124 One study found that healthcare providers are often inaccurate and unsure of themselves when doing carotid pulse checks during CPR.121 Bedside echocardiography allows clinicians to directly visualize the heart and determine the presence and quality of mechanical cardiac function during a cardiac arrest. If a carotid pulse is absent but echocardiography shows reasonable mechanical cardiac function, then clinicians should proceed with aggressive resuscitation.
Several studies have examined whether bedside echocardiography in PEA can predict the outcome of cardiac arrest resuscitation. A 2001 study reported that 56% of patients presenting to two community hospitals with PEA had cardiac contractions on bedside echocardiography; 26% of those with contractions and 4% (one patient) with cardiac standstill survived to hospital admission.63 A 2012 study reported that 24% of cardiac arrest patients had cardiac movement; 40% of those with contractions and 3% (one patient) with cardiac standstill survived to hospital admission.125 In a multicenter trial from four academic medical centers, 32% of patients with PEA had mechanical contractions; 73% of those with mechanical contractions had return of spontaneous circulation and no patient with cardiac standstill had return of spontaneous circulation.62 A 2010 study showed that 35% of those initially thought to have asystole and 58% of those with PEA had coordinated cardiac motion. They also reported that early echocardiography altered management in 78% of patients with cardiac arrest or shock.13
In current practice, many emergency physicians use echocardiography to confirm cardiac standstill before terminating resuscitation in all cardiac arrests. It may be reasonable to consider terminating resuscitative efforts in patients with PEA and cardiac standstill (true EMD). However, it is important to understand that some studies have shown that PEA with cardiac standstill is uniformly fatal, but others show a 3–8% survival to hospital admission after initial cardiac standstill.8,13,62,63,125 This discrepancy is probably due to varying definitions of the term “cardiac standstill.”
Beyond predicting the outcome of resuscitation, echocardiography is essential to rapidly identifying the cause of the cardiac arrest. Pulseless patients with nonshockable rhythms often have reversible conditions and can be treated successfully if those conditions are identified early.117 The most common causes of PEA are listed in Table 6-1.117 Hypovolemia, cardiac tamponade, massive PE, and massive myocardial infarction can be detected by bedside echocardiography so that early aggressive management of these abnormalities can be instituted.13,38,125–128
 TABLE 6-1. MOST COMMON CAUSES OF PULSELESS ELECTRICAL ACTIVITY
Hypovolemia
Hypoxia
Acidosis
Hypo/hyperkalemia
Hypoglycemia
Hypothermia
Drug overdose
Cardiac tamponade
Tension pneumothorax
Massive myocardial infarction
Massive pulmonary embolism
Cardiac ultrasound should be used in an advanced life support (ALS) conformed manner, so that ultrasound does not interrupt or delay standard ALS care.13,14,129,130 This is accomplished by performing cardiac ultrasound only during scheduled pulse checks according to the ALS protocol.14
The first question to answer using bedside echocardiography is whether the etiology of the arrest is likely to be cardiac or noncardiac. Severe left ventricular dys-function will be apparent. Some investigators have reported using a similar approach to determine whether hypotension had a cardiac or noncardiac etiology. The authors compared 2D echocardiography with hemodynamic measurements from pulmonary artery catheters and found that in 86% of cases echocardiography correctly determined whether the etiology of shock was cardiac or noncardiac.131 In addition, studies have shown that emergency physicians can accurately estimate left ventricular function, especially when left ventricular dys-function is severe.44,52,58
One prospective study used cardiac ultrasound in an ALS-conforming manner to identify patients with “pseudo-PEA” (cardiac contractions but no palpable pulses).130 When cardiac contractions were noted, they extended the 10-second pulse check to 25 seconds and immediately administered 20 units of vasopressin, and then rechecked for pulses. Fifteen of 16 (94%) of these patients had return of spontaneous circulation and 8 patients (50%) had good neurologic outcome.
Patients in cardiac arrest with PEA as a result of severe hypovolemia will have a small, empty-appearing heart on bedside echocardiography.126 Both the right and left ventricles will be poorly filled and the right ventricle will be almost completely collapsed. The left ventricle will usually be vigorous. The inferior vena cava (IVC) will have a small diameter and its lumen will disappear completely during inspiration (or expiration when positive pressure ventilation is being used). These findings on bedside echocardiography should prompt the clinician to aggressively replace volume and consider the etiology of hypovolemia.
One of the most straightforward applications of bedside echocardiography during cardiac arrest is evaluating for a pericardial effusion.2,56,57 A pericardial effusion presents as an anechoic stripe surrounding the heart and should be obvious if it is large enough to cause cardiac tamponade. This finding should prompt the clinician to perform an immediate pericardiocentesis using ultrasound guidance (See Chapter 8, “Critical Care” and Chapter 22 “Additional Ultrasound-Guided Procedures,”). Pericardiocentesis can be life-saving and the removal of just a small amount of fluid may result in significant improvement in cardiac output.1,2,41,127
Massive PE is responsible for about 10% of cardiac arrests in cases where a primary cardiac etiology is clinically suspected.132,133 The routine use of bedside echocardiography in cardiac arrest may allow immediate detection of massive PE, even in cases where the diagnosis is not clinically suspected.26,32,38,39,134,135 It is important to immediately recognize that PE is the cause of a cardiac arrest because early thrombolytic therapy has been shown to significantly improve the chance of return of spontaneous circulation. A review of 60 cases of cardiac arrest caused by massive PE found that 81% of patients who received early thrombolytic therapy had return of spontaneous circulation compared with 43% for those who did not receive the therapy.132
There is some evidence that TEE may be an attractive alternative to the transthoracic approach for patients in cardiac arrest. Image quality is better with transducer placement in the esophagus due to its proximity to the heart and lack of artifacts caused by interpositioned lung or bone tissue. It is not affected by body habitus or subcutaneous air. Perhaps the biggest advantage is the ability to minimize the interruption of chest compressions for transthoracic imaging. The TEE transducer may be left in place during the entire resuscitation and usually does not require changes in position, allowing the entire team to continuously view the heart. In addition, it is electrically isolated, so it can even be left in place during defibrillation.
A 2008 publication reviewed six cases where TEE offered distinct advantages over transthoracic echo, including detection of occult pathology in two patients who had aortic dissection and PE.7 A 2009 study showed that TEE can be used to evaluate the effect of chest compressions and reported inadvertent compression of the aortic root or left ventricular outflow tract (LVOT) resulting in a 19–83% incidence of outflow obstruction during chest compressions.136 TEE is generally considered a very safe imaging modality and the incidence of esophageal injury is extremely low (0.03%).137 The additional equipment costs, learning curve, and maintenance issues associated with this technique may limit generalized use of TEE in point-of-care sonography.
PERICARDIAL EFFUSION AND TAMPONADE
In 1992, Plummer reported 100% sensitivity for recognizing pericardial effusion in the first 6 years after his group of emergency physicians began screening penetrating trauma patients with bedside echocardiography. More importantly, the use of bedside echocardiography significantly reduced the time to diagnosis and disposition to the operating room from 42 minutes to 15 minutes, while patient survival improved from 57% to 100%.55 Bedside focused echocardiography is now the standard of care for patients with potential penetrating cardiac injuries (Figure 6-1).108,138,139
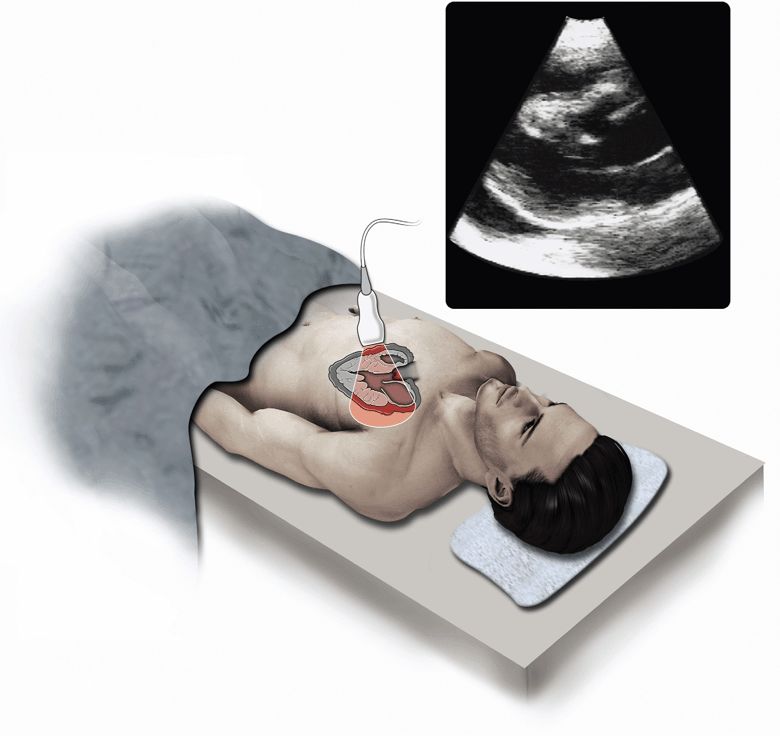
Figure 6-1. Pericardial effusion/tamponade. Ultrasound techniques and findings are outlined in the corresponding sections of this chapter.
Patients with nontraumatic pericardial effusions are more difficult to identify because clinical signs and symptoms are inconsistent. Most patients with clinically significant pericardial effusions have nonspecific symptoms such as tachycardia, dyspnea, chest pain, cough, or fatigue.140–144 Since cardiac tamponade can develop rapidly, even in those with chronic pericardial effusion, it is prudent to make the diagnosis as early as possible. Table 6-2 lists the disease processes that place patients at risk of pericardial effusion.142,145 Effusions associated with neoplastic disease or bacterial, fungal, or HIV infections have a higher risk of progressing to tamponade.145 In addition, patients who have had recent catheter-based cardiac procedures, like coronary angiography or pacemaker/defibrillator placement, or cardiothoracic surgery, are at increased risk of a pericardial effusion that progresses to tamponade.143,146
 TABLE 6-2. COMMON CAUSES OF CARDIAC TAMPONADE AND RISK FACTORS
Any patient with a pericardial effusion is at risk of developing cardiac tamponade, which is a life-threatening condition that occurs when a pericardial effusion causes significant compression of the heart leading to a decrease in cardiac output. When a pericardial effusion develops acutely, tamponade can occur with as little as 150 mL of fluid. Because the parietal pericardium can stretch over time, a chronic effusion can have a volume of >1000 mL without causing tamponade. The rate of pericardial fluid accumulation relative to pericardial stretch is the critical factor (Figure 6-2). The steep rise in the pericardial pressure–volume curve makes tamponade a “last-drop” phenomenon; the last few milliliters of fluid accumulation produce critical cardiac compression and the first milliliters of drainage produce the largest relative decompression.142,145 Cardiac tamponade can present with nonspecific signs and symptoms and rapidly progress to hypotension, PEA, and death if not rapidly diagnosed and treated.140–144,147 Echocardiography is the best imaging modality to evaluate for pericardial effusion or tamponade.74,144,146,148 In addition, ultrasound-guided pericardiocentesis is the gold standard for percutaneous drainage of significant pericardial effusions (see Chapter 8, “Critical Care” and Chapter 22, “Additional Ultrasound-Guided Procedures”).144,146,148
Figure 6-2. Physiology of cardiac tamponade. Pressure–volume curves in rapid and slow effusions in cardiac tamponade. (A) In cases of rapid accumulation of pericardial fluid, the cardiac reserve (the initial flat segment on the curve) is quickly exceeded and pressure thereafter rises with small increases in pericardial fluid. (B) When a pericardial effusion occurs gradually, the pericardium is able to adapt and stretch; with time, however, the limit of pericardial stretch is met and additional fluid accumulation results in increasing intrapericardial pressure. (Reprinted with permission from Ariyarajah V, Spodick DH. Cardiac tamponade revisited: A postmortem look at a cautionary case. Tex Heart Inst J 34:347–351, 2007.)
Pericardial effusions are often asymptomatic or associated with nonspecific symptoms. One study evaluated bedside echocardiography on 103 patients with unexplained dyspnea and found that 14 had pericardial effusions. Four had large effusions requiring pericardiocentesis and three had moderate-sized effusions that were treated conservatively. The authors recommended that ED patients with unexplained dyspnea should be evaluated for pericardial effusion.6 Another study evaluated the accuracy of bedside echocardiography performed by emergency physicians to detect pericardial effusions. High-risk symptoms included unexplained hypotension or dyspnea, congestive heart failure, cancer, uremia, lupus, or pericarditis. They found 103 pericardial effusions in this high-risk population and determined that bedside echocardiography by emergency physicians was 97.5% accurate for making this diagnosis.40
Historically, the diagnosis of tamponade is a clinical diagnosis based on symptoms and physical exam findings.142 However, symptoms and physical exam findings of cardiac tamponade are variable.149 Pulsus paradoxus may be the most useful sign, but is not perfectly accurate for making the diagnosis. Pulsus paradoxus may be absent in patients with tamponade who also have left ventricular dysfunction and intubated patients who are receiving positive pressure ventilation.150 Patients with loculated pericardial effusions may develop regional tamponade of the left ventricle. This tends to occur following cardiac surgery, does not result in pulsus paradoxus, and may be missed by point-of-care ultrasound if multiple cardiac views are not assessed.23 In addition, pulsus paradoxus may be present in patients with emphysema in the absence of tamponade.150 Therefore, physical exam findings of tamponade are often misleading and may be inadequate for making decisions regarding intervention. Both physical exam and echocardiographic signs need to be considered when making the diagnosis of tamponade (Table 6-3).
 TABLE 6-3. ECHOCARDIOGRAPHIC SIGNS OF CARDIAC TAMPONADE46,150
• Abnormal respiratory changes in ventricular dimensions
• Right atrial compression
• Right ventricular diastolic collapse
• Abnormal respiratory variation in tricuspid and mitral flow velocities
• Dilated IVC with lack of inspiratory collapse
• Left atrial compression
• Left ventricular diastolic compression
• Swinging heart
Most nonhemorrhagic pericardial effusions that cause tamponade are moderate to large (300–600 mL) in size.142 Therefore, an indication for emergent pericardiocentesis is the finding of a moderate or large effusion in a patient with clinical signs of tamponade. Large pericardial effusions surround the entire heart while small effusions may collect first around the more dependent, mobile ventricles.57 Effusions can be categorized by the maximal width of the anechoic pericardial stripe. A stripe <10 mm is small, 10–15 mm is moderate, and >15 mm is large.6 These are gross measurements and do not correlate perfectly to the volume of the effusion. Also, hemorrhagic effusions can occur outside the setting of trauma and tend to accumulate rapidly and cause tamponade even when they are small.
MASSIVE PULMONARY EMBOLISM
It is estimated that there are 300,000–600,000 cases of deep vein thrombosis (DVT) or PE each year in the United States.151 In 25% of patients with DVT or PE there are no symptoms prior to cardiac arrest, and PE accounts for 60,000–100,000 deaths per year.152 Patients who are hemodynamically stable at the time of PE diagnosis have a good prognosis, but those with a massive PE with hemodynamic compromise have a mortality rate of 25–50%.153 Patients who present in extremis require rapid intervention since 70% of patients who die from PE do so within the first hour. Early thrombolytic therapy or embolectomy is required and rapid treatment often precludes obtaining time-consuming imaging studies.154–161
Bedside echocardiography can be used to rapidly confirm or refute the diagnosis of massive PE and shorten the time between patient presentation and treatment.26,32,39,135 The echocardiographic findings in massive PE are not subtle and include massive right ventricular dilatation and right-sided heart failure with a small, vigorously contracting left ventricle (Figure 6-3).38 In some cases, thrombus can actually be seen in the right atrium or ventricle. Point-of-care ultrasound can also help point to an alternative diagnoses in patients with symptoms that mimic PE, such as cardiac tamponade, pneumothorax, or left ventricular dysfunction.74 It is important to understand that patients may have other underlying diseases that cause chronic right-sided heart strain, thus making the diagnosis of acute cor pulmonale in these patients difficult and unreliable.162
Figure 6-3. Massive pulmonary embolism. Apical view (centered over RV apex) shows severely decompensated right ventricle that is round in shape and much larger than the left ventricle. RV = right ventricle, LV = left ventricle. (Courtesy of Hennepin County Medical Center)
In patients with a high pretest probability of PE, ultrasound findings of overt right ventricular failure clinch the diagnosis and put the patient into a high-risk group that may benefit from thrombolytic therapy or surgical embolectomy.163,164 Patients with massive PE often present with syncope, hypotension, cardiogenic shock, and cardiac arrest. The 2008 American College of Chest Physicians (ACCP) evidence-based clinical practice guidelines recommend fibrinolysis (Grade 1B evidence) for patients with acute PE and hemodynamic compromise.165 They also warn that delaying fibrinolytic therapy may result in irreversible cardiogenic shock.165 Investigators who performed a randomized trial of thrombolytic therapy for massive PE stopped their study early due to ethical concerns after enrolling only eight patients. Four patients who received streptokinase and heparin lived and did not have significant pulmonary hypertension on 2-year follow-up. All four patients treated with heparin alone died within 3 hours after arrival to the ED.166
The management of hemodynamically stable PE with echocardiographic findings of severe right ventricular failure (submassive PE) is controversial.167 Although the ACCP guidelines recommend against thrombolytic therapy in patients with submassive PE, they note that thrombolytics are an option (Grade 2B evidence) for normotensive patients with an acute PE and right ventricular dysfunction who have a low risk of bleeding. The key point is that patients with echocardiographic findings of overt right heart failure have a massive clot burden and are at very high risk of death, regardless of whether they are hypotensive. A prospective study of 200 patients with submassive PE found that those treated with thrombolytic therapy had a much lower incidence of severe pulmonary hypertension 6 months after treatment.
There is good evidence that surgical embolectomy in patients with massive and submassive PE reduces mortality.163,168–171 The drawback of surgical embolectomy is that it requires mobilization of significant-resources and is not an option at most institutions. If surgical embolectomy is an option, point-of-care cardiac ultrasound is important for making a rapid diagnosis, so that resources can be quickly mobilized before the patient develops irreversible heart failure.
The use of bedside echocardiography to diagnose massive PE should not be confused with using echocardiography to evaluate stable patients suspected of having PE. There is a wealth of data demonstrating that echocardiography has poor accuracy when used to rule out PE in stable patients without severe symptoms or hemodynamic compromise.172,173
ASSESSMENT OF LEFT VENTRICULAR STRUCTURE AND FUNCTION
Echocardiography is the preferred first-line test for patients with symptoms or signs consistent with left ventricular dysfunction.174 Patients who present with nonspecific complaints may have unexpected left ventricular failure. More than half of patients with moderate-to-severe diastolic or systolic dysfunction have never been diagnosed with heart failure.119 Patients with moderate-to-severe left ventricular dysfunction are at higher risk of complications regardless of their presentation.119,175 In addition, when patients present with cardiogenic shock both short- and long-term mortality correlate with the degree of initial left ventricular systolic dysfunction and the degree of mitral regurgitation.176
Simple visual estimation of left ventricular ejection fraction is a reliable method of determining left ventricular systolic function.177–179 Several studies have demonstrated that emergency physicians can use visual estimation to accurately assess left ventricular ejection fraction, even with as little as 3 hours of training.44,52,73,90,101,180–182 It has been suggested that bedside echocardiography could be used to differentiate patients with primary pump failure from those with other potential causes of hypotension.92
One study showed that emergency physicians can reliably use qualitative visual estimates to assess left ventricular systolic function in hypotensive ED patients.73 They compared their visual estimates of left ventricular ejection fraction to measurement of fractional shortening, which is known to be a reliable method for assessment of left ventricular systolic function, and found good agreement. They also showed that their fractional shortening measurements and their visual estimates of systolic function were reproducible on serial exams.
In addition to visual estimation, there are several techniques that can be used to obtain quantitative measurements of left ventricle function. E-point septal separation (EPSS) and fractional shortening are simple measurements that can be obtained quickly. Measurement of left ventricular volumes by the biplane method of discs or calculation of stroke volume and cardiac output by measuring Doppler flow through the LVOT are more complex techniques and require advanced training.
EPSS is a simple and rapid measurement that reliably estimates left ventricular function (Figure 6-4).67,183–185 A 2011 study showed that emergency physicians with limited echocardiography experience could obtain measurements of EPSS in acutely dyspneic patients.67 These measurements correlated closely with visual estimates of left ventricular ejection fraction by clinicians with extensive echocardiography experience. In general, EPSS >7 mm indicates left ventricular dysfunction, and EPSS >13 mm indicates severe dysfunction.67,183,186,187 EPSS can reliably estimate left ventricular function in patients with aortic stenosis, but is usually misleading in patients with significant mitral stenosis or aortic regurgitation.184
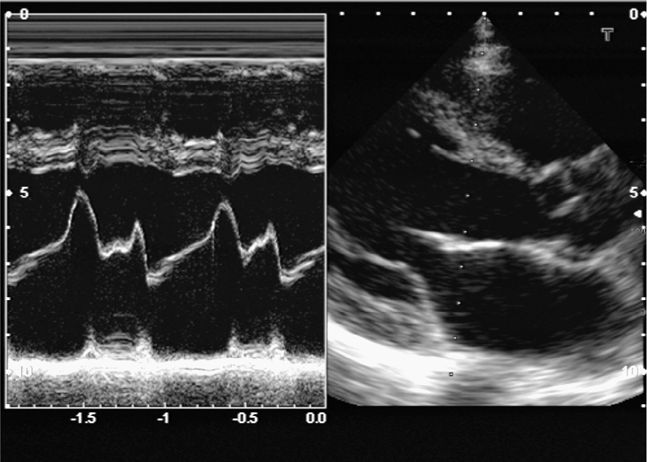
Figure 6-4. E-point septal separation (EPSS). EPSS is the distance between the anterior leaflet of the mitral valve and the septum during passive filling of the left ventricle. Decreased left ventricular function causes decreased valve opening and increased EPSS. EPSS is ≤6 mm if left ventricular function is normal. (See sections “Two-Dimensional Measurements,” “M-Mode,” Figure 6-33 for more details).
Fractional shortening is a simple technique for assessing cardiac contractility based on one-dimensional (1D) measurements of the left ventricle during diastole and systole. Measurements of the left ventricular end-diastolic diameter (LVEDD) and end-systolic diameter (LVESD) with M-mode at the level of the papillary muscles are guided by 2D parasternal long-or short-axis images to calculate fractional shortening (FS) = (LVEDD-LVESD) LVEDD.52,73,188 Measurement of FS by emergency physicians has been shown to be reproducible and accurate compared with cardiology overreads.52,73
Fractional shortening should not be confused with ejection fraction. A normal value for fractional shortening is >25%, whereas a normal left ventricular ejection fraction is >55%.189 Also, fractional shortening <15% is consistent with severe left ventricular of <30%.189 Most modern ultrasound machines can calculate left ventricular ejection fraction when fractional shortening is measured. These calculations assume that the left ventricle has a “normal” shape and symmetrical function, so this method of determining left ventricular ejection fraction may be inaccurate in patients with regional wall motion abnormalities or oddly shaped ventricles. This method can also be inaccurate if the M-mode cursor is not exactly perpendicular to the septum and posterior wall.
The optimal method to measure left ventricular ejection fraction is using the method of discs (modified Simpson’s rule).189 This involves tracing the endocardial border during diastole and systole, so that the computer can calculate the change in left ventricular volume. It is most accurate if measurements are performed in two orthogonal planes (apical four-chamber and apical two-chamber views), which is known as the biplane method of discs.189 Some modern ultrasound machines can calculate the left ventricular ejection fraction from one plane (usually the apical four-chamber view), which may be more practical in the point-of-care setting.
Calculation of left ventricular ejection fraction by the method of discs will be inaccurate if true apical views are not obtained and foreshortened (oblique) views of the left ventricle are measured. Also, it is often difficult to visualize the endocardial border, even if good images are obtained. Many echocardiography labs routinely use contrast agents to improve endocardial border detection. Contrast echocardiography significantly improves the accuracy and reproducibility of measuring left ventricular ejection fraction.190,191 Contrast is especially useful in obese patients and those with lung disease.192 This has not been well studied in the setting of clinician-performed focused cardiac ultrasound, but it has been found in ICU patients that the left ventricular ejection fraction was uninterpretable on 23% of exams using standard echocardiography, 13% using harmonic echocardiography, and 0% with contrast echocardiography (Figure 6-5).191
Figure 6-5. Contrast echocardiography. These images show apical views of the left ventricle before (left image) and after infusion (right image) of an IV contrast agent (Definity). The improved visualization of the endocardial border, left ventricle cavity, and myocardium is striking. Contrast echocardiography is especially important in critically ill patients, so that the greatest amount of information can be obtained when conditions (positioning, equipment, personnel) are suboptimal.
It is important to realize that fractional shortening and left ventricular ejection fraction are measurements of left ventricular dimension variation and not measurements of stroke volume and cardiac output. Patients with significant mitral regurgitation may have a hypercontractile left ventricle but a very low cardiac output, and patients with dilated cardiomyopathy may have a good stroke volume despite a low ejection fraction. When these clinical conditions are known or suspected it may be reasonable to correlate left ventricular ejection fraction with measurements of stroke volume. Stroke volume can be measured by obtaining two variables: (1) the area of the LVOT and (2) the velocity time integral (VTI) of the flow through the aortic valve during systole. Measuring stroke volume and cardiac output is not a routine part of point-of-care ultrasound, but it is not difficult for practitioners who have learned to obtain the standard echocardiographic views.
Although significant left ventricle systolic dysfunction (left ventricular ejection fraction <30%) is usually obvious in cases of cardiogenic shock and severe heart failure, it is important to understand that cardiac function includes more than just left ventricular contractility. Left ventricular ejection fraction may not be a good indicator of cardiac output in patients with aortic stenosis, mitral regurgitation, and concentric left ventricular hypertrophy (LVH).193 Also, isolated left ventricular diastolic dysfunction is a significant cause of heart failure. Approximately 50% of patients with overt congestive heart failure have isolated left ventricular diastolic dysfunction, with normal left ventricular systolic function.119,194,195
Assessing for diastolic dysfunction usually requires Doppler measurements and was previously considered an advanced cardiac ultrasound skill. However, a 2010 study showed that emergency physicians with limited training could rapidly and accurately use pulsed Doppler to evaluate diastolic function in patients presenting with acute dyspnea.48 The investigators performed simple Doppler measurements of transmitral velocity and noted whether a restrictive filling pattern was present or absent. They found that a restrictive filling pattern was more sensitive and specific than visual estimation of reduced left ventricular ejection fraction, the Boston criteria, or N-terminal prohormone brain natriuretic peptide for identification of left ventricular heart failure.
A complete assessment of left ventricular diastolic function and filling pressures requires a combination of pulsed Doppler transmitral and tissue Doppler mitral annular measurements.194,196–199 This is not difficult to learn and may be reasonable for emergency physicians with significant ultrasound experience.45,200 Using pulsed Doppler to assess for simple indices, such as transmitral peak E velocity alone, may allow less experienced clinicians to assess for elevated filling pressures associated with diastolic heart failure.201 Also, simple M-mode measurement of left atrial emptying fraction may be a practical technique for determining diastolic dysfunction.202
Left atrial enlargement (LAE) is an important marker of left-sided heart disease and a strong predictor of congestive heart failure, hospitalization, stroke, and mortality.189,203–206 LAE is usually the result of elevated filling pressures caused by left ventricular diastolic dysfunction, but can also be caused by volume overload from valvular regurgitation and high output states like chronic anemia.189,207–210 LAE may be obvious on multiple cardiac views and can be quickly confirmed by measuring the end-systolic atrial diameter in the parasternal long-axis view. If this measurement is >4 cm or significantly larger than the proximal aortic diameter, then LAE is likely (Figure 6-6).183,189,211–219 A single-plane area can also be measured, but the optimal way to evaluate for LAE is measurement of left atrial volume using the biplane area-length method or the Simpson’s method of discs.189,220
Figure 6-6. (A) Left ventricular hypertrophy, parasternal long-axis views. The septum (1.48 cm) and the posterior wall (1.95 cm) are >12 mm when measured during diastole. (B) Left atrial enlargement. Measurement of the aorta and left atrial dimension (Ao/LA=2.7/4.9) in a patient with left atrial enlargement (LA >4 cm).
LVH is an important finding and there is a strong correlation between ultrasound measurements of left ventricular mass and subsequent coronary artery disease, sudden death, and other adverse clinical events.221–224 The sensitivity of ECG for LVH is poor and does not detect the majority of cases.221,225,226 Concentric LVH, an increase in wall thickness with normal chamber size, is usually the result of pressure overload from systemic hypertension. Eccentric hypertrophy, chamber enlargement with relatively normal wall thickness, is more common in patients with volume overload from regurgitant valvular lesions.227 Left ventricular mass can be determined by more complicated methods or by simple measurements in the parasternal long-axis view plotted on a nomogram.228,229 Normal left ventricular mass is variable depending on patient size and sex, but in general left ventricular internal chamber diameter >5.5–6.0 cm or wall thickness ≥ 12 mm, measured at the end of diastole, is suggestive of LVH (Figure 6-6).189,212,214,218,219,229
VOLUME STATUS AND FLUID RESPONSIVENESS
Fluid therapy is a critical part of shock management, especially in sepsis. Aggressive early fluid resuscitation is encouraged and appropriate in most cases.230 However, not all patients benefit from aggressive fluid resuscitation and there is growing evidence that fluid overload may increase morbidity and mortality.82,110,231–236 Therefore, it is best to give fluid in a goal-directed manner using some objective parameters to help guide therapy.237,238 Point-of-care ultrasound is one of many tools that can be used to guide fluid therapy in shock because it allows a rapid noninvasive estimate of intravascular volume status and a prediction of fluid responsiveness.76,79,93,113,238–241 In addition to guiding fluid management decisions in septic shock, ultrasound assessment of intravascular volume can be used in a variety of other clinical settings, such as hemodialysis, pediatric dehydration, trauma, and heart failure.9,17,37,42,238,242–250
Estimating central venous pressure (CVP) with point-of-care ultrasound is important because historically cardiac filling pressures [CVP and pulmonary capillary wedge pressure (PCWP)] were the clinical gold standard for determining volume status and guiding fluid resuscitation. The current guidelines for the Surviving Sepsis Campaign suggest fluid resuscitation based on CVP as well as central venous oxygen saturation.251 The use of ultrasound to estimate CVP in the acute care setting, where invasive monitoring is not convenient or possible, has been one of the most important applications of point-of-care ultrasound.3,57,58,73,74
Despite the widespread use of CVP monitoring, there is significant data showing that cardiac filling pressures (CVP and PCWP) are relatively poor predictors of fluid responsiveness.107,233,252–260 Fluid responsiveness is a relatively new concept that describes a positive hemodynamic response (increase in cardiac output) to fluid therapy.76,79,93,233,237–239 The standard definition of fluid responsiveness is a >15% increase in cardiac output with a fluid bolus (500–1000 mL).240 This concept is important because not all patients who are in shock benefit from aggressive fluid therapy and several studies demonstrate that fluid overload can lead to increased morbidity and mortality.110,231,232,234–236,241 Fluid responsiveness can be predicted by measuring variations in IVC size or by assessing changes in cardiac output with the respiratory cycle or passive leg raising. Finally, an assessment of the left ventricular function and size can be used to estimate intravascular volume and the need for fluid therapy. Hyperdynamic cardiac function, small left ventricular end-diastolic area or left ventricular systolic collapse are reliable predictors of hypovolemia.79,261
Inferior Vena Cava Size and Degree of Collapse to Estimate CVP and Volume Status
The size and the magnitude of respiratory variations in the IVC correlate with CVP (Table 6-4).58,64,266,262,267–269,263,270–277 In spontaneously breathing (nonintubated) patients with a normal CVP (<10 mm Hg), the IVC collapses significantly (≥50%) with passive inspiration. IVC diameter (during expiration) is generally large (>2 cm) in patients with elevated CVP (>15 mm Hg) and small (<1 cm) in patients who are hypovolemic.47,85,248,262,263,276,278,279

The utility of using IVC indices to estimate CVP in mechanically ventilated patients is controversial.277 With mechanical ventilation, the IVC is typically less dynamic and does not exhibit significant variation with the respiratory cycle. However, a small IVC diameter (<10 mm) reliably predicts a low CVP.64,85,246,248,249,279
IVC diameter and degree of collapse correlate with volume status in the setting of hemorrhagic shock, heart failure, acute dehydration, and pre- and post-hemodialysis.37,85,86,242,246,248,249 One study found that the IVC diameter was a better predictor of recurrent shock than blood pressure, heart rate, or arterial base excess.246 Another study concluded that IVC diameter was a more accurate predictor of shock than the shock index and other commonly used noninvasive predictors of blood loss.
In the setting of hemodialysis, ultrasound assessment of the IVC has been used to help evaluate intravascular fluid volume and optimize dry weight.245,247,250,280 One study found that IVCe ≤8 mm and collapsibility ≥90% was consistent with optimal dry weight and that IVCe ≥22 mm and collapsibility ≤10% were warnings of fluid overload. Another study found that lowering the dry weight so that interdialytic IVCe was <16 mm improved volume overload and cardiac function.
In the setting of acute dyspnea, IVC measurements can be used to help support the diagnosis of heart failure. In one study of ED patients presenting with acute dyspnea, IVC collapsibility of <33% had a sensitivity of 80% (but poor specificity) for the diagnosis of acute heart failure. IVC collapsibility of <15% and an IVC diameter to aorta diameter (IVC/aorta) ratio >1.2 were both highly specific for the diagnosis of acute heart failure (both 96% specific).42
IVC/aorta ratio is also used in pediatrics because it is thought to be a more valid measurement of IVC size that is independent of patient size in smaller patients.17,36,243 The IVCe/aorta ratio may be useful for evaluating significant dehydration in children. One study found that children requiring IV hydration had a mean IVC/aorta ratio of 0.75 compared with a mean of 1.01 for controls. The IVC/aorta ratio increased to a mean of 1.09 after hydration. An IVC/aorta ratio of ≤0.8 has been found to be a relatively good indicator of significant dehydration, with a sensitivity of 86%, but a specificity of only 56%.
All IVC studies are consistent on one point: measurements of size and collapsibility are more accurate at the extremes. A small collapsing IVC is a very reliable indicator of a low CVP, and a very large IVC with no inspiratory collapse is a reliable predictor of elevated CVP. Clinicians should realize that IVC indices are only one piece of evidence and should not be used in isolation, but in combination with calculations of pretest probability and other clinical factors. Also, there are little data on following serial IVC indices, but this is a very useful technique.73 When a patient presents with hypotension, the initial treatment often involves a fluid challenge, and serial monitoring of the IVC can help clinicians evaluate changes in CVP related to fluid therapy. Serial monitoring may also help guide decisions about when to limit fluid therapy. In general, if the IVC remains flat and collapsible, more fluid can be given. When the IVC becomes large and noncollapsible, it may be wise to limit fluid or consider implementing other monitoring techniques.
There are certain clinical situations in which assessing IVC size and collapsibility may be confusing or misleading. In patients with right heart failure, the IVC may be large and poorly collapsible despite intravascular volume depletion. Therefore, it is worthwhile to reiterate that ultrasound measurement of IVC indices is not perfect and should not be used in isolation, but in combination with the clinical exam and ultrasound assessment of cardiac function.
IVC Distensibility to Predict Fluid Responsiveness in Mechanically Ventilated Patients
In mechanically ventilated patients, the changes in IVC diameter during the respiratory cycle are opposite of the changes during spontaneous breathing. The IVC does not collapse but distends during insufflation, as venous return decreases and the volume of extrathoracic venous blood increases.82 Also, variations in IVC diameter are much smaller during mechanical ventilation than with spontaneous breathing. However, if the magnitude of distention is carefully measured using M-mode ultrasound, it can be used to accurately predict fluid responsiveness.
Using IVC measurements at different times throughout the respiratory cycle, one study calculated the distensibility index, which reflects the increase in IVC diameter with mechanical insufflation. Distensibility index (dIVC) = IVCmax – IVCmin/IVCmin × 100%. The dIVC was measured before and after a 7 mL/kg volume expansion by a plasma expander. Cardiac index (CI) was also calculated from aortic Doppler measurements before and after volume expansion, and fluid responsiveness was defined as an increase in CI. The study found that dIVC >18% was an accurate predictor of fluid responsiveness (sensitivity 90%, specificity 90%) and baseline CVP was a poor predictor of fluid responsiveness. Another study calculated distensibility index as dIVC = IVCmax – IVCmin / IVCmean and found that dIVC >12% was an accurate predictor of fluid responsiveness (positive predictive value 93%, negative predictive value 92%).82
Measuring IVC distensibility to predict fluid responsiveness has several limitations. It is only reliable with mechanically ventilated patients who are perfectly synchronized to the ventilator (or paralyzed). The patient must be receiving a tidal volume of at least 8–10 mL/kg with positive pressure ventilation. Also, the patient must be in sinus rhythm and cannot have significant right-sided heart failure.
Respiratory Variation in Stroke Volume, Aortic Flow Velocity, and Arterial Peak Velocity to Predict Fluid Responsiveness in Mechanically Ventilated Patients
Intermittent positive pressure ventilation induces cyclic changes in left ventricular stroke volume, resulting in maximum stroke volume during mechanical insufflation and minimum stroke volume during exhalation.281 The magnitude of respiratory changes in stroke volume is an indicator of biventricular preload dependence and a strong predictor of fluid responsiveness.233,238,239,281 Respiratory variation in aortic flow velocity and pulse pressure accurately reflects the magnitude of stroke volume variation, so measurement of these indices can also reliably predict fluid responsiveness.233,254,256,282 Transthoracic ultrasound or TEE can be used to measure stroke volume variation and aortic flow velocity variation.83,100,283–285 In addition, point-of-care ultrasound can be used to measure peripheral artery peak velocity variation.286,287
There are some important limitations to using respiratory variations in stroke volume and aortic flow velocity to predict fluid responsiveness. The patient must be mechanically ventilated and perfectly synchronized with the ventilator (or paralyzed). They must be receiving positive pressure ventilation with a tidal volume of at least 8–10 mL/kg.288,289 Finally, analysis of respiratory changes in stroke volume is not possible in patients with cardiac arrhythmias, so patients must be in sinus rhythm.281
Changes in Stroke Volume with Passive Leg Raising for Prediction of Fluid Responsiveness in Spontaneously Breathing and Mechanically Ventilated Patients
Passive leg raising allows reliable prediction of fluid responsiveness regardless of ventilation mode or cardiac rhythm.290–293 Passive straight leg raising essentially employs an endogenous fluid challenge by effectively increasing central blood volume and filling pressures.291 Several studies show that echocardiographic measurement of stroke volume before and after passive straight leg raising enables reliable prediction of fluid responsiveness (Figure 6-7).100,102,294–296 A meta-analysis by Cavallaro et al. found that patients who had an increase in stroke volume (or cardiac output) of ≥18% with passive leg raising were fluid responsive, with a sensitivity of 89% and a sensitivity of 91%.290 In addition, point-of-care ultrasound can be used to measure changes in peripheral artery peak velocity with passive straight leg raising.297
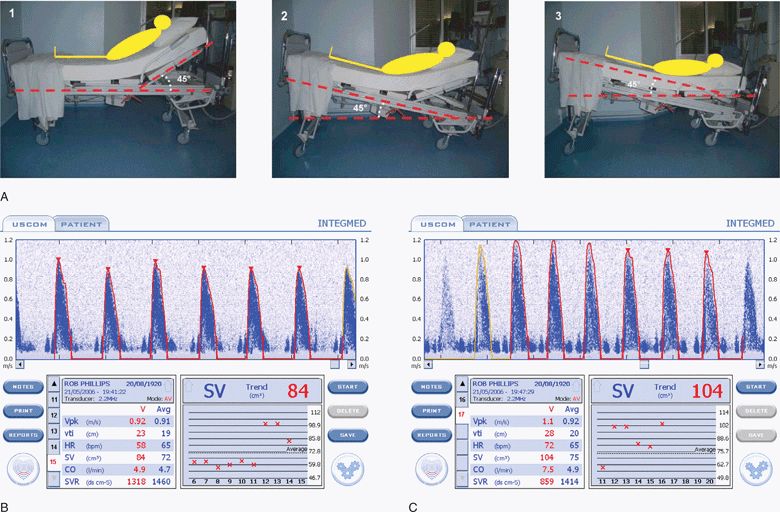
Figure 6-7. (A) The passive leg raising maneuver in three steps: Step 1, at baseline the patient is laying in a semirecumbent position, the trunk of the patient at 45° up to the horizontal; Step 2, the entire bed is pivoted to obtain a head down tilt at 45°; and Step 3, the head of the bed is adjusted to obtain a strictly horizontal trunk. Stroke volume is measured with an ultrasonic cardiac output monitor (USCOM, Sydney, Australia) before (B) and after (C) the passive leg raising maneuver and shows a 21% increase in stroke volume (from 84 to 104) after leg raising, which accurately predicts fluid responsiveness.290,296 A standard ultrasound machine with a sector transducer and spectral Doppler can also be used to measure stroke volume (or aortic blood velocity) before and after passive leg raising. (A: Reproduced with permission from Levitov A, Mayo P, Slonim A. Critical care ultrasonography. New York, NY: McGraw-Hill, 2009. B,C: Reproduced with permission from Rob Phillips, Uscom, Ltd. http://www.uscom.com.au)
Assessment of the Left Ventricle to Estimate Volume Status and Predict Fluid Responsiveness
Hyperdynamic left ventricular function is often seen in hypotensive patients and is generally considered an indicator of hypovolemia. Bedside cardiac ultrasound with a subjective assessment of hyperdynamic cardiac function and left ventricular systolic collapse has been found to be a better indicator of hypovolemia than CVP.261 The presence of a hyperdynamic left ventricle in patients with nontraumatic undifferentiated hypotension has been demonstrated to be highly specific for sepsis as the etiology of shock.33 A hyperdynamic left ventricle has been defined as “near or complete obliteration of the left ventricular cavity,” meaning that the endocardial surfaces of the septum and posterior wall come in close contact with each other.73 The presence of tachycardia is not a factor in making this assessment. Visual evaluation of hypercontractile left ventricular performance predicts volume responsiveness after cardiac arrest with 71–100% sensitivity.87
Left ventricular volume and end-diastolic area correlate with preload and can be assessed to help guide fluid therapy.298 Left ventricular end-diastolic area is a reliable indicator of significant hypovolemia.299–302 Subjective evaluation of left ventricular volume by assessing the size of the left ventricular cavity in the short- and long-axis views is often adequate to guide fluid therapy at the extremes of cardiac filling and function.79 Also, significant volume depletion can be recognized by assessing left ventricular volume and end-diastolic area with a single measurement of left ventricular cross-sectional area. This is measured by tracing the endocardial border at end-diastole on a short-axis view at the level of the midpapillary muscles. A left ventricular cross-sectional area value of <10 cm2 generally indicates hypovolemia (Figure 6-8A).79,189 Also, a subjective but reliable indicator of hypovolemia is the “kissing papillary muscle sign,” found to be 100% sensitive for detecting hypovolemia but only 30% specific for predicting volume responsiveness.303 It is important to note that the finding of a large left ventricular area or volume should be interpreted with caution because it does not necessarily indicate adequate filling pressure (preload) in hypotensive patients with left ventricular dysfunction.
Figure 6-8. Severe hypovolemia, parasternal short-axis view. (A) Small LV cross-sectional area (<10 cm2) in diastole, and complete obliteration of the left ventricular chamber in systole (B).
Related posts:
Stay updated, free articles. Join our Telegram channel

Full access? Get Clinical Tree


