
Imaging Muscle
Ultrasound provides high-resolution images of muscle and can detect even subtle abnormalities. The dynamic capabilities of ultrasound allow identification of pathology not appreciable with static imaging. Ultrasound allows precise measurement of muscle size and can detect atrophy as well as echotexture changes in muscle disease.
MUSCLE ARCHITECTURE
Muscles are generally more hypoechoic (darker) relative to other tissues such as tendons (Figure 8.1). Knowledge of muscle anatomy is critical for understanding the region scanned because muscle tissue makes up the majority of the image in the limbs. Muscles have characteristic architecture that includes intervening hypoechoic muscle fibers with hyperechoic connective tissue that creates the perimysium. The short-axis view of muscle has been described as a “starry night” appearance. This image is a result of the hyperechoic (bright) connective tissue interspersed between the hypoechoic (dark) muscle fibers (Figure 8.2). Skeletal muscle is made of individual muscle fibers that are grouped in bundles called a fasciculus (Figure 8.3). Muscle fiber diameter is somewhat smaller than the resolution of current high-frequency ultrasound and ranges from approximately 40 to 80 µm.
There are different types of arrangements of skeletal muscles in the limbs. This includes pennate, parallel, convergent, and quadrilateral-shaped muscles (Figure 8.4). Pennate muscles that have many fibers per unit area are arranged into three types: unipennate, bipennate, or multipennate (Figure 8.5). Parallel muscles have fibers that run parallel to each other. When the parallel-shaped muscle bulges in the middle, it is considered fusiform. Convergent muscles have fibers that converge at the insertion (Figure 8.6). Quadrilateral-type muscles have fibers in parallel, and are oriented in the same longitudinal axis as the tendon (Figure 8.7). Examples of quadrilateral-type muscles include the pronator quadratus and quadratus plantae. Familiarity with the different arrangement of muscles improves recognition of the muscle landmarks.
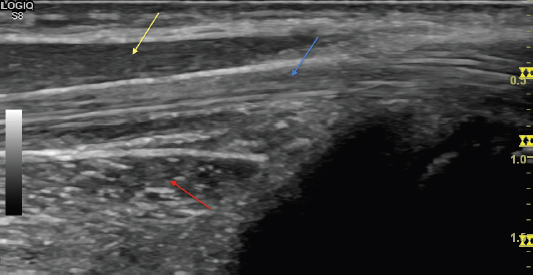
FIGURE 8.1 Sonogram demonstrating the contrast between muscle and tendon. The more hypoechoic (darker) muscle in long axis is demonstrated (yellow arrow) next to the hyperechoic (brighter) tendon in long axis. Note the hypoechoic muscle fibers in relation to the fibrillar architecture of the tendon. Also note the different appearance of muscle oriented in short axis relative to the transducer (red arrow).
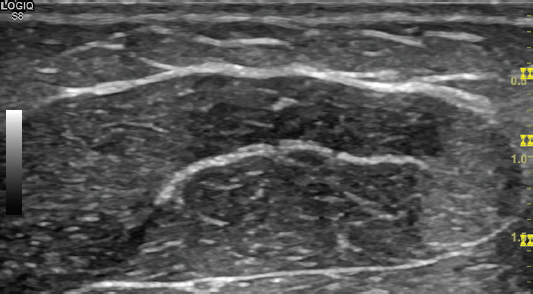
FIGURE 8.2 Sonogram demonstrating the “starry night” appearance of muscle in short axis with intervening bright perimysium interspersed with darker muscle fibers.
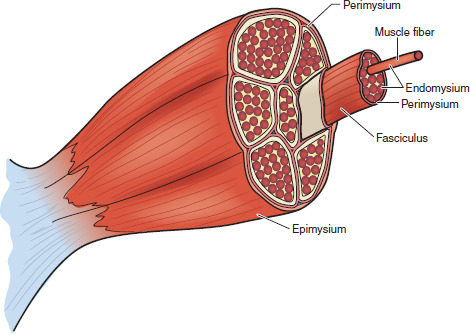
FIGURE 8.3 Illustration of the components of skeletal muscle. The bundle of muscle fibers surrounded by perimysium makes up the fasciculus.
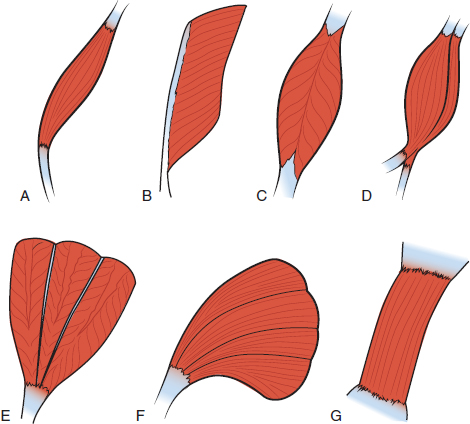
FIGURE 8.4 Illustrations of various muscles types. Shown are parallel (A), unipennate (B), bipennate (C), fusiform (D), multipennate (E), convergent (F), and quadrilateral (G).
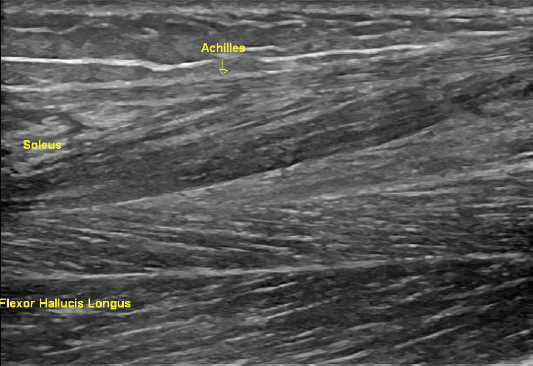
FIGURE 8.5 Sonogram demonstrating the unipennate structure of the soleus inserting on the Achilles tendon. Deep to the bipennate structure of the flexor hallucis longus is shown.
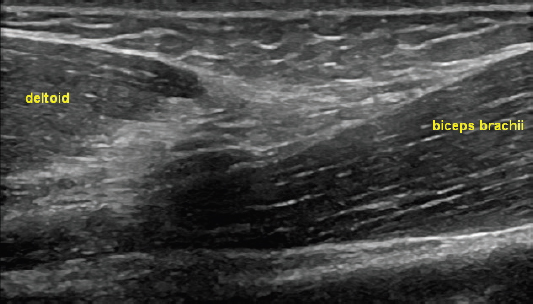
FIGURE 8.6 Sonogram demonstrating a portion of the convergent pattern of the deltoid next to the fusiform pattern of the biceps brachii.
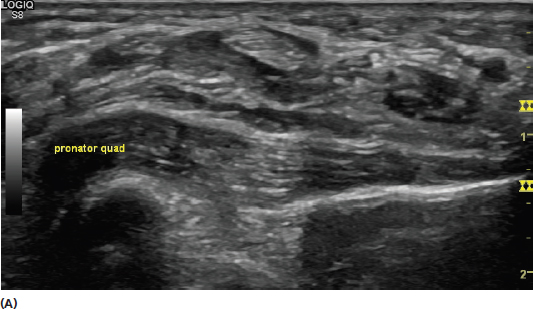
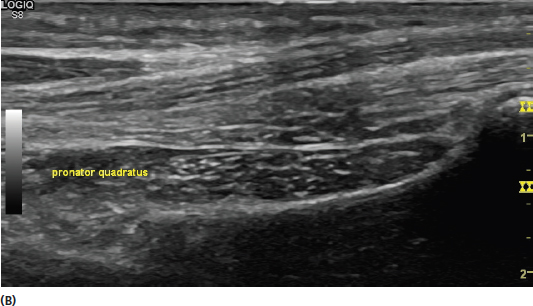
FIGURE 8.7 Sonogram demonstrating the quadrilateral-shaped pronator quadratus in long (A) and short (B) axis.
MUSCLE IMAGING TECHNIQUES
Muscle should be scanned in both short and long axis and sufficient area should be inspected to enable pathology to be spotted when present. The transducer should be placed in the proper plane of short and long axis, rather than obliquely to more readily identify the normal architecture (Figure 8.8). Knowledge of the normal shape and location of insertion and origin of the specific muscle being inspected is critical for appropriate transducer placement.
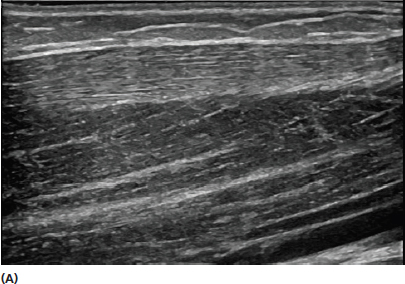
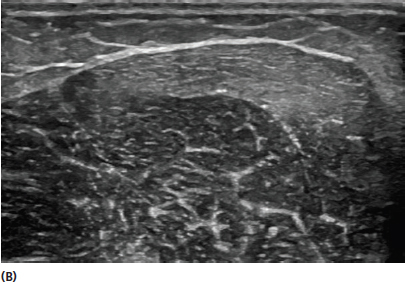
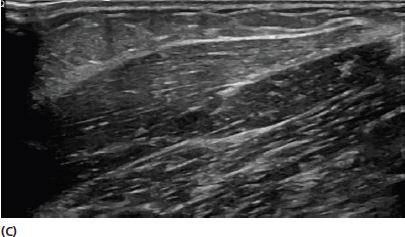
FIGURE 8.8 Sonograms demonstrating the long-axis (A) and short-axis (B) views of the biceps brachii muscle. The normal striations of the muscle are seen in longitudinal view and the cross-sectional architecture is well identified in proper short-axis view. Inspecting the muscle architecture is somewhat more challenging when the transducer is in an oblique position (C) relative to the muscle.
Muscles are generally easier to identify in short-axis view (Figure 8.9). Detailed knowledge of cross-sectional anatomy is necessary for this. Muscles should also generally be followed to the level of their myotendinous junctions, as this is a frequent site of mechanical injury. This is often easier to identify in long axis (Figure 8.10). Use of tendon origins and insertions is also frequently helpful for identification of muscles when needed.
The dynamic capabilities of ultrasound also provide a significant advantage over other imaging modalities for muscle. Muscle movement can be easily seen with ultrasonography. Muscles can be seen to dynamically lengthen with eccentric contraction and shorten and thicken with concentric contraction. This appearance is also dependent upon whether the orientation is in long or short axis.
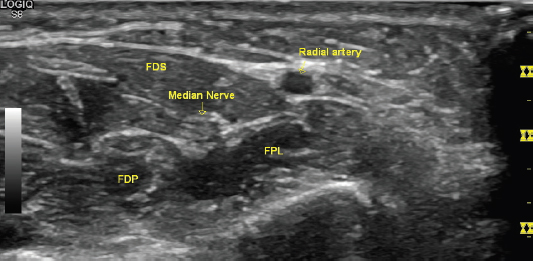
FIGURE 8.9 Sonogram demonstrating a short-axis view of the volar forearm. The short-axis view generally provides the best perspective for locating anatomic landmarks to assist with correctly identifying different muscles. In this view, the flexor digitorum superficialis (FDS), flexor digitorum profundus (FDP), and flexor pollicus longus (FPL) muscles are shown.
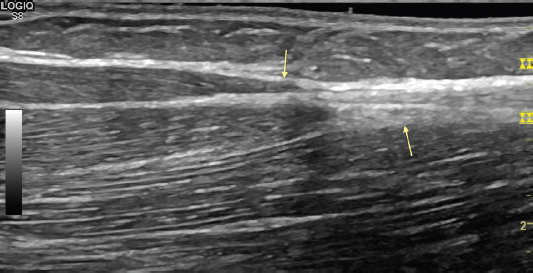
FIGURE 8.10 Sonogram demonstrating a long-axis view of the short and long head of the biceps brachii converging on the more distal tendon. The long-axis view often provides a good perspective when inspecting the myotendinous junction.
MUSCLE PATHOLOGY
Strains
Ultrasound has very good sensitivity for identification of muscle strains. An appropriate history and physical should also be used to assist with localization, however, most muscle strains occur relatively close to the myotendinous junction of the muscle tendon complex (Figure 8.10). Muscles that cross two joints, such as the medial gastrocnemius, rectus femoris, and biceps femoris, are particularly susceptible to injury. Higher grade strains that involve fascia as well as the muscle fibers are easier to identify (Figure 8.11). Lower grade strains that involve only a few muscle fibers require meticulous technique and survey in conjunction with the clinical assessment (Figure 8.12). Muscle strains in general are identified by a disruption of the muscle fibers and normal fibroadipose septa. In acute strains, the injured area typically becomes more hypoechoic (darker) as a result of the infiltration of blood and edema. Confirmation of the abnormality should always be performed in two views (Figure 8.13). Development of the hypoechoic blood and edema infiltration generally takes one to two days after the injury. For this reason, scanning an acute injury too early after onset can have less sensitivity in lower grade injuries. Large hematomas associated with muscle injuries are typically easier to identify and often persist for many weeks (Figure 8.14). More chronic muscle strains can develop fibrotic scarring that manifests as hyperechoic (bright) irregular pattern within the muscle (Figure 8.15).
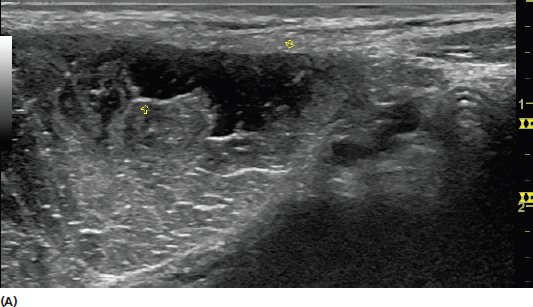
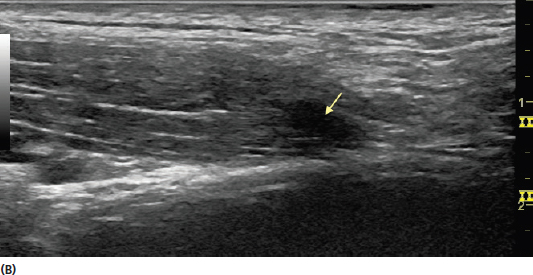
FIGURE 8.11 Sonograms demonstrating a relatively acute and high grade strain of the rectus abdominus in both short-axis view (A) and long-axis view (B). The muscle defect is seen by the hypoechoic (dark) and irregular signal (yellow arrows) where there is loss of the normal muscle echotexture.
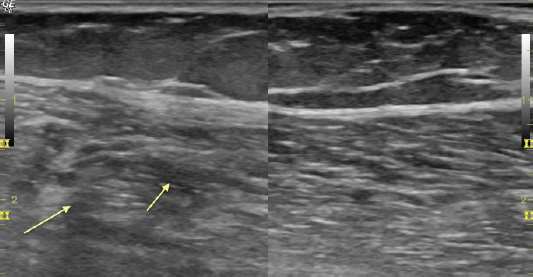
FIGURE 8.12 Sonogram demonstrating an acute relatively low-grade muscle strain (image on the left) in contrast to the unaffected side (image on the right). There is mild disruption of the muscle fibers and normal fibroadipose septa seen with the image on the left (yellow arrows). The change in muscle fiber echotexture is more conspicuous with live dynamic scanning and somewhat harder to detect with still images.
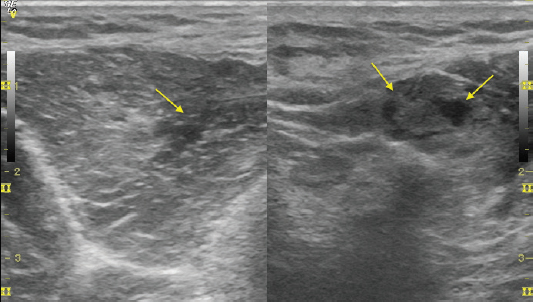
FIGURE 8.13 Sonogram demonstrating an acute latissimus dorsi muscle strain injury in short axis (image on the left) and long axis (image on the right). The strain injury is represented by the hypoechoic (dark) signal and loss of echotexture (yellow arrows). Both short- and long-axis views should always be obtained when assessing tissue injuries of this nature. Frequently one view can be more revealing than the other.
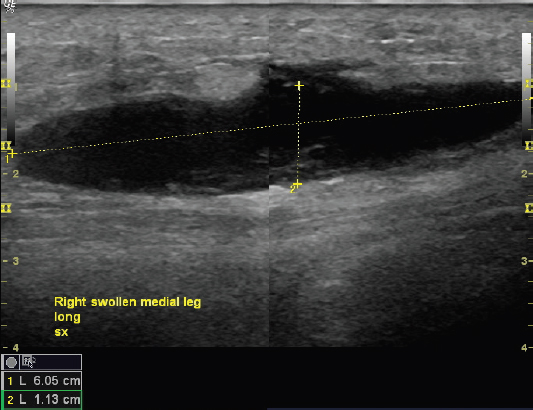
FIGURE 8.14 Sonogram of an approximated split-screen image used to demonstrate a large calf hematoma.
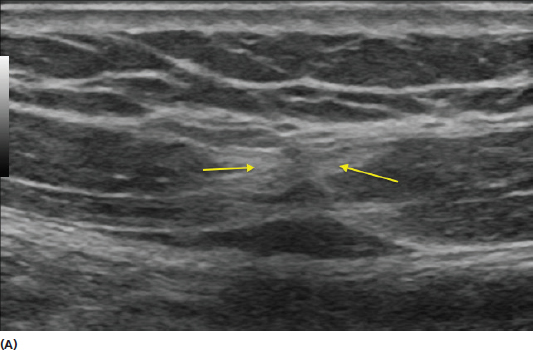
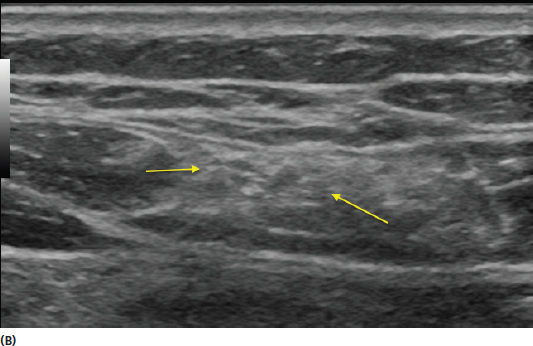
FIGURE 8.15 Sonograms demonstrating chronic scar (yellow arrows) in both long-axis view (A) and short-axis view (B) from a rectus abdominus strain. The scarring appears as irregular hyperechoic (bright) signal that is in stark contrast to the regular echotexture of the more hypoechoic (dark) muscle tissue.
Postsurgical or Traumatic Alteration
External trauma can occur to muscle in multiple ways. This can be from direct contusion or partial or complete muscle laceration. Hematoma can be present after an external injury and is often identified by hypoechoic (dark) or anechoic (black) appearance (Figure 8.14). In laceration injuries, including surgical changes, the injury pattern can typically be followed from the superior portion of the image through the more superficial tissue (Figure 8.16). Detailed history and physical can help tremendously when assessing the implication of the imaging findings in the setting of prior surgery or trauma.
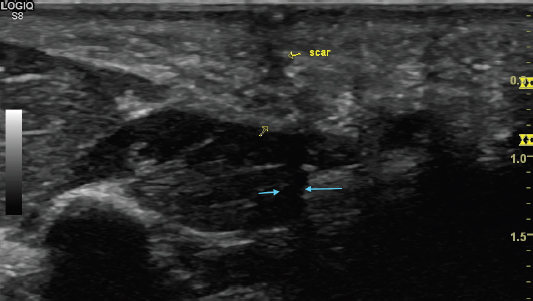
FIGURE 8.16 Sonogram demonstrating the irregular disruption of the muscle fibers (blue arrows). The more superficial tissue scar is also shown (yellow arrows).
Muscle Hernias
Muscle hernias are a focal defect in the muscle fascia that results in a protrusion of muscle through the defect. They can be asymptomatic but also a source of pain. Some seek evaluation for the concerns of a possible mass. Ultrasound is the imaging modality of choice for muscle hernias (Figure 8.17). The examiner should use plenty of conduction gel and only light pressure with the transducer. Hernias are usually more evident when the muscle is under contraction.
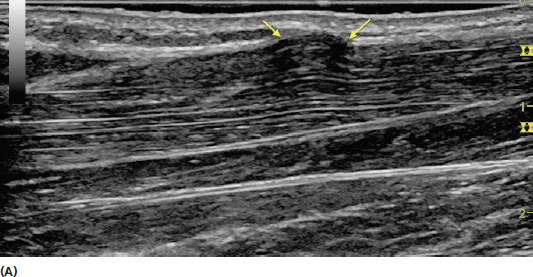
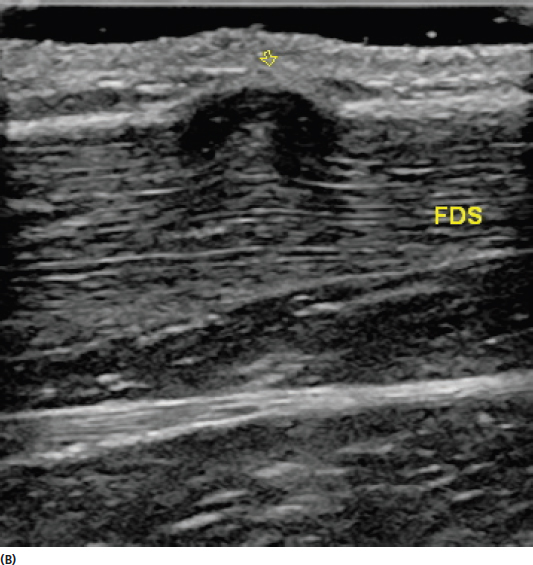
FIGURE 8.17 Sonograms showing a long-axis view of a muscle herniation (yellow arrows). The image in (A) shows the muscle under slight contraction and the image in (B) shows the muscle under a more vigorous contraction.
Denervation
Injury to muscle innervation leads to denervation atrophy. This is seen on ultrasound in more chronic conditions as more hyperechoic (brighter) echotexture as a result of muscle tissue gradually being replaced by fatty tissue (Figure 8.18). It is also an effect of an increased ratio of connective tissue relative to viable muscle fibers. In addition, neurogenic atrophy results in loss of size of the involved muscle (Figure 8.19). Side-to-side comparisons of muscle are often very helpful to assess unilateral peripheral motor nerve injuries (Figure 8.20). The comparisons can provide good perspective on the echotexture changes and precise measurements can be made for comparing the size.
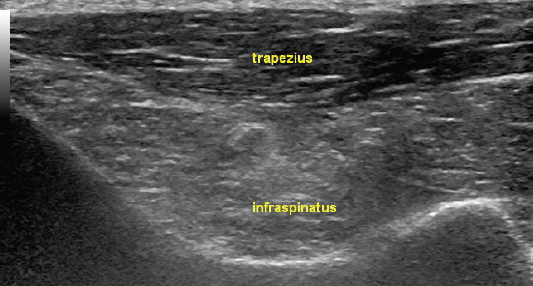
FIGURE 8.18 Sonogram demonstrating the hyperechoic (bright) appearance of an infraspinatus in short axis with denervation from a suprascapular neuropathy. Note the contrast of the normal echotexture of trapezius.
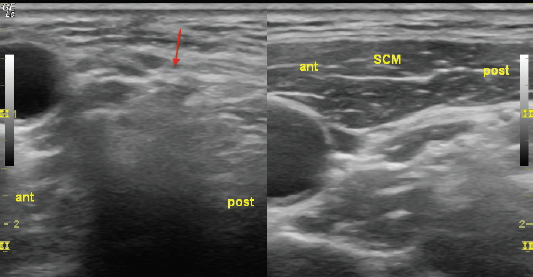
FIGURE 8.19 Sonogram demonstrating a short-axis view of a sternocleidomastoid (SCM) with denervation atrophy (image on the left, red arrow) in contrast to the unaffected side (image on the right). Note that the muscle with denervation has lost its normal muscle echotexture and this has been replaced by hyperechoic (bright) connective tissue.
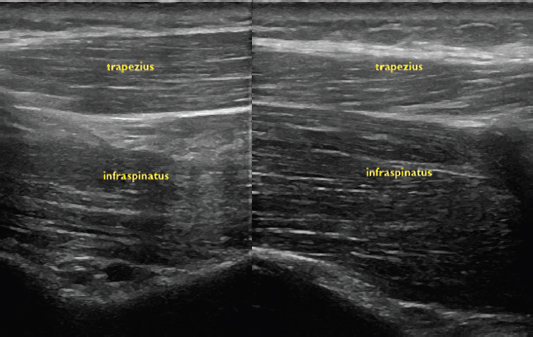
FIGURE 8.20 Sonogram demonstrating a short-axis view of an infraspinatus muscle with partial denervation (image on the left) in contrast with the normal side on the right. In this case, the neuropathy is not severe to the extent that there is complete loss of muscle substance. The use of side-to-side comparisons allows the identification of a more hyperechoic (brighter) appearance of the muscle on the affected side.
Myopathy
Muscle abnormalities are different in most myopathies than in neurogenic denervation. Similar to neurogenic atrophy, the muscle echotexture is generally more hyperechoic (bright) compared to normal muscle (Figure 8.21). This is due to the loss of normal muscle tissue as well as the interposition of fatty tissue, fibrosis and in some circumstances, inflammatory mediators. A difference from neurogenic atrophy is that in myopathy, there is usually relative preservation of muscle size. Most myopathies are generalized and relatively symmetrical so side-to-side comparisons are rarely helpful and the muscle echotexture should generally be compared to an established standard reference when available. Some myopathies have focal areas of relative involvement and sparing, which can be readily distinguished on ultrasound. This makes ultrasound a useful tool for determining areas of involvement, which can help with myopathy identification.
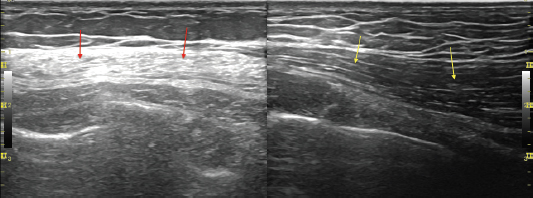
FIGURE 8.21 Split-screen image sonogram demonstrating the difference in muscle echotexture in an individual with fascio-scapular humeral dystrophy (FSH) (image on the left) compared to that seen in an unaffected individual (image on the right). Note the hyperechoic (bright) appearance of the muscle of the individual with FSH (red arrows) relative to the normal comparison (yellow arrows).
Anomolous, Congenitally Absent, and Accessory Muscles
Anomolous, accessory, or congenitally absent muscles are not considered pathologic; however, their identification can provide clarification in pathologic circumstances. Patients are often unaware of these variations unless there is abnormal shape causing concern for tumor. Muscles are considered anomalous when they are in a pattern that is a variant of normal anatomy. They are considered accessory when they are additional muscles that are not normally present (Figure 8.22). Ultrasound can be helpful in distinguishing congenitally absent muscles from atrophy and denervation. In all of these circumstances, a detailed knowledge of muscle anatomy, including the normal origins and insertions, and common anatomic variation, is needed in combination with good scanning technique to make accurate conclusions. As with other tissue inspected in a musculoskeletal evaluation, any pathologic findings should always be considered with an appropriate clinical context with information gained in the history and physical examination.
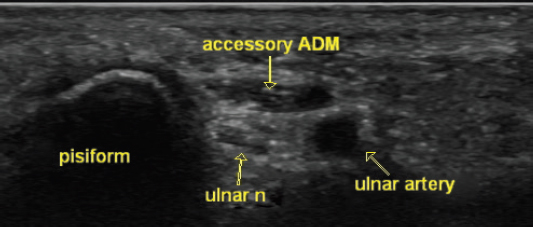
FIGURE 8.22 Sonogram demonstrating an example of an accessory muscle that can be identified with ultrasound. The image is a short-axis view of the ulnar tunnel with an accessory abductor digiti minimi muscle (accessory ADM) seen as a hypoechoic area of muscle overlying the neurovascular structures.
REMEMBER 
1) Muscles are generally more hypoechoic (darker) than other tissue.
2) Scanning muscle to the level of its origin and insertion can assist in identification.
3) Muscle pathology should always be assessed in both short- and long-axis planes.
4) Muscle pathology should always be interpreted within appropriate clinical context.
Related posts:
Stay updated, free articles. Join our Telegram channel

Full access? Get Clinical Tree


