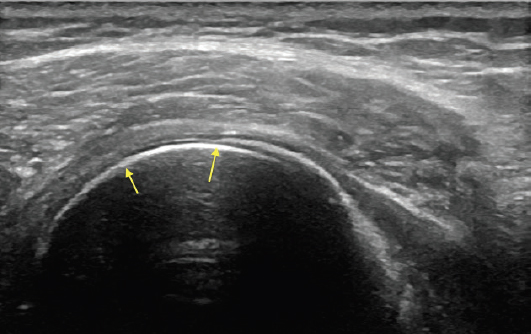
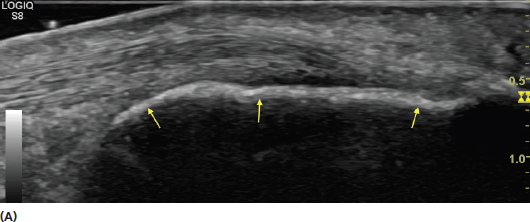
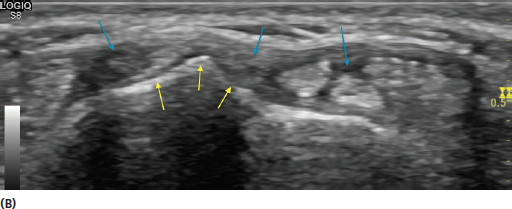
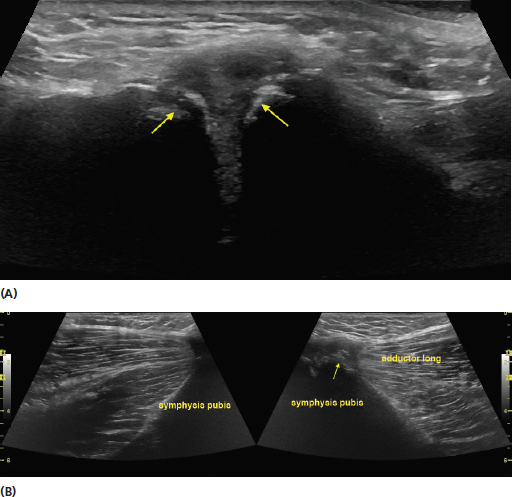
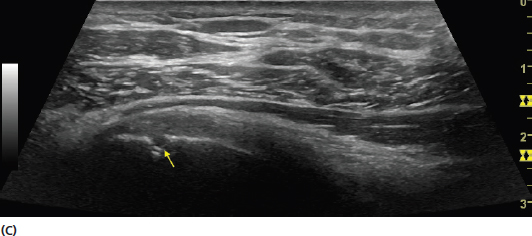
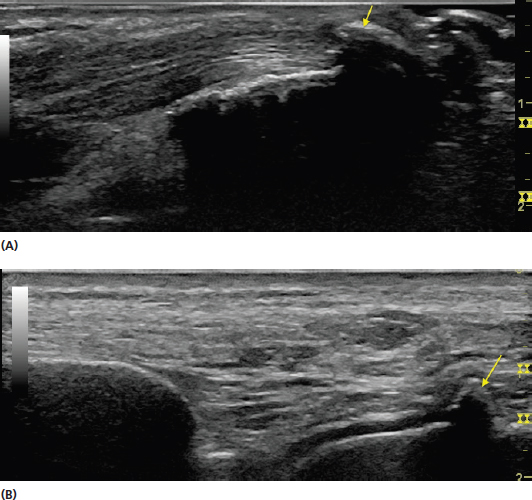
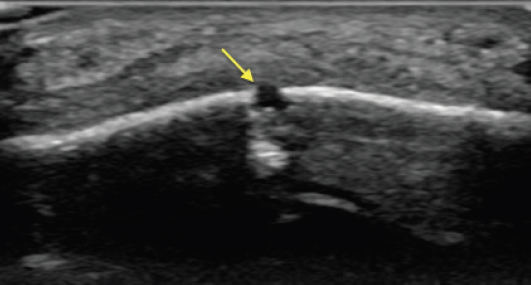
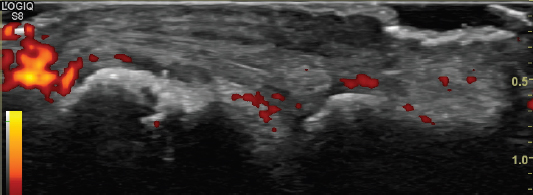
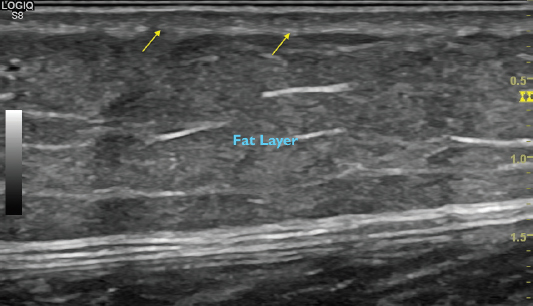
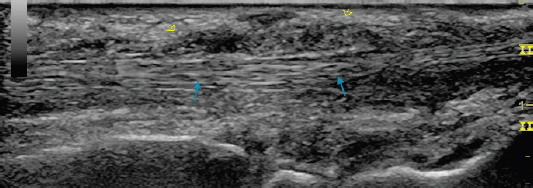
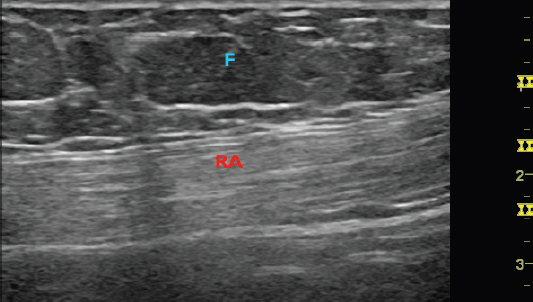
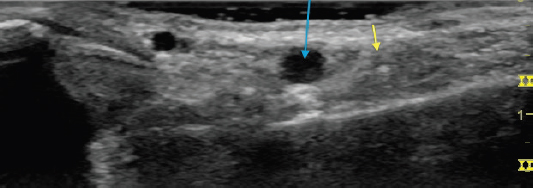
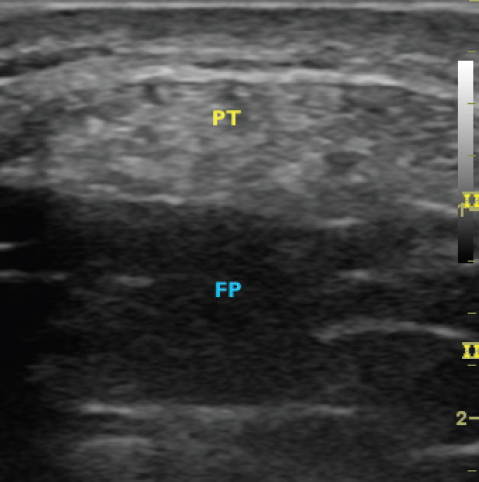
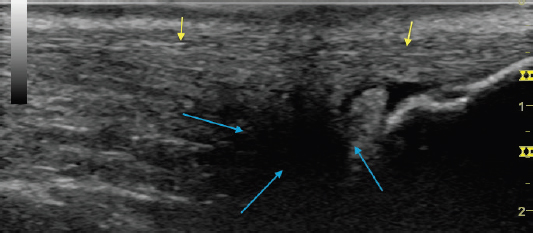
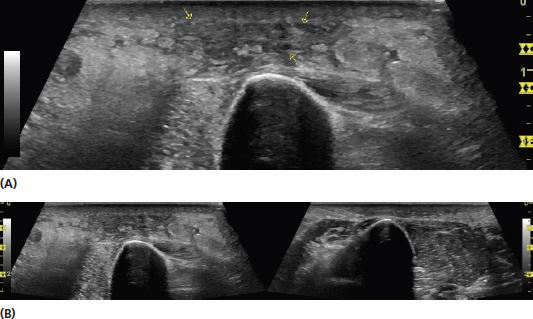
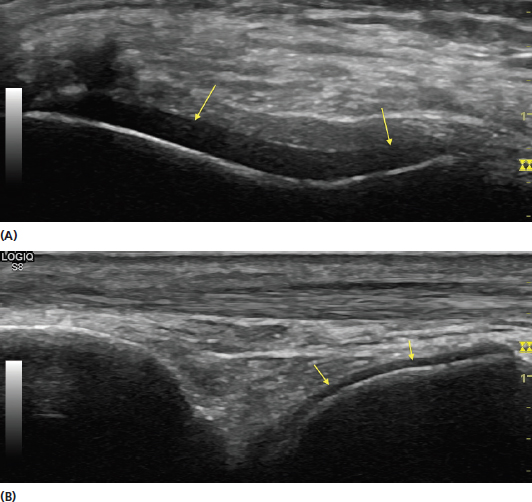
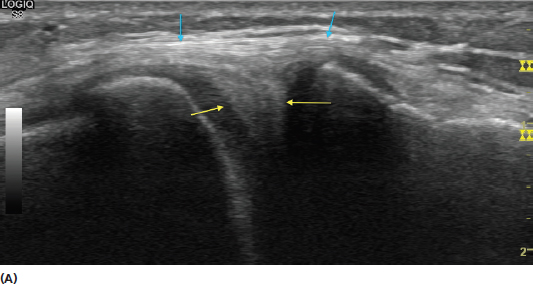
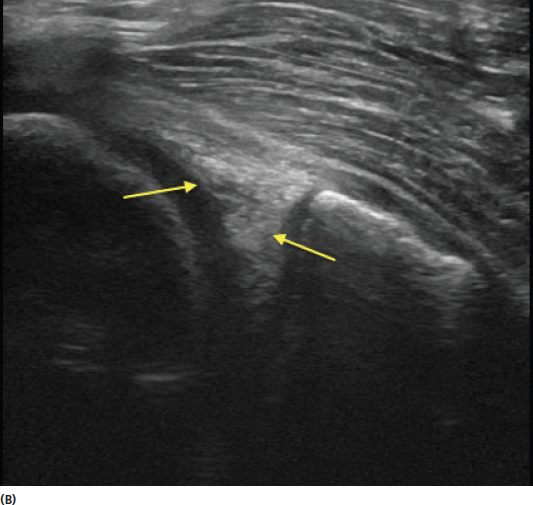
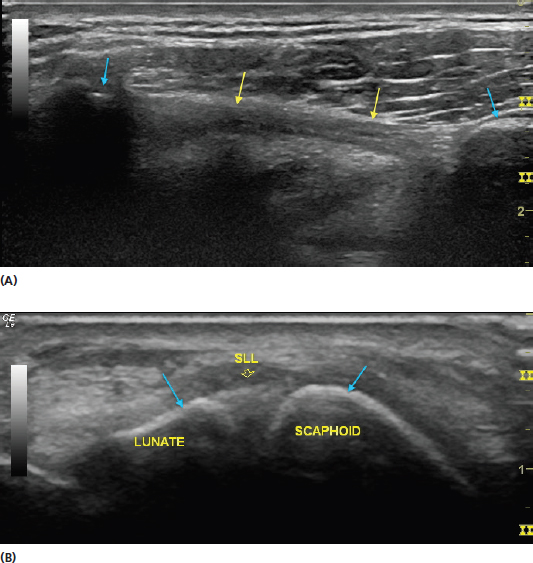
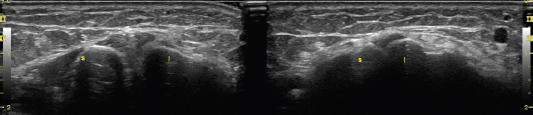
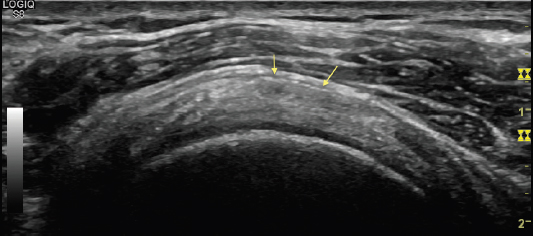
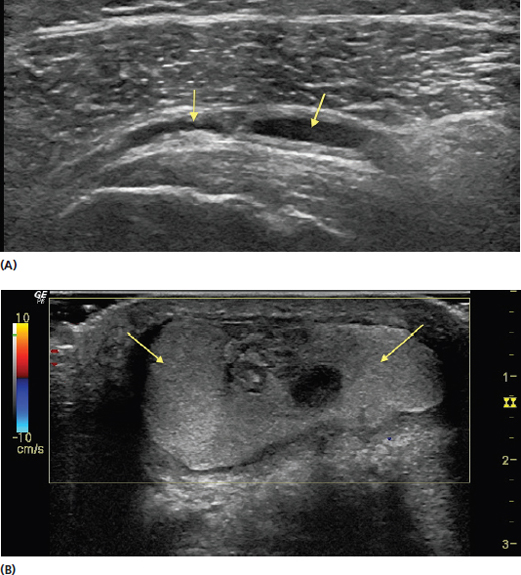
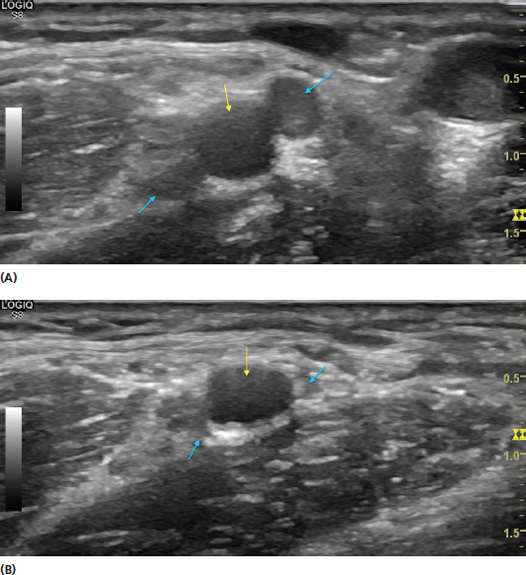
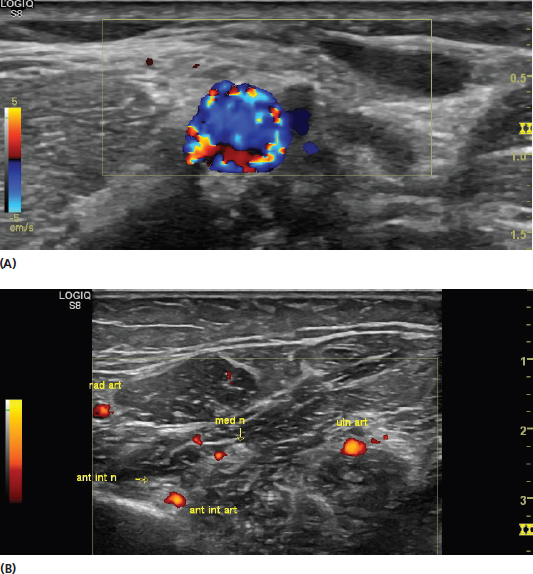
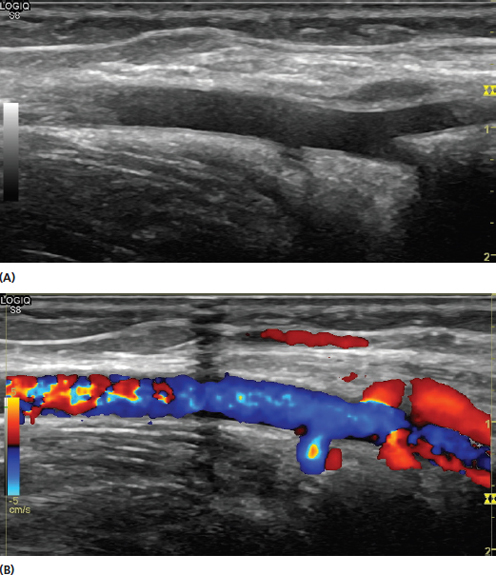
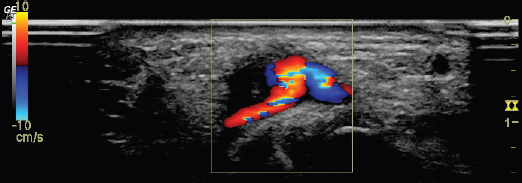
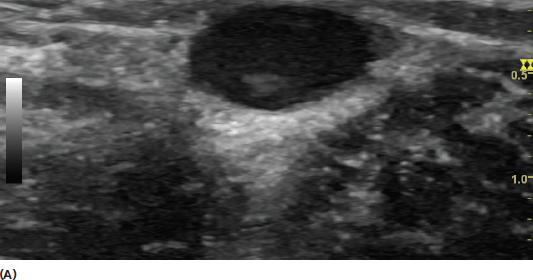
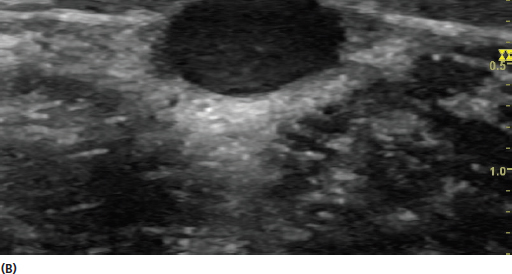
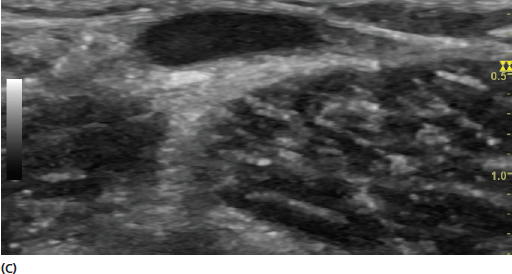
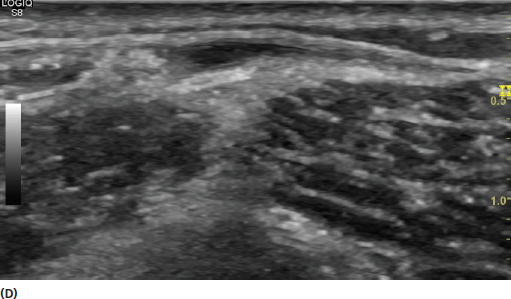
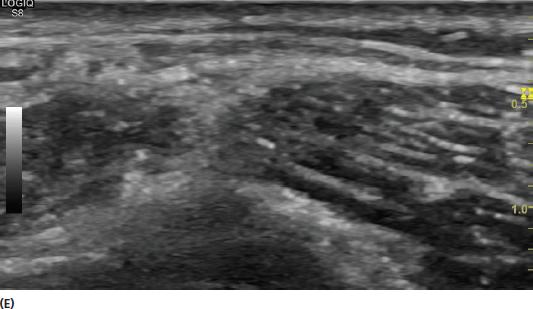
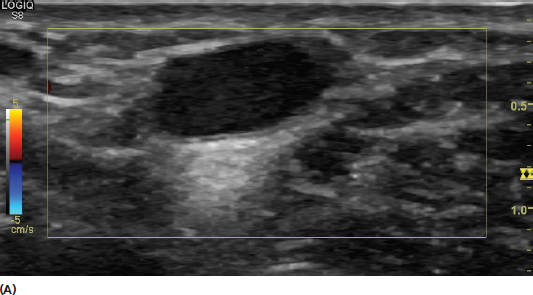
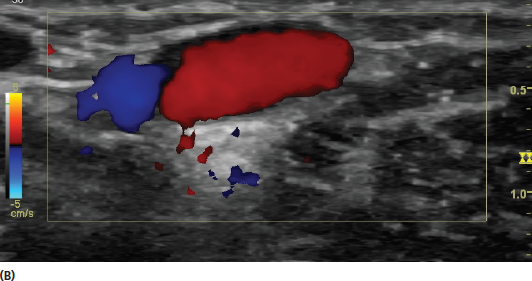
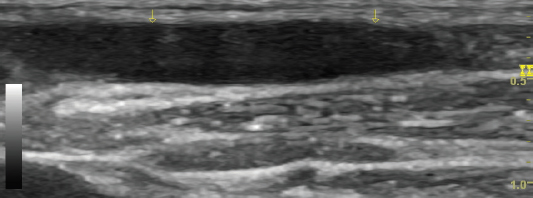
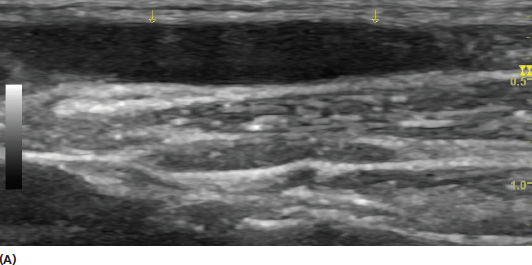
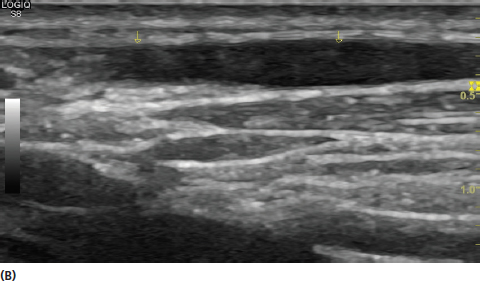
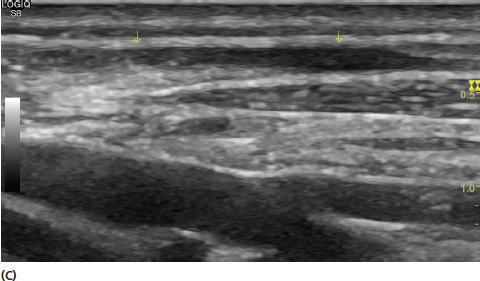
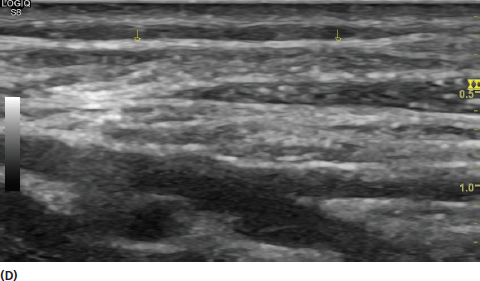
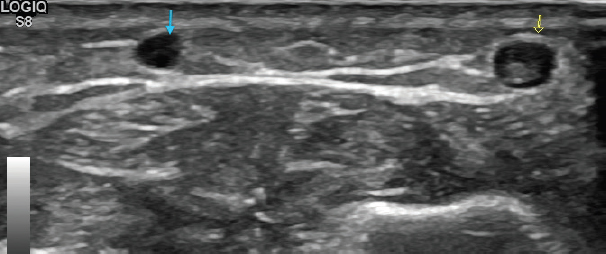
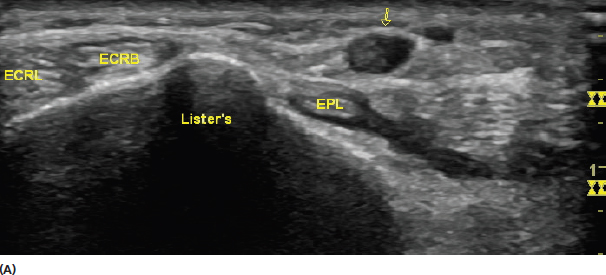
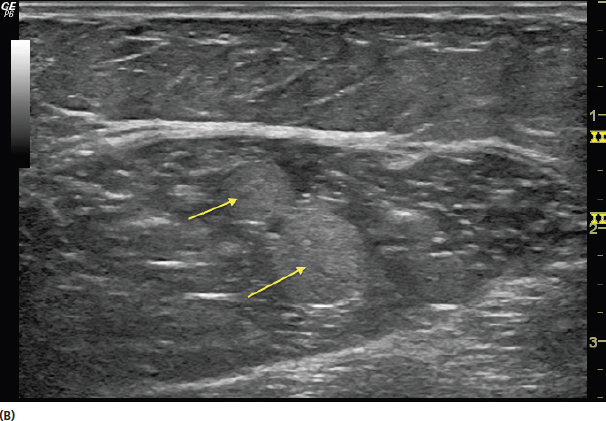
Knowledge of the sonographic appearance of other tissues is needed to appropriately identify structural relationships. Bone, skin, fat, cartilage, ligaments, arteries, and veins all have characteristic appearance on ultrasound. Learning the typical and pathologic appearance of these tissues is essential for improving diagnostic acumen with the musculoskeletal ultrasound evaluation. Ultrasound waves do not penetrate bone. Because of the densely calcified cortex, virtually all of the sound waves reflect back to the transducer. This high acoustic impedance of bone in relation to surrounding tissue results in a very bright appearance on ultrasound (Figure 10.1). Despite the relatively easy identification of bone with ultrasound, essentially only the cortex surface is reliably visualized. The appearance of the image beneath the cortex of the bone is often referred to as bone shadow. This term is used for the acoustic artifact deep to the hyperechoic bone outline that is the result of the sound wave attenuation. This is a limitation of ultrasound because bone tissue and other tissue deep to bone are not adequately visualized. Other imaging modalities such as plain radiographs, computerized tomography, or magnetic resonance imaging should be considered when detailed visualization of bone or soft tissue deep to bone is needed. Because of their high degree of conspicuity, bony landmarks often provide assistance in identifying soft tissue structures that are more difficult to visualize (Figure 10.2). Abnormalities on the surface of bone, particularly at the interface of ligaments or tendons, often provide clues for injury (Figure 10.3). Ultrasound is an excellent modality for identifying osteophytes and spurs (Figure 10.4) and also has a high resolution for identifying disruptions in the bone cortex that might not be visible on x-ray (Figure 10.5). FIGURE 10.1 Sonogram demonstrating the interface of bone (yellow arrows). The difference in impedance between the bone cortex and the surrounding soft tissue results in the hyperechoic appearance. FIGURE 10.2 Sonograms demonstrating examples of bony landmarks that assist in localization. In (A), the cortex of the calcaneus (yellow arrows) is seen at the insertion of the Achilles tendon in long axis. In (B), a bony landmark on the dorsum of the wrist known as Lister’s tubercle (yellow arrows) assists in identifying the dorsal compartments (blue arrows). FIGURE 10.3 Sonograms demonstrating examples of bony irregularity that provide clues for pathology. In (A), the irregular edges of the acromial–clavicular joint are shown (yellow arrows) reflecting a degree of degenerative joint disease. The images in (B) show the irregular edge of the bony origin of the adductor longus demonstrated in long axis (image on the right: yellow arrow), reflecting enthesopathy, in contrast to the relatively normal comparison side (image on the left). The image in (C) shows mild bony irregularity under the insertion of the infraspinatus (yellow arrow). Bony changes of that nature should alert the examiner to inspect for tendonopathy and partial thickness tears in that region. FIGURE 10.4 Sonograms demonstrating examples of bony irregularities. The image in (A) demonstrates an olecranon spur at the insertion of the triceps brachii (yellow arrow). The image in (B) shows an osteophyte on the talar dome at the tibial–talar joint. FIGURE 10.5 Sonogram demonstrating a cortical break in an individual with a nondisplaced fibular fracture. Bone erosions and hypertrophy of the surrounding synovium with inflammation can be detected in inflammatory arthropathies with ultrasound. Increased Doppler uptake can reflect the surrounding inflammation (Figure 10.6). FIGURE 10.6 Sonogram demonstrating bony irregularity, erosions, and synovial inflammation seen as increased Doppler uptake in a patient with rheumatoid arthritis. The skin layer can be visualized with ultrasound. Detailed evaluation of the skin is not usually performed in a routine musculoskeletal evaluation; however, recognition of the skin layer is needed for appropriate localization of other structures. The skin varies in thickness between 1.4 and 4.8 mm depending on the location in the body. It consists of a superficial layer (the dermis) and a deep layer (epidermis). The skin is the most superficial layer of tissue seen in an ultrasound evaluation (Figure 10.7). For this reason, it is best appreciated with higher frequency transducers. Specialized transducers of very high frequency (20–50 MHz) are used for evaluation of dermatologic conditions. In a musculoskeletal assessment, disorders of normal skin such as infections, scar tissue, and tumors should be identified (Figure 10.8). FIGURE 10.7 Sonogram demonstrating the skin (yellow arrows) and deeper subcutaneous layer containing fat. FIGURE 10.8 Sonogram demonstrating an alteration in the normal echotexture of skin. In this case, the heterogeneous postsurgical scar (yellow arrows) is shown. Note that the scar creates some mass effect on the underlying tendon (blue arrows). Fat or adipose tissue is found as a part of the subcutaneous tissue and forms a protective layer over the deep musculoskeletal system. The fat layer is generally more hypoechoic than the surrounding tissue and should be identified to distinguish it from the surrounding tissue. The fat and subcutaneous layer is identified as hypoechoic lobules surrounded by hyperechoic septa (Figure 10.9). The subcutaneous layer also contains superficial veins and superficial nerves (Figure 10.10). The fat layer can be precisely measured with ultrasound. This can be of value when investigating fat atrophy, a known complication of steroid injections. Of note, deep areas of fat require lower frequencies of the incident sound waves for adequate penetration. For this reason, resolution of some of the deeper structures is reduced in patients with high body mass indexes. FIGURE 10.9 Sonogram showing the hypoechoic globular appearance of fat (F) in the subcutaneous layer. Note the more hyperechoic muscle layer (rectus abdominus [RA]) deep to the fat. FIGURE 10.10 Sonogram of a short-axis view of the lesser saphenous vein (blue arrow) and the sural nerve (yellow arrow) in the subcutaneous tissue at the lateral ankle. Areas of fat pads can be seen around long tendons (Figure 10.11) and should be examined for injury as they can be damaged along with other musculoskeletal structures (Figure 10.12). Trauma and fat necrosis can be identified by a loss of the normal echotexture of the lobules. Edema and infection such as cellulitis can also be identified in the subcutaneous layer with ultrasound. Edema presents as a hypoechoic signal between the lobules. With infection, there is a loss of the normal echotexture (Figure 10.13). Edema and cellulitis cannot always be reliably distinguished with ultrasound. FIGURE 10.11 Sonogram demonstrating an example of a fat pad deep to a tendon. This image shows a short-axis view of the patellar tendon (PT) and deep to that is the fat pad of Hoffa (FP). Note the more hypoechoic appearance of the fat pad relative to the echotexture of the tendon. FIGURE 10.12 Sonogram demonstrating an example of pathology in an underlying fat pad. In this image, there is disruption of the normal echotexture of Kager’s fat pad (blue arrows) anterior to the Achilles tendon (yellow arrows) suggesting abnormal edema from advanced Achilles tendonopathy. FIGURE 10.13 Sonograms demonstrating an appearance of cellulitis in the subcutaneous layer in a short-axis view of the forearm. The image in (A) shows a disruption of the echotexture and enlargement of the tissue (yellow arrows). The image in (B) shows the contrast between the affected limb (image on the left) and unaffected limb (image on the right). In ultrasound imaging, cartilage is dark if it is fluid filled, and bright if it is not. Normal hyaline cartilage that covers smooth bony surfaces in joints is seen as a hypoechoic thin layer (Figure 10.14). By contrast, fibrocartilage such as the glenoid labrum or meniscus of the knee appears more hyperechoic (Figure 10.15). Fibrocartilage contains a large amount of collagen fibers that are highly reflective. Hyaline cartilage can be measured precisely with ultrasound for thinning. Fibrocartilage injuries typically appear as tears away from the bone or joint capsule. FIGURE 10.14 Sonograms demonstrating the hypoechoic hyaline cartilage at the knee (A) and the tibial–talar joint (B). Note how the cartilage follows the contour of the bone. FIGURE 10.15 Sonograms demonstrating an example of the echogenic appearance of fibrocartilage. The images shown include the medial meniscus anterior horn (A) and posterior horn (B) (yellow arrows). Note that the appearance is hyperechoic in stark contrast to the hypoechoic appearance of hyaline cartilage. Also shown is the fibrillar pattern of the medial collateral ligament (A) (blue arrows). Ligaments have a moderately hyperechoic fibrillar appearance (Figures 10.15 and 10.16). Ligaments are most easily localized by placing the transducer between the bony landmarks that they connect. Like tendons, ligaments have a high degree of anisotropy, and the transducer should be positioned such that the incident sound waves are perpendicular to the path of the ligament. Anisotropic artifact could potentially be confused with ligament injury. Ligaments will be found deep compared to the surrounding tendons. Stress maneuvers can be used to assess for integrity (Figure 10.17). Ligament injury can be reflected by irregularity of the fibrillar architecture or even complete disruption. FIGURE 10.16 Sonograms demonstrating long-axis views of the fibrillar pattern of ligaments. The coracoacromial ligament (yellow arrows) is shown in (A) and the scapholunate ligament (SLL) (yellow arrow) is shown in (B). It is best to inspect a ligament by also visualizing the bony landmarks (blue arrows) that they attach. FIGURE 10.17 Sonogram demonstrating a split screen view of a normal scapholunate ligament (image on the right) in contrast to the injured side (image on the left) (s, scaphoid; l, lunate). Note that there is an abnormal widening of the joint space with stressing on the injured side. A bursa is a synovial-lined sac that reduces friction between tissues such has tendon, bone, and muscle. Bursae are often only seen as potential spaces (Figure 10.18). For this reason, they are often difficult to visualize on ultrasound unless they are enlarged as in bursitis (Figure 10.19). Enlarged bursa should also be inspected for signs of calcification. Enlargement can be the result of excessive friction, direct trauma, or even infection. The findings of bursal enlargement should always be considered in the clinical context. FIGURE 10.18 Sonogram demonstrating a normal appearance of the subacromial–subdeltoid bursa (yellow arrows). In normal conditions, this bursa is essentially seen as a potential space. FIGURE 10.19 Sonograms demonstrating examples of abnormally enlarged bursa. The image in (A) shows an enlargement subacromial–subdeltoid bursitis (yellow arrows). The image in (B) shows a complex olecranon bursitis. Note that the complex bursitis does not appear as a simple anechoic enlargement and further investigation should be considered in the appropriate clinical context. Bursae are classified according to location. Mucosal bursae lie between skin and bony prominences. Synovial bursae generally lie deeper and between muscle or tendon and bone. Bursae can also be classified as communicating or noncommunicating. They are considered communicating if the fluid is in continuity with the joint space. It is critical to learn the locations of clinically relevant bursa for a complete musculoskeletal inspection. Arteries are circular hypoechoic structures in short axis on ultrasound and can be recognized by their pulsations. Increasing transducer pressure will cause the surrounding veins to collapse and often make the arterial pulsations more conspicuous (Figure 10.20). Doppler imaging provides further details. Color Doppler is generally preferable for higher flow vessels and power Doppler has higher sensitivity for lower flow states (Figure 10.21). Arteries should be viewed in both short and long axis for complete perspective (Figure 10.22). Arterial injuries, including aneurysms and pseudoaneuryms, can often be detected with ultrasound and the use of Doppler imaging can help to distinguish them from other masses (Figure 10.23). FIGURE 10.20 Sonograms demonstrating short-axis views of the brachial artery (yellow arrows) and surrounding veins (blue arrows). The veins are evident in (A) with less transducer pressure. They are collapsed in (B) due to more transducer pressure. FIGURE 10.21 Sonograms demonstrating short-axis views of arteries with color Doppler (A) and power Doppler (B). The image in (A) shows the brachial artery. Color Doppler generally provides a better assessment of higher flow states. It also provides information on the direction of flow in relation to the transducer. The image in (B) is a cross-sectional view of the mid-forearm. The power Doppler in this image provides visualization of the major arteries including some of the smaller ones. The arteries shown include the radial artery (rad art), ulnar artery (uln art), anterior interosseus artery (ant int art), and the persistent median artery (not labeled, near the median nerve [med n]). Power Doppler is often preferable for its higher sensitivity to some of the smaller arteries. FIGURE 10.22 Sonograms of a long-axis view of the brachial artery with both conventional gray scale (A) and color Doppler (B) imaging. The long-axis view provides an additional perspective with flow, arterial branches, and surrounding tissue. FIGURE 10.23 Sonogram of a palpable mass identified as a radial artery pseudoaneurysm with color Doppler ultrasound. Veins can be easily distinguished from arteries by their compressibility (Figure 10.24). For this reason, the examiner should use only light pressure when first attempting to identify a vein. Blood flow can be seen through veins with color or power Doppler. Veins lack the constant flow with Doppler imaging, which is characteristic of arteries. Flow can be accentuated with compression and decompression of a vein (Figure 10.25). Similar to arteries, veins should be assessed in both short and long axis (Figure 10.26). The long-axis view is generally more reliable when assessing the compressibility of a vein (Figure 10.27). Lack of normal compressibility suggests the likelihood of venous thrombosis. The loss of anechoic appearance and loss of flow in the vein are additional suggestions of thrombosis (Figure 10.28). Because of the implications, it should also be determined whether the thrombosis is within a deep or superficial vein (Figure 10.29). The patient should be referred for a conventional venous Doppler evaluation if deep venous thrombosis is suspected during a musculoskeletal evaluation, particularly if the practitioner is not experienced in the diagnosis of vascular conditions. FIGURE 10.24 Sonograms demonstrating a short-axis view of the effect of transducer pressure on the appearance of a vein. Figures (A) through (E) show progressively increasing pressure. FIGURE 10.25 Sonograms demonstrating a short-axis view of a vein with color Doppler both before (A) and after (B) compression and release with the accentuation of flow. Care should be taken while assessing the nature of the Doppler flow to avoid confusion with an artery. FIGURE 10.26 Sonogram showing a long-axis view of a vein. FIGURE 10.27 Sonograms demonstrating a long-axis view of the effect of pressure on a vein. The images (A) through (D) are with progressively increasing transducer pressure. This degree of compressibility is characteristic of a normal vein. FIGURE 10.28 Sonogram demonstrating a short-axis view of a superficial venous thrombosis (yellow arrow) in contrast to an unaffected vein (blue arrow). The more hyperechoic thrombosis can be seen obstructing the anechoic lumen. FIGURE 10.29 Sonograms demonstrating short-axis views of examples of relatively small superficial (A) and deep (B) venous thrombosis (yellow arrows). The image in (A) shows the partial obstruction of the anechoic lumen of a superficial vein at the left of the dorsal wrist. It is distinguished from other anatomic landmarks at that level, including the extensor carpi radialis longus (ECRL), extensor carpi radialis brevis (ECRB), and extensor pollicis longus (EPL) tendons as well as the bony landmark of Lister’s tubercle. The image in (B) shows enlargement and occlusion of the veins (yellow arrows) in the medial gastrocnemius reflected in the complete loss of anechoic appearance. The discovery of thrombosis in the deep veins requires consideration of medical intervention for possible anticoagulation therapy. 1) Bony landmarks serve as some of the best structures to maintain orientation to the surrounding anatomy. 2) Use the highest resolution available to evaluate very superficial tissue such as skin. 3) Evaluate the surrounding fat pads of musculoskeletal structures for additional clues to potential injury. 4) Hyaline cartilage has a hypoechoic appearance on ultrasound whereas fibrocartilage appears hyperechoic. 5) Localize ligaments by finding the acoustic landmarks of their bony attachments. 6) Study the clinically relevant bursa and develop a detailed knowledge of their anatomic location. 7) Analyze arteries and veins in both short and long axis and include Doppler imaging.
Imaging of Other Tissues
INTRODUCTION
BONE
SKIN
FAT
CARTILAGE
LIGAMENTS
BURSAE
ARTERIES
VEINS
REMEMBER
![]()
Related posts:
Stay updated, free articles. Join our Telegram channel

Full access? Get Clinical Tree


