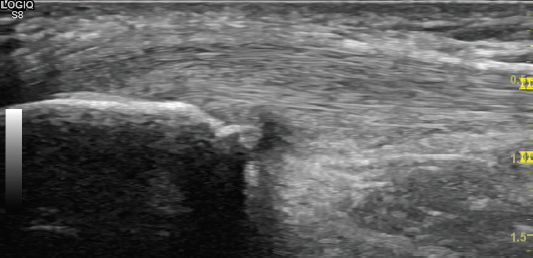
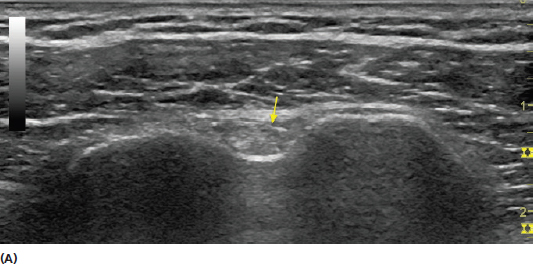
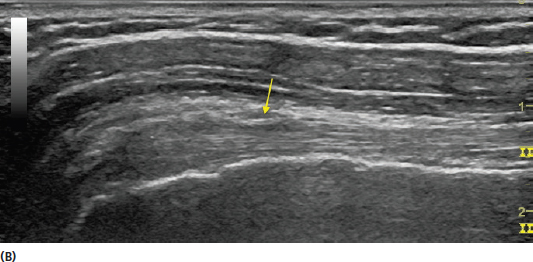
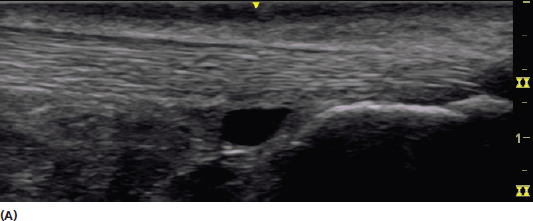
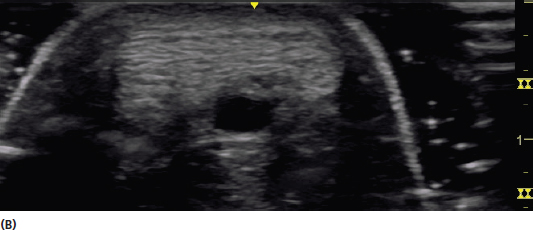
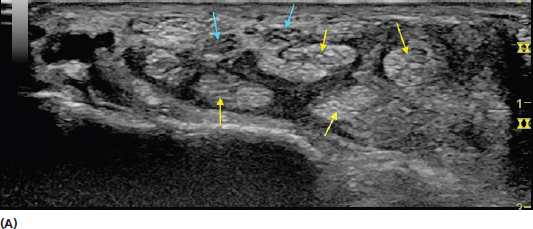
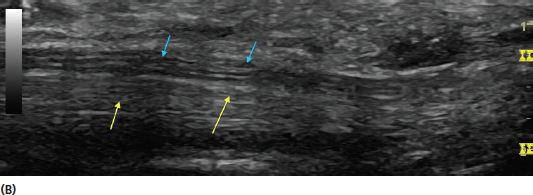
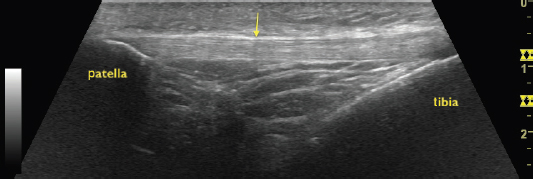
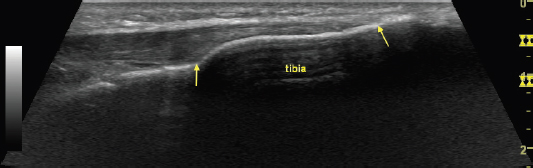
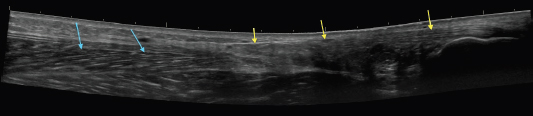
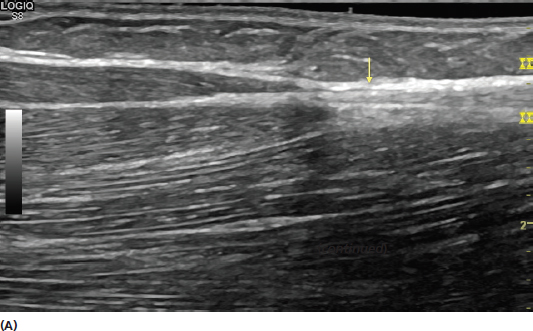
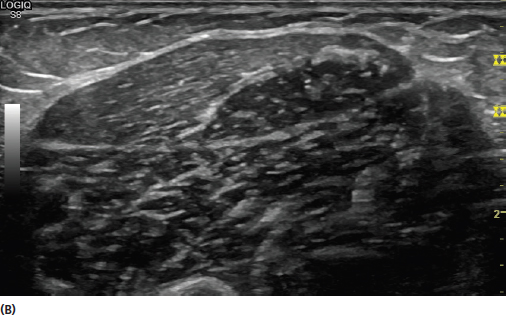
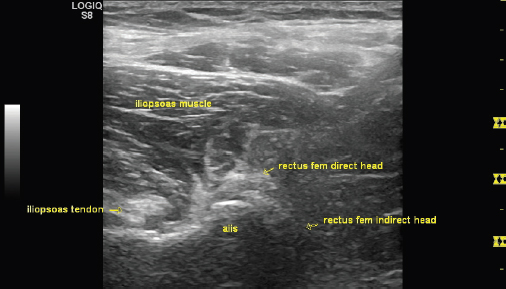
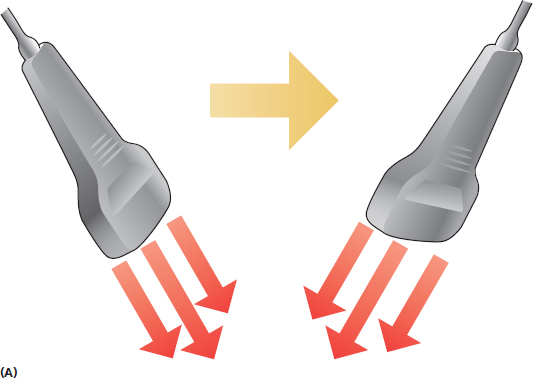
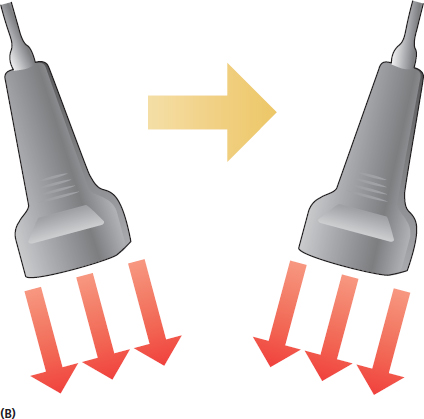
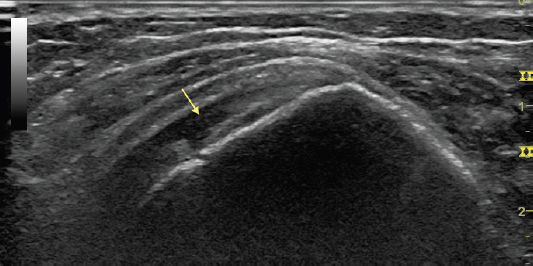
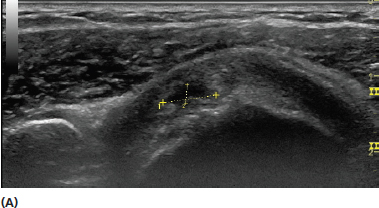
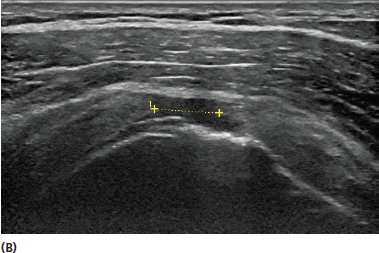
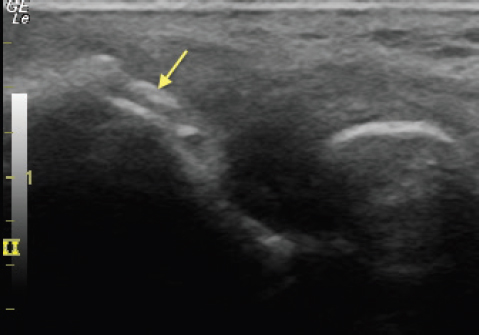
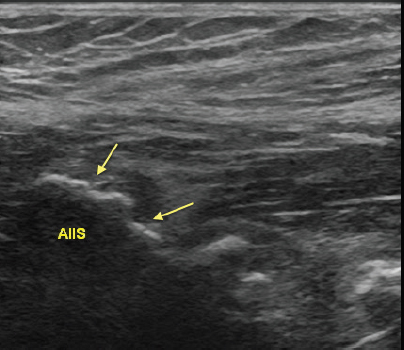
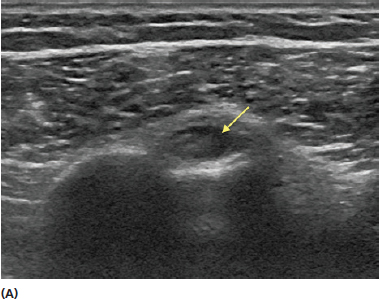
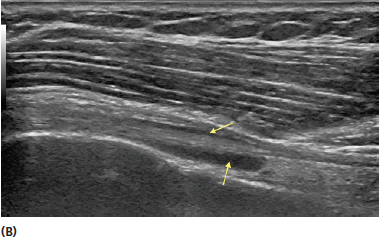
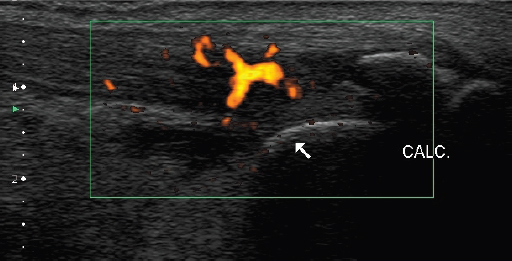
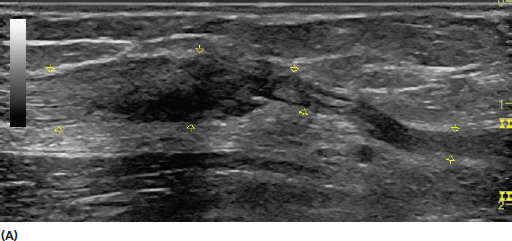
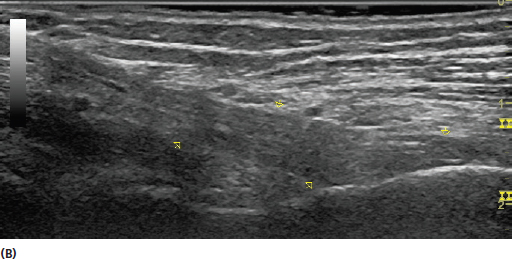
Ultrasound is an excellent imaging modality for assessing tendons. Evaluation of tendon and tendonopathy is one of the most frequent uses of ultrasound in musculoskeletal medicine. Tendons are dynamic structures and highly visible with high-frequency ultrasound. Tendons are an important component of the musculoskeletal system by connecting muscle to bone. Tendons consist of densely packed collagen fibrils that are longitudinally oriented. Normal tendons display a fibrillar architecture with ultrasound (Figure 7.1). In general, most tendons have a synovial sheath in areas where they have a curved path across synovial regions near their connection to bone to reduce friction with movement (Figure 7.2). Tendons that have a straight path typically have a paratenon to reduce friction with movement. The paratenon, unlike the tighter synovial sheath, is a loose envelope with adipose and areolar tissue as well as vascular structures. Both structures appear as hyperechoic borders surrounding the tendon but also have different sonographic appearance in both normal and pathologic conditions. FIGURE 7.1 Sonogram demonstrating a long-axis view of the patellar tendon. The fine fibrillar architecture of the tendon is demonstrated. FIGURE 7.2 Sonograms demonstrating both short-axis (A) and long-axis (B) views of the biceps brachii tendon at the level of its synovial sheath (yellow arrow). The tendon should be scanned in both short and long axis (Figure 7.3). The characteristic fibrillar pattern of the tendon should be identified. The appearance of tendons is generally distinct from that seen with the fascicular architecture of peripheral nerves (Figure 7.4). It is generally helpful to first identify the bony acoustic landmark of the origin or insertion of the tendon for localization (Figure 7.5). This region should be scanned in both long and short axis with the entire footprint of the tendon insertion inspected (Figure 7.6). Most tendons should be viewed from their level of origin or insertion as far as their myotendinous junction (Figure 7.7). Some tendons originate from more than one muscle and each interface should be visualized (Figure 7.8). In addition, some muscles have more than one tendinous origin or insertion, and both areas should be scanned for completeness (Figure 7.9). The examiner should use purposeful scanning techniques when inspecting tendons. There is a tendency for novice examiners to scan in nonpurposeful swirling motions or other nondirectional patterns. The beam of the transducer is very thin, often roughly the width of a credit card. This creates a longitudinal image of a tendon that displays a considerable amount of length (ie, length of the transducer) but very little width. For this reason, the transducer should be moved back and forth to examine the entire width of the tendon before advancing the transducer to visualize more of the length. The entire width of tendons is seen in short axis, but the scanning motion should be used to assess the length of the tendon. FIGURE 7.3 Sonograms demonstrating views of an Achilles tendon in both long (A) and short (B) axis. FIGURE 7.4 Sonograms demonstrating short-axis (A) and long-axis (B) views of the flexor digitorum tendons (yellow arrows) and median nerve (blue arrows) in the carpal tunnel space. The fine fibrillar architecture of the tendons is demonstrated in contrast to the fascicular pattern of the median nerve. Note that in the short-axis view, a bifid median nerve is shown with two sets of nerve fascicles. FIGURE 7.5 Sonogram demonstrating a long-axis view of the patellar tendon (yellow arrow). Note the bright bony landmarks of the patella and the tibia. FIGURE 7.6 Sonogram demonstrating a long-axis view of the entire footprint of the insertion of the patellar tendon on the tibia (yellow arrows). FIGURE 7.7 Extended field of view sonogram demonstrating a long-axis view of the Achilles tendon (yellow arrows) including its insertion on the calcaneus. Also seen is the more proximal myotendinous junction and the soleus (blue arrows). FIGURE 7.8 Sonograms demonstrating both long-axis (A) and short-axis (B) views of the myotendinous junction of the biceps brachii long head and short head with the common distal tendon. The interface of both muscle tendon junctions should be thoroughly inspected when investigating potential injury. FIGURE 7.9 Sonogram demonstrating a short-axis view of the direct and indirect origins of the rectus femoris from an anterior inferior iliac spine (AIIS). Note that the tendon of the indirect head of the rectus femoris is less conspicuous in this view due to anisotropic artifact because the incident sound beam from the transducer is not orthogonal to its position. The transducer should be moved appropriately to inspect both tendon origins adequately in such circumstances. Tendons generally have significant anisotropic artifact when the incident sound wave is not orthogonal to the tissue (Figure 4.7). Toggling and heel-to-toe rocking of the transducer should be incorporated into tendon scanning to minimize this artifact. These techniques are discussed in more detail in Chapter 5. To avoid confusion, particularly in beginners, toggling and rocking of the transducer should only be done when the base is stationary Figure 7.10). FIGURE 7.10 Illustrations demonstrating toggling (A) and heel-to-toe rocking maneuvers with the transducer (B). These motions are used to alter the direction of the beam from the transducer to create a more perpendicular approach to the tissue desired to reduce anisotropic artifact. These maneuvers are particularly important when inspecting tendons. Ultrasound is highly sensitive for detecting diseased or damaged tendon. Tendons can become thickened and more hypoechoic (darker) with degeneration and also display a disruption of the normal architecture. The tendon should be examined for intrasubstance degeneration, enlargement, and tearing (Figure 7.11). Tearing can be partial thickness or full thickness (Figure 7.12). The extent of the tearing should be described in detail and should be examined in both short- and long-axis views. Small foci of hyperechoic signal representing calcification or ossification can be seen in calcific tendonopathy (Figure 7.13). Tendons should be scanned in their entirety from the bony insertion or origin through its myotendinous junction because injury or degeneration can occur at any point in this complex. When scanning this region the bony surface should be inspected for irregularity or spurring. This can often represent chronic traction spurring or undersurface tearing. Abnormal tendon thickness and hypoechoic echotecture can reflect enthesopathy at these sites (Figure 7.14). Areas that have a tendon sheath should be inspected for signs of enlargement or fluid, suggesting tenosynovitis (Figure 7.15). Power Doppler can be used to assess for neo-vascularization in chronic tendonopathy. This is often represented by increased flow on Doppler ultrasound (Figure 7.16). Although milder tendon pathology can often be bilateral, it is generally helpful to perform side-to-side comparisons to assess for differences (Figure 7.17). The interpretation of tendon pathology should always be taken into appropriate clinical context. A focused history and physical for the presenting complaint should be obtained and the relationship of the findings to that information should be considered. FIGURE 7.11 Sonogram demonstrating a long-axis view of an intrasubstance tear (yellow arrow) in the supraspinatus tendon. The tear is seen as a hypoechoic (dark) area with loss of the normal architecture. FIGURE 7.12 Sonograms demonstrating a short-axis view of a partial thickness supraspinatus tear (A) and a long-axis view of a full thickness supraspinatus tear (B). FIGURE 7.13 Sonogram demonstrating a long-axis view of the common extensor tendon with calcific tendonopathy (yellow arrow). The calcifications are seen as the hyperechoic (bright) signal intensity lying outside of the normal bone matrix. FIGURE 7.14 Sonogram demonstrating enthesopathy of the origin of the direct head of the rectus femoris. Note the irregularity of the bony surfaces of the anterior inferior iliac spine (AIIS) and the abnormal echotecture of the tendon near the bone (yellow arrows). FIGURE 7.15 Sonograms demonstrating a short-axis (A) and long-axis (B) view of abnormal fluid accumulation (yellow arrows) around the long head of the biceps brachii tendon. The fluid presents as a hypoechoic (dark) or anechoic (black) region around the fibrillar tendon. FIGURE 7.16 Sonogram demonstrating a long-axis view of Achilles tendonopathy with increased Doppler flow. FIGURE 7.17 Sonograms demonstrating long-axis view of a distal biceps brachii rupture with retraction of tendon fibers (A) and the normal biceps brachii tendon on the contralateral side (B). The side-to-side comparisons demonstrate the dramatic difference between the two tendons. 1) Use the bony acoustic landmarks of the bony origin and insertion to help identify the tendon. 2) Irregularities in the bone or underlying cartilage can often be an indication of tendon injury. 3) Use purposeful movement with the transducer to visualize the entire width of the tendon when in long axis and the appropriate length when in short axis. 4) The transducer beam should be positioned as perpendicular as possible to the tendon to minimize anisotropic artifact. 5) Always consider the appropriate clinical context when interpreting tendon pathology.
Imaging Tendon
TENDON STRUCTURE
SCANNING TECHNIQUE FOR TENDONS
TENDON PATHOLOGY
REMEMBER
![]()
Related posts:
Stay updated, free articles. Join our Telegram channel

Full access? Get Clinical Tree


