Amr M. Ajlan, MD, FRCPC
Jonathon Leipsic, MD
CASE 1 Normal Pericardial Anatomy by CT
A 74-year-old woman smoker presented with a productive cough. She did not improve despite a course of oral antibiotics prescribed for treatment of community-acquired pnuemonia. A noncontrast chest computed tomography (CT) scan was performed for further evaluation, which demonstrated mild centrilobular emphysema but no airspace consolidation. Coronal (Figures 11-1 and 11-2) and transverse (Figure 11-3) reconstructions from this chest CT demonstrate the appearance of a normal pericardium. Coronary calcifications were evident, highlighting the anatomic relationship between the coronary arteries and the pericardium.
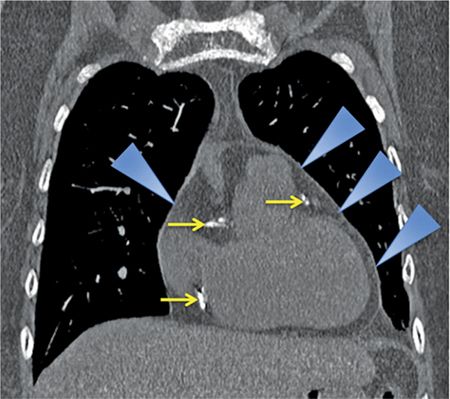
FIGURE 11-1 Coronal reconstruction from a noncontrast chest CT demonstrates the normal appearance of the pericardium, indicated by blue arrowheads pointing to a thin line around the heart. Note the calcifications in visualized portions of the right and left coronary arteries (yellow arrows).
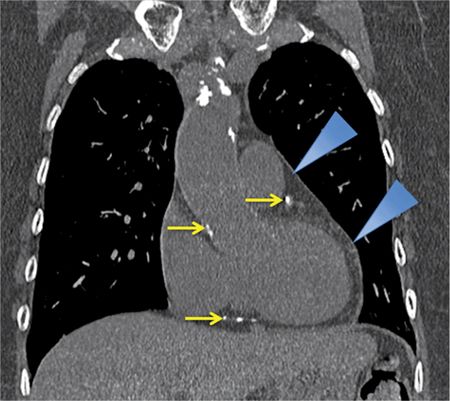
FIGURE 11-2 A slightly more posterior coronal reconstruction relative to Figure 11-1 from a noncontrast chest CT demonstrates a normal pericardium, indicated by blue arrowheads pointing to a thin line around the heart. Note the calcifications in visualized portions of the coronary arteries as well as the aortic root (yellow arrows).
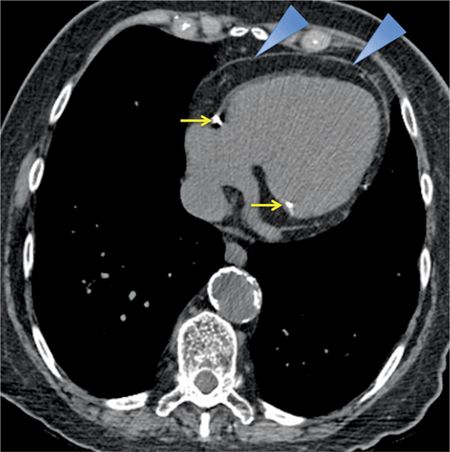
FIGURE 11-3 Axial reconstruction from a chest CT shows a normal pericardium (blue arrowheads). Note calcification in the RCA as well as the presence of mitral annular calcification (yellow arrows).
CASE 2 Normal Pericardial Anatomy by MRI
A 42-year-old woman presented to her family doctor with a 4-month history of palpitations. She was otherwise well, with no significant past medical history and no family history of cardiac conditions. A Holter monitor revealed a few bursts of ventricular tachycardia (VT) over a 24-hour period and she was referred for a cardiac MRI.
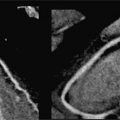
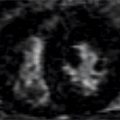
Sequences included axial double inversion recovery (DIR) imaging showing the typical low signal of normal pericardium (Figure 11-4). Different CT and MRI techniques to identify tissue as epicardial fat are shown in Figure 11-5.
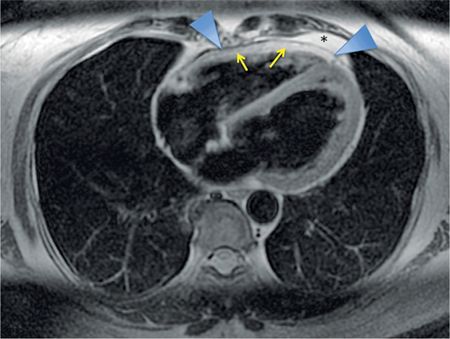
FIGURE 11-4 Axial DIR imaging demonstrates low signal of normal pericardium (arrowheads) between the bright epicardial fat (yellow arrows) and mediastinal fat (asterisk).
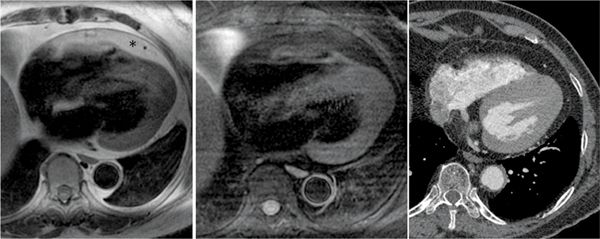
FIGURE 11-5 Axial DIR-MRI without (left panel) and with (middle panel) fat saturation helps establish that the tissue surrounding the heart indicated by the asterisk (up to 2 cm thick in some areas overlying the RV free wall, a normal variant) is epicardial fat. A contrast CT performed some time later for the evaluation of a left lower lobe nodule (right panel), confirms the low-attenuation epicardial fat and the normal appearance of the pericardium.
CASE 3 Normal Pericardial Recesses vs other Mediastinal Structures
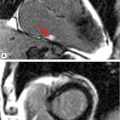
A 64-year-old woman presented with new-onset seizures and was evaluated with an urgent CT head and cerebral angiogram study. The extracranial CT images indicated a 2.7 cm paratracheal mass. She was then referred for a CT thorax for further investigation, which was performed with contrast as a lung cancer protocol with 2.5 mm slice thickness. An axial image at the upper mediastinum (Figure 11-6) demonstrated a low-attenuation structure, which was felt to likely represent a normal pericardial reflection. However, given its somewhat superior location, MRI was requested by the referring clinician. A mass protocol was performed which included axial SSFP, T1-weighted images with and without fat saturation, T2-weighted images with fat saturation and postcontrast imaging. An axial T2-weighted fat-saturated image (Figure 11-6) confirmed the presence of simple fluid in the paratracheal structure which did not enhance following contrast, consistent with high extension of the superior pericardial recess.
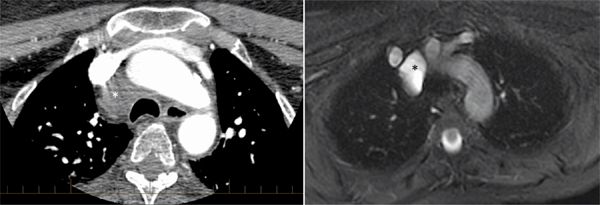
FIGURE 11-6 contrast-enhanced CT (left) demonstrates a low-attenuation paratracheal structure (asterisk), that is better delineated as fluid-filled by T2-weighted MR imaging, (right). Signal characteristics and anatomic location are consistent with high extension of the superior pericardial
DISCUSSION: PERICARDIAL ANATOMY
The pericardium is composed of 2 anatomic layers—the outermost fibrous pericardium and an inner serous pericardium. The serous pericardium is subsequently divided into 2 layers—the visceral and parietal pericardium. The visceral layer (also known as the epicardium) is fused with the myocardium and is continuous with the parietal layer which is reflected over it and fused with the fibrous pericardium. The surface of this layer is lined with a single layer of mesothelial cells, which secrete fluid into the pericardial space, and physiologically contains up to 50 mL of transudative fluid. Drainage of pericardial fluid is by the right lymphatic and thoracic ducts.
The shape of the pericardium is somewhat conical. Its base is anchored at the central tendon of the diaphragm at the opening of the inferior vena cava (IVC), and its apex envelops the great vessels, as they emerge from the base of the heart, for a distance of 4 to 5 cm. As the fibrous layer of the pericardium proceeds cephalad, it becomes incorporated with the fibrous tissue surrounding the great vessels. This is continuous above with the deep cervical fascia, especially with its pretracheal layer. Anteriorly the pericardium is attached above and below to the sternum by the sternopericardiac ligaments.1
The thymus gland lies anteriorly as well as triangularis sterni muscle from sternum to the third to seventh costal cartilages. The internal mammary arteries run deep to the costal cartilages about a centimeter lateral to the sternum. At the incisura of the left lung, a small area of pericardium, variable in size, is uncovered by the pleura and comes into direct relationship with the chest wall at about the sixth intercostal space close to the sternum. Laterally, the pericardium is in contact with the pleura, with the phrenic nerves and their accompanying vessels between them. Posteriorly, the pericardium lies in contact with the bronchi, the esophagus, and the descending thoracic aorta.
The functions of the pericardium are to: (1) stabilize the position of the heart; and (2) protect it from spread of infection. Pericardial fluid serves as a lubricant and reduces friction to allow unimpeded cardiac motion. Additionally, the pericardium prevents excess cardiac dilatation in the setting of sudden rise in intracardiac volume.
Due to the above stated reason, there is an important interventricular dependence between the left and right cardiac chambers in both physiologic and pathologic circumstances. In general, due to the lower pressure and thinner wall of the right ventricle (RV), it is more vulnerable to compressive forces; however, during inspiration when there is increased venous return to the right side of the heart, there is reduced filling of the left. Intrapericardial pressure and pleural pressure are both around 0 to 2 mm Hg, which becomes negative during inspiration. In pathologic circumstances, the pericardial pressure can become elevated and result in resistance to filling during phases of the cardiac cycle. Interventricular dependence can also be affected following cardiac surgery as the pericardium has been opened, removing the normal constraints of the pericardium.
NORMAL IMAGING APPEARANCES
The serous pericardium is composed of a single layer of mesothelial cells; only the parietal/fibrous pericardium is of sufficient thickness to be appreciated on cross-sectional imaging.2
Imaging with CT and MRI provides excellent anatomical detail of the mediastinum due to high contrast and spatial resolution. With the addition of ECG gating, the limitation of cardiac motion can be ameliorated. The addition of multiple planes allows visualization of the thorax and can give information on the extent of disease as well as ancillary findings.
The normal pericardium is less than 2 mm in thickness on imaging,2,3 greater thickness than this is indicative of pathology. On CT, the normal pericardium is best imaged in systole, as a linear structure of soft tissue attenuation, identifiable from the surrounding low-attenuation pericardial fat on both noncontrast (Figures 11-1 through 11-3) and contrast-enhanced (Figure 11-5) images.
On MRI, the normal pericardium is best appreciated in DIR sequences (Figures 11-4 and 11-5). It appears of low signal on T1-weighted and T2-weighted imaging, reflecting the fibrous nature of the pericardium. Steady-state free precession (SSFP) gradient-echo sequences also demonstrate low signal of the pericardium and its relation to surrounding structures. On both CT and MRI, visualization of the normal pericardium is limited posteriorly and inferiorly due to paucity of pericardial fat. When there is lack of pericardial fat, contrast may be necessary to visualize the pericardium.4 Calcification, a common manifestation of pericardial pathology, is best depicted on CT; calcium has little protons to generate MRI signal and therefore may not be appreciated with proton MRI. MRI’s strength for assessment of pericardial disease is in providing dynamic imaging that gives important information on changes in morphology and flow volume during the cardiac cycle and phases of respiration.
The normal pericardium has several recesses (Figure 11-7) that are recognizable on imaging and include superior and inferior aortic recesses, left and right pulmonary vein recesses, and posterior pericardial and postcaval recesses. All of these should be differentiated from lymph nodes (Figure 11-8) and other mediastinal structures.5
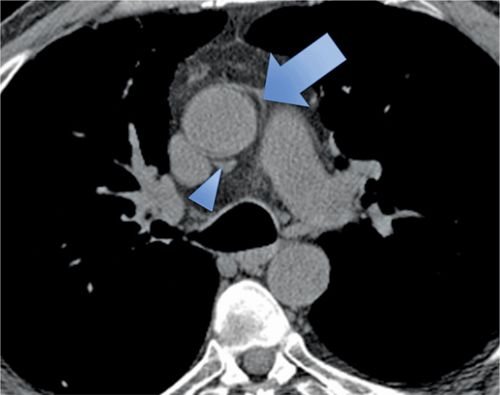
FIGURE 11-7 Axial CT image acquired without contrast as part of a CT coronary angiogram protocol demonstrates a normal superior aortic recess anterior posterior to the aorta (arrowhead); there is also extension of fluid anterior to the aorta forming a characteristic cleft between the great vessels (arrow).
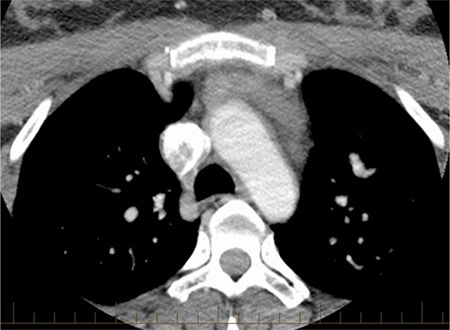
FIGURE 11-8 Pericardial fluid is seen with superior extension anterior to the great vessels and in the paratracheal region due to cephalad extension of the aortic recess, which importantly should not be mistaken for lymphadenopathy.
CASE 4 Absence of the Pericardium
A 26-year-old man was admitted to the emergency room (ER) following a fall from a balcony and landing on his face. He was urgently scanned according to the rapid trauma imaging protocol of the institution, which is a whole-body CT angiogram (CTA) performed on a high-pitch flash scanner. On chest CT (Figure 11-9), there is levoposition of the heart and posterior displacement of the cardiac apex. There was no mediastinal hematoma, pericardial effusion, or pleural effusion. On closer inspection, there was no visible pericardium (Figure 11-9) and there was invagination of lung parenchyma between the pulmonary artery (PA) and the aorta (Figure 11-10). These features are most in keeping with congenital absence of the pericardium.
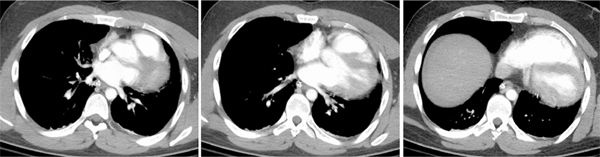
FIGURE 11-9 cephal to caudal (left to right) axial reconstruction of a whole-body CT angiogram performed in a patient who had suffered signifcant trauma after a fall shows marked posterior and leftward rotation of the cardiac apex. close inspection reveals absence of the pericardium.
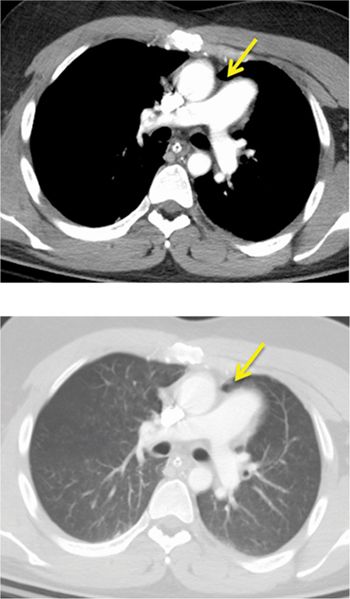
FIGURE 11-10 CT angiography of the chest shows, in an angiography window (top) and lung window (bottom), complete absence of the pericardium with invagination of lung parenchyma between the PA and aorta (arrow).
DISCUSSION: ABSENCE OF THE PERICARDIUM
Major congenital defects of the pericardium are usually incidentally diagnosed since patients with such are generally asymptomatic; however, they can present with chest pain.6 These anomalies are due to abnormal development of the pleuropericardial membrane.7 There is a spectrum of abnormalities, ranging from complete absence which is rare to partial absence of the pericardium, which is most commonly left-sided in 67% of cases. On chest radiography, the cardiac silhouette is typically displaced to the left with loss of the right heart border which is hidden by the spine. Cross-sectional imaging with CT or MRI can more accurately demonstrate cardiac levoposition (Figure 11-11), with posterior disposition of the cardiac apex (Figures 11-12 and 11-13). In normal circumstances, the pericardium extends to cover the aortopulmonary window; however, in the case of complete absence or partial absence on the left there can be interposition of the lung between the aorta and main pulmonary artery (MPA) (Figures 11-14 and 11-15). There may also be extension of the MPA and left atrial (LA) appendage beyond the margins of the mediastinum.
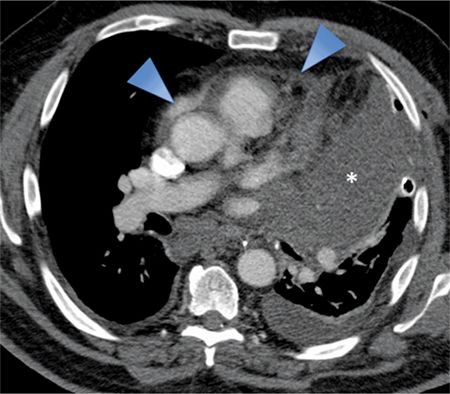
FIGURE 11-11 Pericardial involvement of a large left upper lobe mass (asterisk) is evident as thickening and irregularity of the pericardium (arrowheads). Also note the left pleural effusion as well as mediastinal and subcranial adenopathy.
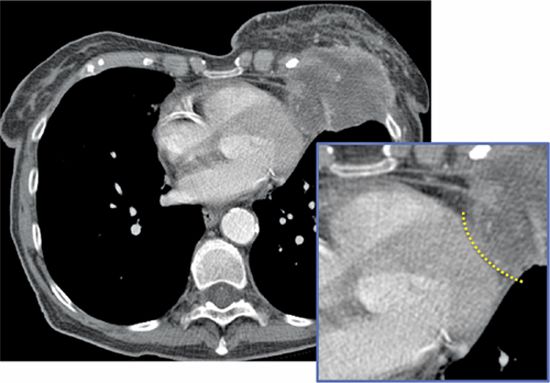
FIGURE 11-12 A transverse axial CT image from a woman with a left breast mass that extends posteriorly to involve the chest wall with encasement of the subjacent pericardium. There is a visible fat plane (inset, dotted line) between the mass and LV myocardium suggesting the lack of myocardial involvement.
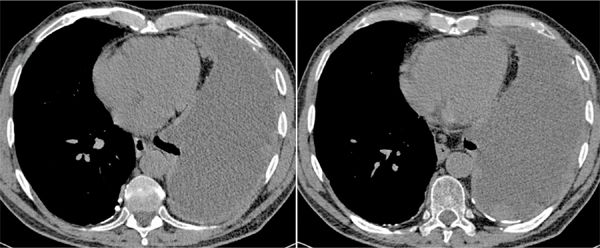
FIGURE 11-13 Transverse axial unenhanced CT images in a dyspneic man with asbestos exposure history demonstrate a large partially loculated left-sided pleural effusion, with multiple pleural based nodules and masses of slightly higher attenuation, in keeping with malignant involvement. There is nodularity of the anterior aspect of the pericardium consistent with secondary involvement. Background bilateral pleural calcified plaques related to asbestos-related pleural disease. These findings are most in keeping with a left-sided mesothelioma which was confirmed on biopsy.
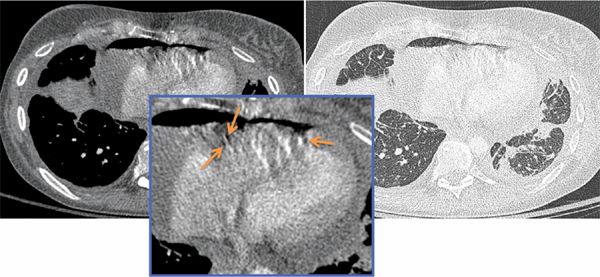
FIGURE 11-14 Transverse axial CT images shown in mediastinal (left) and lung (right) windows from a patient with known breast cancer and acute onset of shortness of breath demonstrate moderate to large hydropneumopericardium, with air present in the nondependent pericardial space (inset, arrows). There is irregular thickening of the pericardium and pleura with loculated bilateral pleural effusions. In addition, there are bilateral patchy areas of irregular interlobular septal thickening which may be due to lymphatic/venous obstruction or lymphangitic carcinomatosis. Also note sclerosis of the left aspect of the vertebral body, concerning for a malignant deposit. These features were consistent with metastatic breast carcinoma. A pericardial drain was inserted under ultrasound guidance; however, the patient was subsequently referred to the cardiac surgeon for a pericardial window procedure.
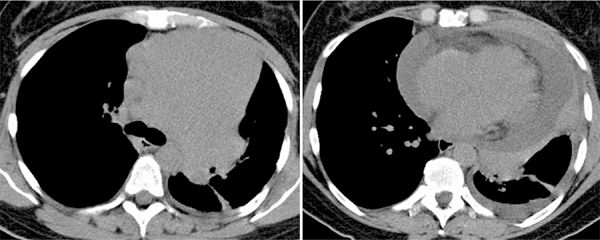
FIGURE 11-15 Noncontrast chest CT in a woman with dyspnea shows a large homogeneous anterior mediastinal mass (left) associated with confluent mediastinal and subcarinal lymphadenopathy. A slightly more caudal axial image (right) shows a large pericardial effusion with a rind of soft tissue surrounding the pericardium. Histopathology revealed a mantle cell lymphoma.
Rare complications of these defects include herniation or entrapment of the LA appendage or the left ventricle (LV) through the defect, which may result in compression of the left main coronary artery (LMCA). CT and MR imaging are important in these cases as there may be coexistent congenital abnormalities in one-third of cases,8 including patent ductus arteriosus, atrial septal defect (ASD), mitral stenosis (MS), and tetralogy of Fallot (TOF).9
CASE 5 Pericardial Effusion
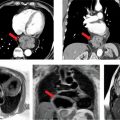
A 67-year-old man with a history of human immunodeficiency virus (HIV) infection presented to the emergency department with a 4-day history of worsening sharp central chest pain, which was occasionally worse on inspiration. He had undergone CT pulmonary angiography to excluded pulmonary embolus, which was negative for such; however, there was a small pericardial effusion present. Additionally, there was peribronchovascular and perilobular consolidation involving the lower lung lobes bilaterally suggestive of organizing pneumonia thought to be secondary to prior infection or underlying drug reaction. Transverse axial contrast-enhanced images from same patient’s CT chest (Figure 11-16, left panel) demonstrated the small nonenhancing pericardial effusion. Blood cultures were positive for Streptococcus bovis infection. Subsequent echocardiography (ECHO) revealed a 6 mm mass on the interatrial septum which suggested the diagnosis of endocarditis. Given the possible association of S bovis endocarditis with a gastrointestinal (GI) malignancy, the patient had a colonoscopy which was negative and a subsequent CT abdomen was ordered. Transverse axial CT image (Figure 11-16, right panel) from this study performed in the portal venous phase of contrast demonstrates enhancement of the pericardial effusion that was not seen on the previous CT thorax study since it was performed during the arterial phase of enhancement.
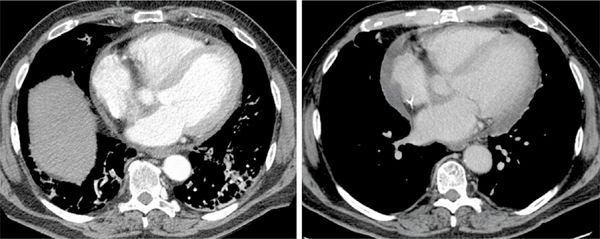
FIGURE 11-16 CT of the chest with contrast in a patient with streptococcus bovis bacteremia and pleuritic chest pain demonstrates a small pericardial effusion (left). Subsequent CT imaging obtained in the portal venous phase of contrast demonstrates enhancement of the pericardial effusion (right).
The patient subsequently underwent cardiac magnetic resonance (CMR) examination. Sequences included axial triple inversion recovery, axial and short-axis DIR, steady-state free precession (SSFP) sequences and postcontrast imaging. Axial and short-axis SSFP images (Figure 11-17) demonstrated increase in size of the pericar-dial effusion—signal was heterogeneous on axial DIR images (Figure 11-17). A final diagnosis of S bovis pericarditis was made and the patient improved with antibiotic therapy.
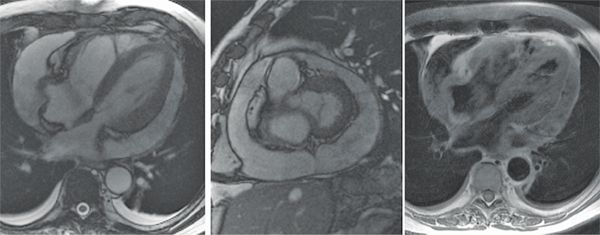
FIGURE 11-17 Axial ssFP (left panel) and short-axis ssFP (middle panel) images in a patient who initially had a small pericardial effusion and whose blood cultures became positive for S bovis show considerable increase in size of the effusion. Axial dir imaging (right panel) shows heterogeneous signal intensity of the pericardial fluid.
CASE 6 Hemorrhagic Effusion
A 69-year-old man was brought to the ER following collapse at home associated with nausea and vomiting, and complaining of severe back pain. The patient was slightly lethargic, with tachycardia (heart rate [HR] 110 beats per minute [bpm]), hypotension (blood pressure [BP] 68/45 mm Hg) and weak peripheral pulses. On examination, there were faint heart sounds and distension of the neck veins. Chest X-ray revealed an enlarged cardiac silhouette with features of hydrostatic interstitial pulmonary edema in the lungs. A contrast-enhanced CT thorax was subsequently ordered.
Axial CT images demonstrated a large, hyperdense pericardial effusion (Figure 11-18) and features of cardiac tamponade with collapse of the right atrium (RA) and RV free wall and dense reflux of contrast into the IVC and hepatic veins. The cause of the hemopericardium was not seen on the CT examination. An ultrasound-guided pericardial drain yielded serosanguinous fluid, and the patient’s vital signs recovered.
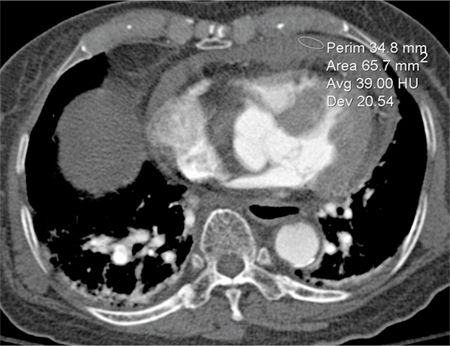
FIGURE 11-18 Acute hemopericardium shows increased signal intensity (average 39 HU in the region of interest shown) compared to typical serous pericardial fluid.
CASE 7 Subacute Pericardial Hematoma
A 75-year-old man with a history of open heart surgery for aortic valve replacement and coronary artery bypass (CABG) presented with dyspnea and ankle edema. A chest radiograph revealed an enlarged cardiac silhouette and increased bilateral lower lobe reticulation but no focus of airspace disease. He underwent ECHO that showed a reduced ejection fraction (EF) of 40%, and an intrapericardial collection was seen. A CT was performed which included noncontrast, arterial phase as well as delayed postcontrast imaging to evaluate the collection as well as the aorta.
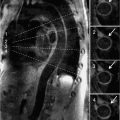
Axial unenhanced and enhanced CT images demonstrated a high-attenuation loculated pericardial effusion, involving the base of the heart and extending superiorly and anteriorly along the right atrioventricular (AV) groove (Figure 11-19), of which the thickest anterior component measures up to 3 cm in greatest diameter. There was no evidence of arterial blush to suggest extravasation (Figure 11-20). Coronal MRI showed that the effusion was exerting mass effect on the RV (Figure 11-21) as well as heterogeneous but predominantly low signal consistent with chronic hematoma; the pericardium itself was not thickened. Given loculation and mass effect, surgical drainage was performed with resolution of symptoms.
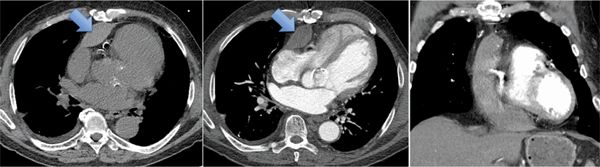
FIGURE 11-19 Arrows indicate high-attenuation loculated pericardial effusion on unenhanced (left) and contrast-enhanced (middle, right) CT images. Note the superior extension on the coronal reconstruction.
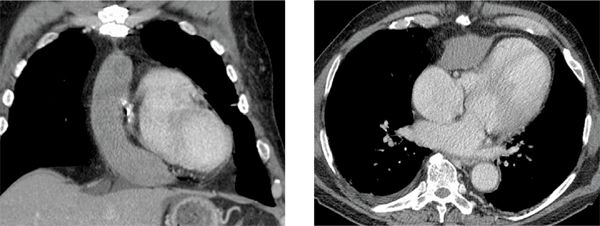
FIGURE 11-20 Delayed postcontrast CT imaging shows a large loculated pericardial effusion with no evidence of arterial blush to suggest extravasation.
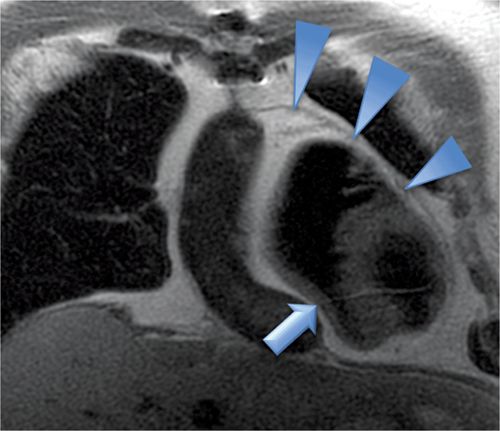
FIGURE 11-21 A large loculated pericardial effusion is seen with DIR-MRI, which shows mass effect on the right ventricle (arrow) and normal thickness of the pericardium (arrowheads).
Related posts:
Stay updated, free articles. Join our Telegram channel

Full access? Get Clinical Tree


