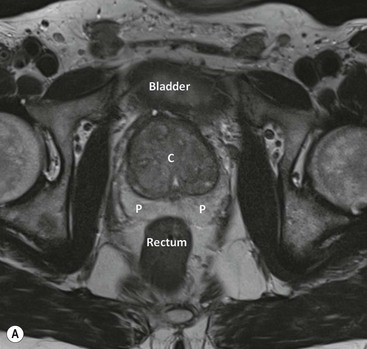
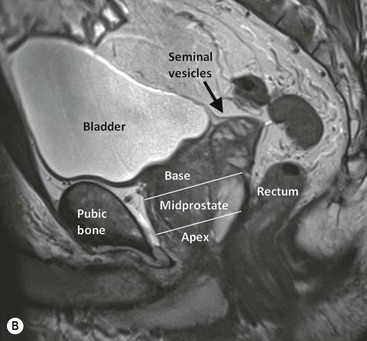
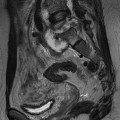
Joyce G.R. Bomers, Leonardo Kayat Bittencourt, Geert Villeirs, Jelle O. Barentsz With almost 240,000 new cases and approximately 30,000 deaths in the USA predicted for 2013, prostate cancer (PCa) is the most common non-cutaneous male cancer, and the second cause of cancer-related death.1 Presently, one in six men will be diagnosed with PCa at a certain moment in their life. The past three decades have seen a steep rise in PCa incidence. To a certain extent this can be explained by the introduction of prostate specific antigen (PSA) level measurement, by the development of improved diagnostic imaging and by the improvement in demographic information systems. The improvement in overall life expectancy and the trend to apply lower cut-off levels for the PSA blood level test will further increase the number of men diagnosed with PCa.2 Nowadays, an abnormal digital rectal examination (DRE), an elevated PSA level or anomalous changes in PSA level and dynamics (i.e. doubling time or PSA velocity) are biological signs indicating an increased risk of PCa. However, these techniques are being considered of restricted accuracy in PCa detection. DRE is affected by considerable inter-observer variability, and is limited to the evaluation of lesions in the posterior and lateral peripheral zone. The specificity of PSA testing is of limited value, as 70–80% of patients with slight PSA elevation (>4.0 ng/mL) have benign prostatic hyperplasia (BPH) or prostatitis rather than PCa. In general, when there is an increased risk of PCa, systematic random transrectal ultrasound (TRUS) biopsies are performed. However, undersampling is a large limitation. Even with the most aggressive biopsy schemes, detection rates of only 23–42% after the first biopsy session, until 18% after the fourth biopsy session, are reported.3 Furthermore, significant underscoring of tumour aggression is a notable limitation of systematic biopsies.4 These results are caused by sampling errors, tumour multifocality and heterogeneity of the lesion or a combination of these factors. As histopathology results obtained from TRUS-guided biopsy are commonly used in nomograms for risk assessment and prognosis in PCa, an inaccurate assessment of the true tumour aggression will lead to wrong treatment options. The limitations of DRE, PSA, TRUS and systematic biopsy schemes have raised interest in the development of prostate magnetic resonance imaging (MRI). In the assessment of PCa, MRI can be used for multiple purposes: screening, detection of primary or recurrent cancer, localisation and staging of local and distant disease. Since the first prostate MR examinations in the 1980s, prostate MRI has evolved to a mature imaging technique. The development of additional functional and metabolic techniques, such as dynamic contrast-enhanced MRI (DCE-MRI),5 diffusion-weighted imaging (DWI)6 and proton MR spectroscopy imaging (MRSI),7 has made MRI an even more powerful modality in the detection and localisation of PCa. Next to high-resolution T2-weighted imaging, which is mainly used to depict the prostate anatomy, DCE-MRI improves the sensitivity in PCa detection8–10 and DWI11–14 and MRSI15,16 add specificity in characterisation of PCa.95 For these reasons, a group of prostate MRI experts of the European Society of Urogenital Radiology (ESUR) recommends a multi-parametric approach, combining high-resolution T2-weighted images with at least two functional MR techniques for improving detection and characterisation of PCa.17 At this moment, multi-parametric magnetic resonance imaging (MP-MRI) is the most sensitive and specific imaging technique for localising prostate cancer.18 The prostate gland surrounds the proximal part of the urethra and is located directly caudal from the bladder and ventral of the rectum (Fig. 39-1). The seminal vesicles lie posterosuperiorly between the bladder and the rectum. The ejaculatory ducts pass through the gland and end in the prostatic urethra at the verumontanum. The neurovascular bundles, responsible for erectile function, pass from superior to inferior along both posterolateral sides of the prostate. In craniocaudal direction, the prostate can be divided into three parts (Fig. 39-1B). The cranial part of the prostate is referred to as the base, the middle part is the midprostate and the caudal part is called the apex. Anatomically, the prostate consists of three different zones: the peripheral zone, the transition zone and the central zone. Ventral to the prostate lies the anterior fibromuscular stroma, mainly composed of smooth muscle cells and connective tissue; it does not contain glandular tissue. The peripheral zone is located posteriorly and inferiorly and around 70–80% of the tumour foci are located in this zone.19,20 The transition zone is located interiorly and surrounds the prostatic urethra. The central zone is located posterior and superior of the transition zone. Approximately 20% of PCa foci arise from the transition zone and 10% arises from the central zone.21 In young men, the transition and central zone are usually indistinguishable from each other, being usually referred together as the ‘central or internal gland’.22 With increasing age, the prostate zonal anatomy changes. In young men, the central gland is composed mainly of the central zone. In older men the central gland is composed mainly of the transition zone, due to the development of benign prostatic hyperplasia. BPH leads to the formation of adenomatous nodules in the transition zone. Mostly, the central zone becomes compressed and will be displaced towards the prostatic base, making it a difficult task to accurately define the zonal anatomy of the central gland by MR imaging.23 As for the peripheral zone, it is generally not affected by BPH and retains its histological features. Areas of prostatitis are almost exclusively derived from the peripheral zone, and in the specific clinical context of MR imaging, chronic prostatitis is a much more relevant condition than acute prostatitis, because it is usually of asymptomatic course or shares manifestations similar to that of BPH, being often associated with increased PSA levels, and constituting an important differential diagnosis for PCa. The prostate is a histologically heterogeneous structure, with a diversity of cellular types. Ninety per cent of malignant prostate tumours consist of adenocarcinoma. Other prevalent tumour types are ductal, cystic adenoid, signet-ring cell, small-cell and neuroendocrine tumours.24 Unlike most other solid tumours, PCa usually does not manifest itself as a discrete nodule. The neoplastic tumour cells are usually intermingled with normal cells.25 For this reason, it can be understood why DRE is incapable of detecting a significant number of lesions, and also why PSA testing, being a marker of prostate activity, is not specific enough to rule out other more frequent benign conditions.26 The final diagnosis of PCa is exclusively histopathological. The gold standard for the determination of the biological aggressiveness of PCa is the Gleason grading system.27 This system is based on a description of cancer cell architecture at low-power optic microscopy. Five different microscopic patterns can be described, increasing from less (Gleason grade 1; well-differentiated uniform glands) to most aggressive (Gleason grade 5; poorly differentiated, anaplastic or even no presence of prostate gland cells). After radical prostatectomy the Gleason score (GS) is calculated by the sum of the two most prevalent patterns, ranging from 2 to 10: for example, Gleason 3 + 4 = 7. After a prostate biopsy session, the sum of the most prevalent pattern and the most aggressive pattern are given. The GS is considered a strong clinical predictor for the prognosis of the patient and is used for decisions in further patient treatment.28 Gleason grades 4 and 5 and GS >7 have the worst prognosis.27,29 In general, high-resolution T2-weighted images are used to depict the anatomy of the prostate and its surrounding structures as the seminal vesicles, bladder and rectal wall. The normal peripheral zone has a homogeneous intermediate to high signal intensity, clearly distinguishable from the transition and central zones (Fig. 39-2). It is usually surrounded by a thin hypointense rim, which represents the anatomical capsule and is an important landmark in tumour staging.22 In T2-weighted images PCa can appear as an area of low signal intensity (Fig. 39-3). High-grade tumours, with a Gleason grade 4 or 5, usually present with a lower signal intensity.30 Low-grade tumours, with a Gleason grade 2 or 3, can present as T2-isointense areas, or even as non-focal mildly hypointense abnormalities. Non-malignant conditions, such as (post-biopsy) haematomas, (granulomatous) prostatitis (Fig. 39-4), scar tissue, atrophy, post-radiation changes and hormonal therapy effects, also manifest as T2-hypointense lesions in the peripheral zone.31,32 However, wedge-shaped lesions with low signal intensity or diffuse extensions without mass effect are highly likely to be benign.33 The central gland is characterised by low signal intensity on T2-weighted images, frequently intermingled by round, well-circumscribed heterogeneous BPH nodules with a mixed heterogeneous high and low signal intensity, in a pattern described as ‘organised chaos’ (Fig. 39-2). Encircling the central gland lies the pseudo-capsule, a thin T2-hypointense rim that separates the central gland from the peripheral zone.22 Given the heterogeneity of the region and the wide spectrum of changes attributable to BPH, the diagnosis of PCa in the central gland (Fig. 39-5) imposes an even greater challenge than in the peripheral zone. In the literature a number of findings that can be helpful in the detection of PCa in the central gland have been described. If there is an ill-defined homogeneous T2-hypointense focal lesion (‘erased charcoal drawing sign’), a lesion with spiculated or undefined margins, an anteriorly located lesion with a lenticular or fusiform shape, loss of the T2-hypointense contour of BPH nodules, loss of definition of the pseudo-capsule, or signs of urethral invasion, PCa might be present. On the other hand, focal T2-hypointense areas may still be normally observed in the central gland either as predominantly stromal BPH or as protrusion of the anterior fibromuscular stroma.34 The reported diagnostic performance of T2-weighted imaging in the detection and localisation of PCa has a wide range, with sensitivities and specificities between 48–88% and 44–67% for detection8,35,36 and between 58–67% and 60–81% for localisation.37–39 T1-weighted images show little to no utility for the detection of suspicious lesions in the prostate, since the normal parenchyma is homogeneously isointense in this sequence, and therefore does not allow for the detailed evaluation of its architecture. This sequence is predominantly used for the assessment of haemorrhagic foci, which present as T1-hyperintense areas (Fig. 39-6). Even so, considering that haemorrhage is a potentially confounding factor for PCa, due to its low signal intensity on T2-weighted images, an interval of 8 weeks between the biopsy session and MRI examination is usually advised,40 in order to reduce the incidence of false-positive findings. Dynamic contrast-enhanced MRI is a functional MR imaging technique that shows the dynamic uptake and rapid washout of a gadolinium-based contrast agent to exploit the typical pharmacokinetic properties of normal and tumour tissue. Technically, DCE MR imaging is based on fast axial T1-weighted sequences which are repeatedly acquired before, during and after IV bolus injection (2–4 mL/s) of a gadolinium-based contrast medium, encompassing the whole prostate gland and seminal vesicles, with a temporal resolution preferably lower than 15 s per acquisition.17 Originally, DCE evaluation based on T1-weighted images is a technique derived from the initial studies in dynamic breast MR imaging,41 consequently also bringing its post-processing techniques and concepts such as contrast medium ‘wash-in’ and ‘washout’ from the classic curve types I, II and III, in a qualitative, quantitative or even semi-quantitative approach. In most of the neoplastic conditions, PCa included, angiogenesis is induced by secretion of vascular growth factors in reaction to local hypoxia or lack of nutrients.42 An increase in tumour vascularity leads to an enhancement pattern with peaks earlier and higher than those of the normal surrounding tissue, combined also with early and pronounced contrast media washout (Figs. 39-3 and 39-5).42,43 Other benign conditions such as prostatitis (Fig. 39-4) in the peripheral zone and BPH in the central gland (Fig. 39-2) also lead to regional changes in the enhancement pattern. Therefore, PCa is hard to detect with DCE-MRI alone. Granulomatous prostatitis of the peripheral zone is only shown by moderate enhancement, which can be lower than usually observed in PCa.44 Regardless of the choice between a semi-quantitative and a quantitative model, DCE evaluation shows strong evidence of good performance in the management of PCa. It has been shown that DCE is significantly better than conventional T2-weighted imaging alone in the localisation of tumour foci,45–47 and that it increases the accuracy of less experienced radiologists in the detection of extracapsular extension and seminal vesicle involvement.48 Because of this, the use of DCE is definitely well indicated, and is a fundamental part of multi-parametric prostate MR imaging. In diffusion-weighted imaging (DWI) the random movement of water molecules in tissue is shown. In an environment of totally unrestricted diffusion, the movement of water molecules is completely random, constituting a phenomenon known as Brownian movement, or ‘free diffusion’. Restricted diffusion is seen in tissues with a high cellular density and intact cell membranes. Tissue types associated with restricted diffusion comprise cancer, abscess, cytotoxic oedema and fibrosis.49 In the clinical setting, thanks to those properties, DWI has become one of the most important non-invasive biomarkers in oncology, with many already proven applications such as tumour detection, staging and evaluation of therapy response.50 On diffusion-weighted images areas with restricted diffusion have a hyperintense signal. The sensitivity of DWI to water movement is variable, depending on the MR field strength and on the time/amplitude relation of the movement-encoding gradient, also known as b-value. For local prostate imaging, DWI should be performed with at least 2 b-values, including a low b-value of 0 s/mm2 and a higher b-value of 500–1000 s/mm2. Based on the diffusion-weighted images, a so-called apparent diffusion coefficient (ADC) map can be calculated. ADC is measured in millimetre per second squared (mm/s2), and provides quantitative information that is inversely proportional to the degree of diffusion restriction. Low ADC values, which are hypointense on the ADC map, represent tissue with restricted diffusion. More detailed technical information about DWI is given in the article of Qayyum et al.49 Healthy prostate tissue in the peripheral zone is rich in tubular fluid-filled structures, allowing for unrestricted diffusion of water molecules, manifesting through low signal intensity on the diffusion-weighted images and high ADC values (Fig. 39-2). In the majority of cases, the peripheral zone can be easily discerned from the central gland, owing to its homogeneously higher ADC values.51 Upon microscopic observation, the central gland exhibits a greater proportion of compact smooth muscle and concurrently a smaller proportion of glandular elements than the peripheral zone, with this probably responding for a higher percentage of intracellular than extracellular fluid.23 Additionally, with the ageing of the patient, there is an increase in the ADC values of both the peripheral zone and central gland,51 which is probably due to atrophic changes, causing a decrease in cell volume, and simultaneous enlargement of the gland ducts. BPH is histologically characterised by hyperplasia of central gland cells, with variable degrees of involvement of the glandular, muscular and fibrous components.52 This heterogeneity is also manifested in water diffusion properties in BPH, being classically expressed in MRI as foci of low ADC values interspersed with areas of high values (Fig. 39-2).53 Histologically, prostatitis is characterised by extracellular oedema surrounding the prostate cells, associated with lymphocyte aggregates, plasma cells, macrophages and neutrophils in the stroma.32 In a recent study it has been shown that although there is a significant overlap, ADC values of prostatitis are lower than normal prostate tissue, and significantly higher than low- and high-grade PCa.14 However, due to a very high cell density, granulomatous prostatitis can present itself by ADC values lower than the ADC values of PCa.54 PCa is histologically characterised by a higher cell density and a higher nucleus/cytoplasm ratio than the surrounding normal prostate tissue, with substitution of the glandular parenchyma by tumour cells. This causes a marked reduction in the ADC values relative to the normal prostate (Figs. 39-3 and 39-5).6,
Prostate
Multi-Parametric Prostate MRI
Introduction
Anatomy
Histology
MR Imaging
T2-Weighted MR Imaging
T1-Weighted MR Imaging
DCE MR Imaging
DWI MR Imaging
![]()
Stay updated, free articles. Join our Telegram channel

Full access? Get Clinical Tree


Prostate
Chapter 39

