Chapter 10 Spontaneous Intraparenchymal Hemorrhage
The ability to image the brain using computed tomography (CT) and magnetic resonance imaging (MRI) has greatly enhanced our understanding of intraparenchymal hemorrhages (IPH) in the central nervous system. Before the advent of these modalities, the diagnosis of IPH was based on clinical presentation and indirect angiographic findings. Certainty could only be reached at the time of necropsy. CT and MRI now provide us with means to characterize the hematoma size, its location, and its effect on adjacent structures. Furthermore, they allow us to follow the evolution of the hematomas and taught us that these lesions are highly dynamic and have a dangerous tendency to expand early after their development.1,2 Brott et al. reported substantial hematoma growth (greater than one third of the baseline volume) in 26% of patients within 1 hour of the initial CT scan and in an additional 12% within the first 20 hours among patients presenting for emergency evaluation within 3 hours of symptom onset.1
The cause responsible for the production of the hematoma can often be gleaned from brain imaging, such as in cases of associated tumors and vascular anomalies. Timing and adequacy of interventions may be guided by serial imaging, as is often the case with progressive hydrocephalus requiring ventriculostomy or expanding cerebellar hemorrhages demanding surgical evacuation. Various radiological features predict functional outcome after IPH. Hematoma volume greater than 60 cc, pronounced midline shift, infratentorial location, presence of hydrocephalus, and intraventricular hemorrhage have been shown to be prognosticators of death or poor recovery.3,4
Because hematoma volume carries such remarkable prognostic weight, it is essential to be familiar with the pragmatic technique used to estimate volume on the basis of CT scan appearance. This technique, known as the ABC/2 method and reliably validated in the literature, is simply based on the measurement of the three maximal diameters of the hematoma.5 It is illustrated on Figure 10-1. This measurement method can be applied using axial cuts of MRI sequences, but MRI-based measurements may lead to overestimation of lesion size.6
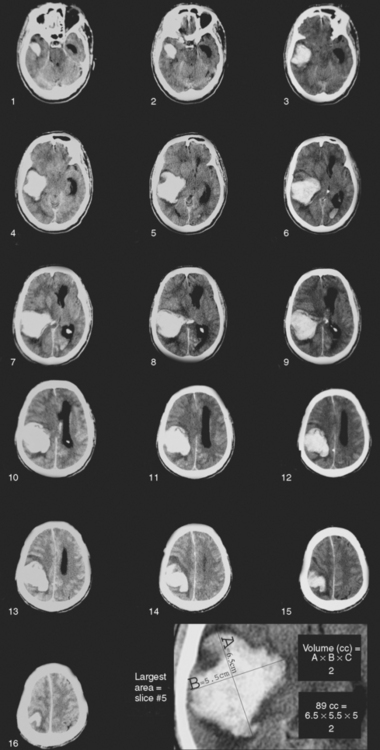
Figure 10-1 An estimation of hematoma volume (cc) can be calculated with the formula (A × B × C)/2.5 First, identify the slice with the largest area of intracerebral hematoma. A represents the longest diameter (cm) to be measured in the slice showing the largest hematoma size. B represents the longest diameter (cm) perpendicular to A. C represents the height of the hematoma, calculated by multiplying the number of slices involved by the slice thickness (cm). To measure the number of slices involved, comparisons should be made to the largest diameter slice using percentages: if the diameter of the hematoma in the slice is greater than 75% of the largest diameter in the scan, that slice is counted as one full slice; if the diameter of the hematoma in the slice is between 25% and 75% of the largest diameter in the scan, that slice is counted as half, if the diameter is less than 25% of the largest diameter, the slice is not counted. The figure exemplifies how hematoma volume can be estimated. Slice 5 was identified as the largest area of intracerebral hematoma. The longest diameter (A) is measured as 6.5 cm. The longest perpendicular diameter (B) is 5.5 cm. C can be measured by calculating the slice thickness (0.5 cm) by the number of slices involved (10) (0.5 × 10=5). Slices 1, 2, and 16 were not counted because the diameter of the hematoma in those slices was less than 25% of the largest diameter in the scan. Slices 3, 9, 12, 13, 14, 15 were counted as half (total of 3); slices 4, 5, 6, 7, 8, 10, 11 were counted as one (total of 7). Values A(6.5) × B(5.5) × C(5) were then multiplied and divided by 2 to reach an estimated volume of 89 cc.
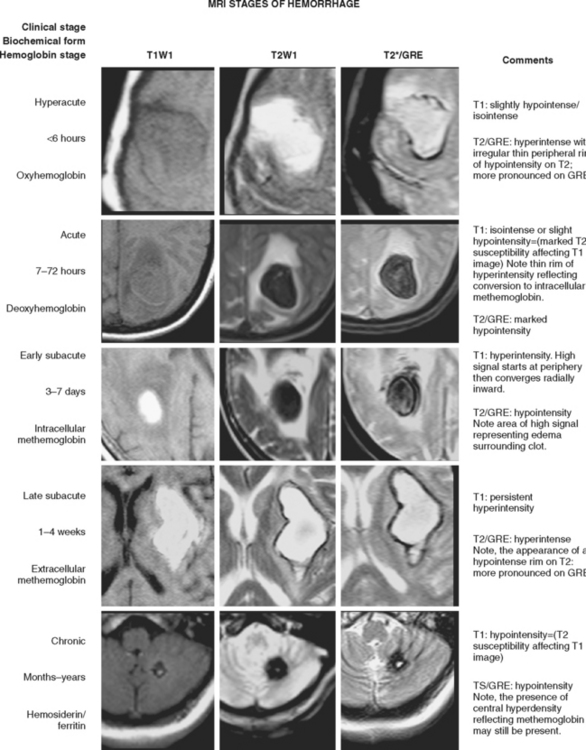
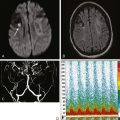
Traditionally, CT scan was considered the modality of choice for the diagnosis of hyperacute IPH.7 However, MRI has now been shown to be as accurate as CT scan for the detection of acute hematomas and offers greater sensitivity for the recognition and temporal staging of chronic hemorrhages.8–10 Susceptibility-weighted sequences, such as gradient-recalled echo (GRE) T2*-weighted imaging, are particularly useful for the detection of acute hemorrhage. GRE also allows optimal visualization of chronic hemorrhages and microhemorrhages.
Figure 10-2 depicts how changes in MRI appearance help determine the age of intraparenchymal hemorrhage.
Trying to establish whether there is an area surrounding the hematoma that is at risk for ischemia (penumbra) has lately been the focus of intensive research. Perfusion- and diffusion-weighted MRI, CT perfusion, single photon emission computed tomography (SPECT), and positron emission tomography have been used as tools to address this question. Most evidence thus far appears to indicate that hematomas are surrounded by a region of hypoperfusion that corresponds to a metabolically quiescent area.11–14 Serial imaging with perfusion-weighted MRI has shown that the hypoperfusion surrounding the hematoma resolves by the second week.15 However, some studies support the notion that hematomas may be surrounded by ischemic penumbra.11,16 Thus, more research is necessary to reach a final answer.
Determining the volume of perihematomal edema and following the evolution of edema over time has important practical implications. Perihematomal edema appears early and, on average, increases by 75% during the first 24 hours in patients with acute spontaneous IPH.17 The volume of baseline relative edema on initial CT scan correlates inversely with the subsequent accumulation of edema in the following hours of the first day.17 More interestingly, presence of greater volume of baseline relative edema (but not of absolute edema) has been found to be associated with better functional outcome at 3 months in patients with IPH without intraventricular extension.18 These observations await confirmation, and their meaning is unclear at present, but they nonetheless highlight the likely importance of edema formation in the outcome of patients with IPH. Late neurological deterioration (in the second and third weeks after acute IPH) from a delayed increase in edema volume is not infrequently encountered in practice and may provoke unexpected brain herniation. For that reason, patients with large hematomas may require serial imaging even many days after the bleeding. The pathophysiology of this late edema demands further investigation.
Classification of IPH is typically based on its anatomical location. The most common sites of origin of spontaneous IPH in the largest imaging series are19,20:
STRIATOCAPSULAR HEMORRHAGES
The striatocapsular region comprises the lenticular and caudate nuclei, the internal capsule, and the external capsule and subinsular area. The presentation and prognosis of striatocapsular hemorrhages depend on the epicenter of the bleeding. Chung and colleagues have proposed a detailed classification that divides these hemorrhages into six types, as listed in Table 10-1.24
TABLE 10-1 Anatomical classification of striatocapsular hemorrhages.
| Type | Site of bleeding | Arterial territory |
|---|---|---|
| Anterior | Caudate nucleus | Heubner’s artery |
| Middle | Globus pallidus or medial putamen | Medial lenticulostriates |
| Posteromedial | Posterior limb of internal capsule | Anterior choroidal |
| Posterolateral | Posterior putamen | Lateral lenticulostriates (posteromedial branches) |
| Lateral | External capsule, subinsular region | Lateral lenticulostriates (lateral branches) |
| Massive | Entire area (may spare caudate and anterior limb of internal capsule) | Variable |
Impaired level of consciousness at presentation and large hematoma size consistently predict poor functional outcome in patients with striatocapsular hemorrhage. Additionally, hydrocephalus and intraventricular extension are markers of large hematoma size in patients with putaminal hemorrhage (unlike in those with bleedings emanating from the caudate) and thus also forecast death or dependency.21–23 Capsular involvement is strongly associated with persistent hemiparesis, but weakness tends to be severe only in patients with larger hematomas.
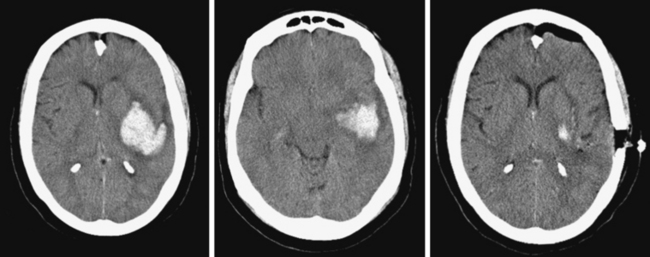
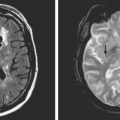
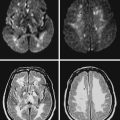
Lateral Putaminal Hemorrhage
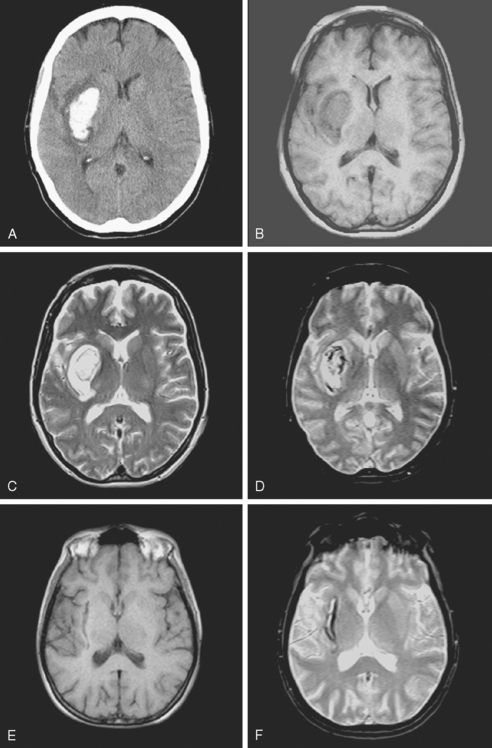
A 48-year-old Hispanic woman with recent diagnosis of hypertension presented with sudden onset of headache and left-sided weakness. Examination revealed an alert patient with a blood pressure of 210/124 mm Hg, mild right horizontal gaze palsy, and severe left hemiparesis. She appeared relatively unconcerned about her weakness and paid less attention to activity occurring over her left visual field. The patient had no complications during her acute hospitalization. Her CT scan of the brain revealed a right lateral putaminal hemorrhage, later confirmed on MRI (Figure 10-3, upper two rows). No underlying vascular anomalies or masses were found. Six months later, she had residual weakness but recovered the ability to walk independently with minimal support and had partial functional use of her left arm. Follow-up imaging is shown in the lower row of Figure 10-3.
Massive Striatocapsular Hemorrhage
Posterolateral Striatocapsular Hemorrhage
Middle-Posteromedial Striatocapsular Hemorrhage
Caudate Hemorrhage
LOBAR HEMORRHAGES
Lobar spontaneous IPH may be less frequent than is traditionally estimated. In recent years, enhanced technology, mainly in the form of MRI and highly improved angiographic equipment, has demonstrated that cases previously believed to be due to hypertension are actually caused by other conditions, such as occult vascular anomalies, venous thrombosis, or, most often, amyloid angiopathy. Secondary causes of IPH are discussed in the next chapter but must be carefully excluded before concluding that a lobar hemorrhage is spontaneous even in a hypertensive patient (Table 10-2). Neuroimaging is an extremely valuable and in fact irreplaceable tool to recognize the correct etiology of bleeding in patients with lobar IPH.
TABLE 10-2 Causes of lobar intracerebral hemorrhage other than primary arterial hypertension
| Cause | Diagnosis |
|---|---|
| Ruptured saccular aneurysm | Angiography |
| AVM | Angiography |
| Cavernous angioma | MRI |
| Cerebral amyloid angiopathy | MRI (GRE) |
| Tumor | MRI with gadolinium |
| Hemorrhagic transformation of ischemic infarction | CT, MRI with DWI |
| Cerebral venous thrombosis | MRV or angiography |
| Coagulopathy (intrinsic or iatrogenic) | History, blood work, CT |
| Recreational drugs (amphetamines, cocaine) | History, toxicology screening |
| Trauma | History, CT |
| Vasculitis | History, blood work, CSF, angiography, cultures if suspicion of infection |
| Ruptured mycotic aneurysm | Angiography, blood cultures, TEE |
| Moyamoya syndrome | Angiography |
AVM, arteriovenous malformation; CSF, cerebrospinal fluid; CT, computed tomography; DWI, diffusion-weighted imagery; GRE, gradient-recall echo; MRI, magnetic resonance imaging; TEE, transesophageal echocardiography.
Lobar hemorrhages tend to originate from the cortical-subcortical or gray-white matter junction and extend into the adjacent white matter. Any lobe can be involved, and the location and laterality of the hematoma determines the clinical manifestations. Seizures, typically of focal onset with secondary generalization, occur frequently occur at onset and during the acute phase.27,28 Multiple hemorrhage locations, simultaneous or sequential, may occur because of hypertension but must be regarded as a potential indicator of an alternative cause (mainly amyloid angiopathy in the elderly with cortical hemorrhages or cavernous malformations in young patients with deep hemorrhages).
The overall outcome of patients with lobar IPH is deemed to be comparatively more favorable than after ganglionic hemorrhages.29,30 Once again, one has to be cautious when analyzing older series reporting favorable outcomes because they may have included patients with more benign secondary hemorrhages in the group of spontaneous lobar IPH. Size is still the most powerful predictor of outcome, and intraventricular extension remains a prognosticator of reduced chances of survival and poor recovery.
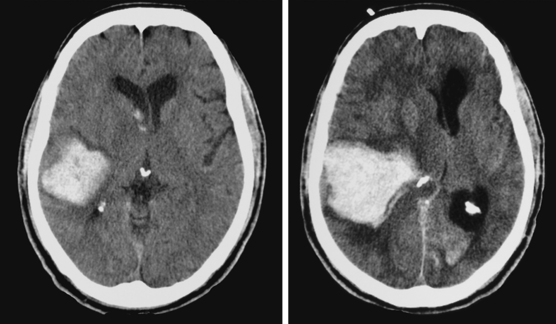
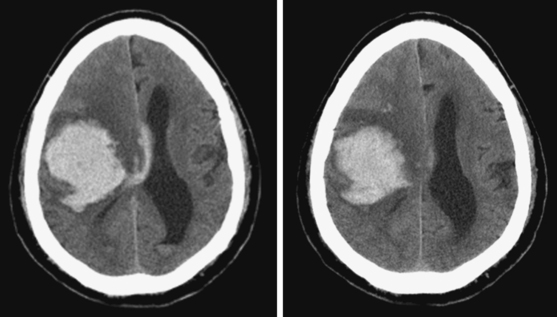
Hematoma Expansion
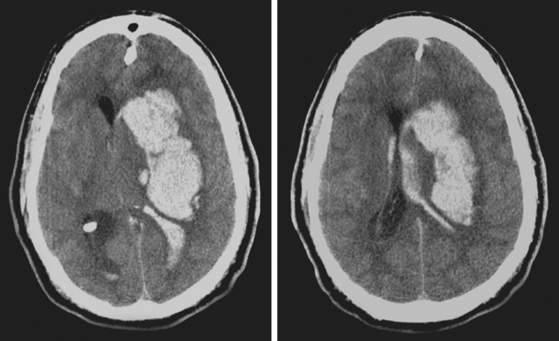
A 74-year-old African American man with long history of hypertension and poor compliance with prescribed antihypertensive medications was brought to the emergency department after being found wandering and limping on the street. Upon arrival, the patient’s blood pressure was 186/126 mm Hg. Neurological examination showed that he was confused and had scant verbal output, right gaze preference with decreased response to visual threat on the left, left hemiplegia, and left hypoesthesia. The degree of weakness had worsened in comparison with the first examination by the paramedics. CT scan showed a right frontoparietal hematoma (Figure 10-8, left) On the second hospital day, the patient was noticed to be slightly more lethargic but otherwise unchanged; repeat CT showed mild increase in the regional mass effect. In the morning of the third day, he became comatose because of massive hematoma enlargement (Figure 10-8, right). His brainstem reflexes were present, but he only responded with extensor posturing to maximal pain. After discussion with the family, further care was limited to comfort measures, and the patient expired hours later.
Hydrocephalus
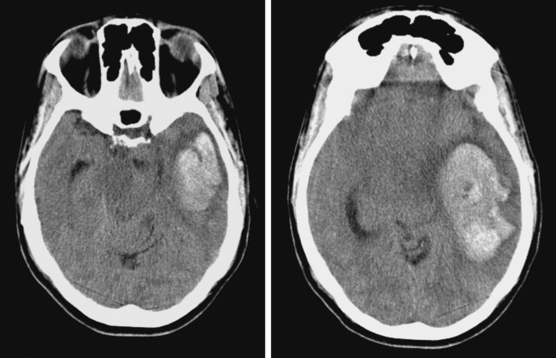
Temporal Hematomas
< div class='tao-gold-member'>
Related posts:
Stay updated, free articles. Join our Telegram channel

Full access? Get Clinical Tree


