Chapter 10 Ultrasound of Muscular Dystrophies, Myopathies, and Muscle Pathology
 Video 10.1
 Video 10.2
 Video 10.3
Ultrasound is a noninvasive, painless technique used to identify skeletal muscle pathology. Its use in evaluation of neuromuscular disease was pioneered by Heckmatt and Dubowitz in the early 1980s.1–3 These early studies focused on ultrasonic features of skeletal muscle in males with Duchenne’s muscular dystrophy. Since then, ongoing work has expanded the role of diagnostic imaging with ultrasound to myopathies of various etiologies. Ultrasound offers several advantages compared with other ancillary tests in the evaluation of muscle pathology. It is painless, inexpensive, and allows the examiner to screen large areas of muscle quickly. This can be of great assistance when considering biopsy or can direct a limited electromyographic examination to key muscle groups. Because it can be performed at the bedside, ultrasound examination of skeletal muscle provides a practical and effective supplement to the physical examination. This chapter describes the techniques of qualitative and quantitative ultrasound in the assessment and diagnosis of skeletal muscle pathologies.
The Normal Examination
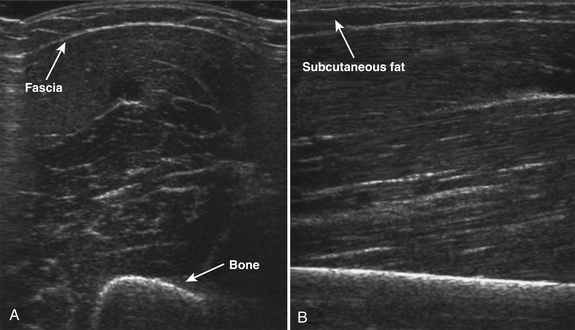
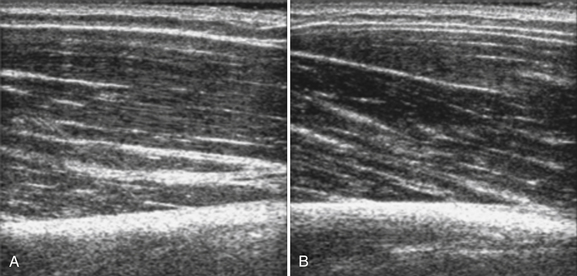
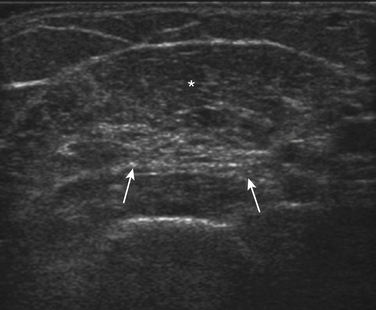
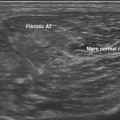
Normal muscle has low echogenicity (dark signal) interspersed with well-defined brighter punctate or curvilinear fibroadipose septa and tendinous fibrils (Fig. 10.1). Individual muscles are generally well defined by their surrounding bright fascia, which is thicker than the fibrous tissue in the muscle belly. At higher magnification there are multiple low-signal, dark areas separated by thin, medium-intensity, almost honeycombed structures. These structures have the appearance of individual muscle fibers; however, ultrasound has insufficient resolution to visualize individual muscle fibers. Rather, these echo-dark areas are likely bundles of muscle fibers with surrounding, brighter fibroadipose tissue. Bone is highly echogenic (bright signal) with a deep shadow beneath the bright, well-defined, crisp edge. Subcutaneous fat is typically of similar echogenicity to muscle and is interspersed with brighter, poorly organized ribbons of connective tissue. Near the myotendinous junction, the myofascial fibrils coalesce, resulting in increased echogenicity and higher anisotropy. It is best to consider these areas too variable for routine diagnostic screening and to focus on the bulk of the muscle belly.
The normal appearance of skeletal muscle varies with age, muscle group, and degree of fitness. In infants, muscle is particularly hypoechoic, with few myofascial planes in the muscle parenchyma. By 2 to 3 years of age, more myofascial planes develop, and they are generally homogeneously noted throughout the muscle parenchyma by 5 years of age.4 Muscle echogenicity increases more gradually, if at all, in early childhood and adulthood. No differences in echogenicity with gender are noted until the second decade, at which point men have slightly darker-appearing muscles than women.5 In later life, at about 60 years of age, muscle echogenicity increases more rapidly with advancing age.5,6 These changes vary with muscle group and are most pronounced in the biceps brachii and quadriceps muscles, particularly in men.5
Muscle bulk, which can be measured using calipers, cross-sectional area, or using three-dimensional (3D) volumetric reconstructions, also changes in complex ways throughout the life span with variations dependent on age, gender, and muscle group.7–9 Muscle thickness increases greatly in the first 20 years of life, with greater muscle thickness in men seen beginning in the early teenage years.10 Muscle thickness remains relatively stable in both genders for the next 20 years, with men having larger muscle thickness in the biceps, forearm flexors, and quadriceps. In older adults, muscle thickness in some muscles declines considerably. Between ages 40 and 90, muscle thickness decreases in the quadriceps by 30% in women and 50% in men; similar but less severe declines (20% to 30%) are seen in the biceps brachii. In contrast, in the sternocleidomastoid, tibialis anterior, and, in women, the forearm flexors, muscle thickness in adults remains more stable throughout the life span.
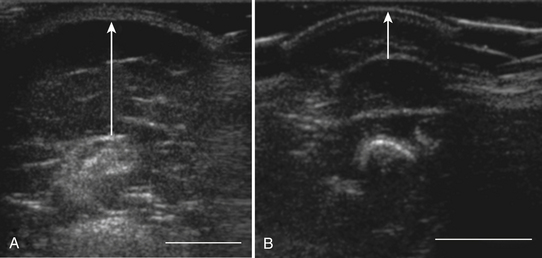
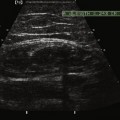
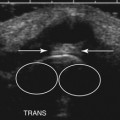
In addition to measuring muscle thickness, muscle atrophy can be assessed qualitatively by comparison of the thickness of muscle with subcutaneous fat, which is typically approximately 2:1 (Fig. 10.2).11,12 This method is helpful as a quick screening tool. However, the muscle-to-subcutaneous-fat ratio can be misleading in obese patients and in infants because the thickness of the subcutaneous fat changes rapidly through the first year of life.9,13 Thus, both quantitative and qualitative assessment of muscle thickness must be interpreted using norms adjusted for patient characteristics, especially age and body habitus.
Quantitative Ultrasound of Skeletal Muscle
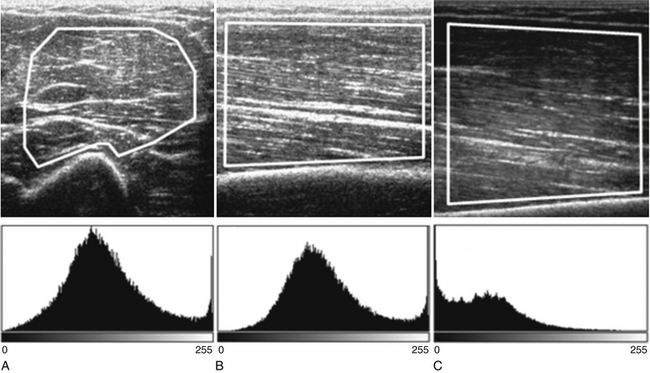
Both qualitative and quantitative assessments of skeletal muscle ultrasound can be used to identify skeletal muscle pathologies.14–16 One study of qualitative ultrasound assessment in children showed sensitivities and specificities for neuromuscular pathology as high as 81% and 96%, respectively.16 A limitation of qualitative ultrasound analysis is that the accuracy of assessment depends on the experience of the examiner. Quantitative assessment of skeletal muscle using ultrasound is simple to perform, does not rely on subjective interpretation, and can be reproduced reliably between examiners.17,18 One technique, described by Pillen and colleagues, is to analyze gray scale pixel values, among other measurements, of the ultrasound signal.19 The ultrasound image is imported into an image analysis software program, and a region of interest is drawn within the imaged muscle. Many properties of the image can be measured, including the mean pixel value on the gray scale from black (0) to white (255). Using this technique, Pillen and colleagues have devised protocols for discriminating between children with and without neuromuscular disease, with positive and negative predictive values of 91% and 86%, respectively.14 This technique does not rely on the expertise of the examiner and allows for greater differentiation of mildly abnormal echo patterns than qualitative assessment.20
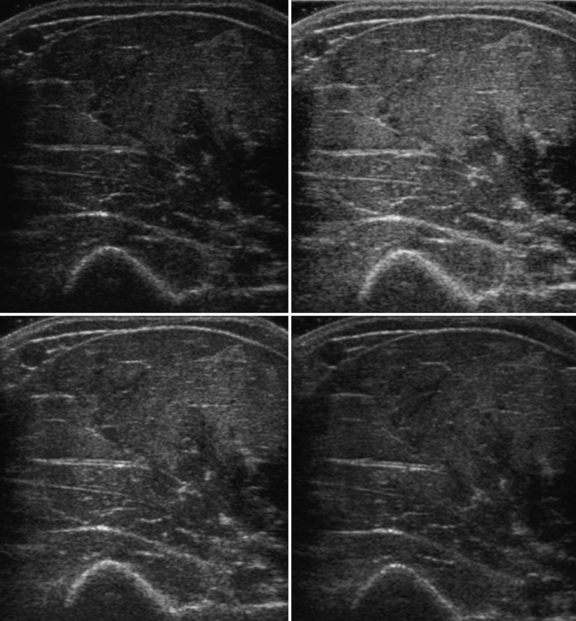
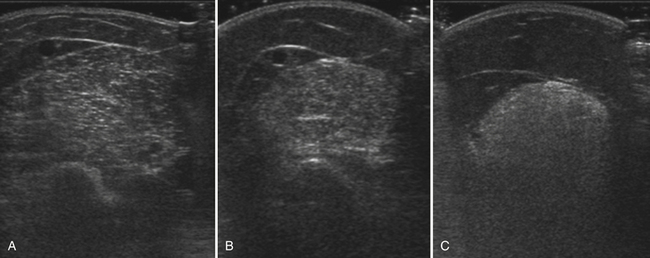
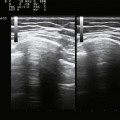
Several factors are essential to minimizing additional variation because of machine-dependent factors. Machine settings must be held constant with each image, because the gray scale pixel value will vary with changes in gain, probe frequency, and compression settings (Fig. 10.3). In addition, it is important to configure the ultrasound system to provide an approximately linear relationship between the received backscatter values and the displayed gray scale values.21 Otherwise, a change in the displayed gray scale value may not consistently reflect an equivalent degree of change in the received backscatter. This can be done by selecting the most linear compression curve when choosing the display settings. Very black or very white images may not fall within the linear portion of the compression curve. If possible, the limits of the linear range relating gray scale values to received backscatter should be identified and the gain should be adjusted so that images fall within this range. In practice, because muscle is generally very dark, the author has found that when quantifying images, a high gain setting is often needed to produce an image of the muscle with an average gray scale value that is not dominated by black (0) gray scale pixel values (Fig. 10.4).
With advances in ultrasound image processing techniques, including the use of differential gain amplification that is often hidden from the user, standardizing the ultrasound system and identifying a linear compression curve to quantify gray scale signal is more challenging. Additional techniques, such as backscatter analysis, require more advanced processing, but are promising for identification and quantification of pathology. Backscatter analysis of skeletal muscle is a quantitative assessment related to gray scale analysis that estimates the intensity of the received backscatter signal from the displayed gray scale pixel value.21 Backscatter analysis measures the estimated received signal amplitude in decibels. Ultrasound systems can be configured to estimate the backscatter value from the displayed gray scale21 or in some ultrasound systems can be measured using proprietary software. This approach has been used in the analysis of cardiac muscle and is reproducible between machines if specific imaging system configurations and a common reference are known.22–24
In addition to gray scale and backscatter levels, other ultrasonic properties of skeletal muscle can be measured. Analysis of entropy and fractal dimension measures the shape and pattern of the ultrasound waveform and can detect differences between healthy and myopathic skeletal muscle.25,26 Entropy measurements also distinguished between prednisolone-treated and untreated groups of muscular dystrophy mice.27 Measurement of pennation angle and muscle fiber length quantify details in the structural architecture of the muscle and are related to muscle strength and function.28,29 These techniques may provide further insights into the associated structural changes of muscle pathologies.
Technical Considerations in Skeletal Muscle Ultrasound
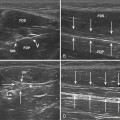
The probe orientation and muscle position can also drastically alter the image appearance. The ultrasonographic brightness of the muscle is critically dependent on anisotropy, or the relationship between the angle of the probe and the underlying pennation angle of the myofascial bands (Fig. 10.5). Thus, in a bipennate muscle such as the tibialis anterior, the superficial and deep portions of the muscle will alternately appear bright or dark as the probe angle is adjusted. Optimal positioning for transverse images of the muscle is to maintain a probe angle that is perpendicular to the bone. This yields an image of the bone with a crisp and bright reflection. The effect of anisotropy on different layers can also be minimized by imaging the muscle in the longitudinal plan, with the probe in line with the muscle fiber orientation. Imaging muscles in both transverse and longitudinal planes is thus recommended. Muscle position (flexed or extended) affects pennation angle and therefore also affects muscle appearance on ultrasound. Flexed muscle is slightly darker than extended muscle (Fig. 10.6).21 When evaluating the ultrasound appearance of muscle, it is important to account for these geometric considerations.
Protocol for Skeletal Muscle Evaluation of Neuromuscular Disease
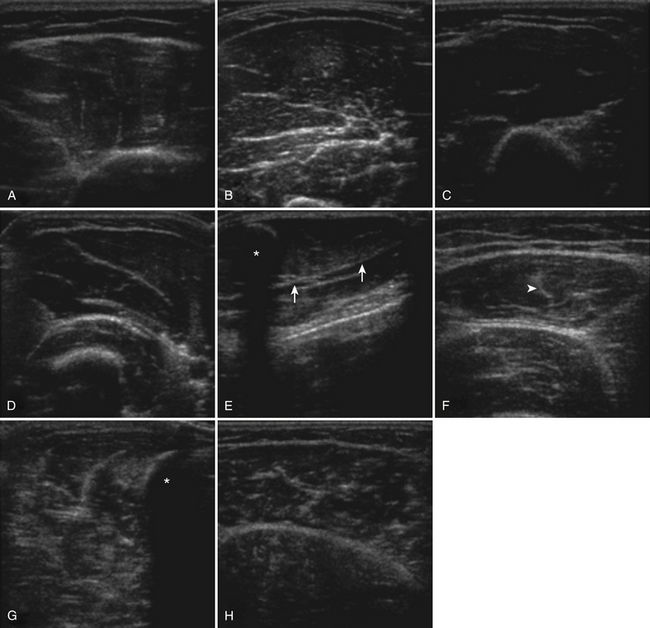
The approach to the ultrasound evaluation of the patient with a suspected neuromuscular disease should focus on the static and dynamic appearance of the muscle parenchyma, fascia, and blood flow. The pattern of muscle involvement, with comparison of muscles side to side, distal to proximal, and with surrounding tissue, should also be examined. The protocol the author uses includes muscles that are typically hypoechoic and relatively easy to visualize. This helps improve the identification of subtle increases in echogenicity. The author typically images the deltoid, elbow flexors (biceps brachii and brachialis), triceps brachii, extensor carpi radialis and brachioradialis, flexor digitorum superficialis and profundus, first dorsal interosseous, rectus femoris, tibialis anterior, and the medial and lateral gastrocnemius (Fig. 10.7). Several details of each muscle warrant mention. The normal deltoid can appear very echogenic, especially in older women, and its appearance varies greatly with positioning of the probe along its length. Similarly, the vastus intermedius is often brighter compared with the lateralis, medialis, and rectus femoris. For this reason the author avoids attributing moderately bright echoes in the deltoid and vastus intermedius, when seen in isolation, to pathology. The brachialis is often brighter than the biceps brachii, which in turn is slightly brighter than the triceps brachii. The extensor carpi radialis and the brachioradialis are closely approximated and can appear only partially divided by an incomplete fascia. The first dorsal interosseous is typically brighter in the deeper portion of the muscle. The rectus femoris in the proximal one half of the muscle is bisected in the superficial aspect by a single fascial plane (the central fascia), which should be well delineated in normal muscle. In some normal individuals the lateral gastrocnemius can be slightly more echogenic than the medial gastrocnemius. Finally, the tibialis anterior, like the gastrocnemius, is relatively fibrous and therefore somewhat echogenic. The tibialis anterior typically is rounded as it attaches along the tibia. Subtle atrophy can appear as a flattening of this area.
Imaging modalities should include transverse and longitudinal orientations, M-mode for evaluation of muscle movements, and power Doppler imaging to assess blood flow. To minimize the effect of anisotropy, this author commonly evaluates at least the biceps brachii and rectus femoris in the transverse and longitudinal planes and if muscle movements are seen, includes M-mode evaluation to better characterize the size and frequency of the movements.
Muscle Pathology Seen with Ultrasound in Neuromuscular Disease
Ultrasound of skeletal muscle can detect pathology, characterize the pattern of muscle involvement, and assist in the selection of biopsy sites. Muscle pathology generally appears as increased echogenicity in the muscle parenchyma.2,11 Normal muscle has low echogenicity interspersed with brighter, more echogenic, connective tissues. In neuromuscular diseases the muscle is brighter (more echogenic). When assessing for subtle pathology in muscle, focus on the appearance of the muscle parenchyma between the connective tissue—in normal muscle this should still appear dark. Attenuation also increases with pathology, resulting in a decreased bony reflection and poorer visualization of deep tissues.3,30 The degree of muscle abnormality on ultrasound can be graded qualitatively using Heckmatt’s criteria (Table 10.1).3 As muscle signal increases, the underlying bone echo becomes less crisp and bright and, in more prominent pathologies, cannot be seen at all. The increase in muscle echogenicity is likely because of increases in the fat18,30,31 and fibrous32 content of the muscle. Thus, ultrasound is particularly sensitive for identifying pathology characterized by increases in fat and fibrosis, such as in the dystrophinopathies.11,16,19 Decreased echogenicity is uncommonly seen and likely represents edema or increased blood flow in the muscle.
Table 10.1 Heckmatt’s Visual Rating Scale of Skeletal Muscle Ultrasound
| Grade | Description |
|---|---|
| I | Normal |
| II | Increased muscle signal with preserved, distinct bone echo |
| III | Marked increase in muscle signal with reduced bone echo |
| IV | Very increased muscle signal and complete loss of bone echo |
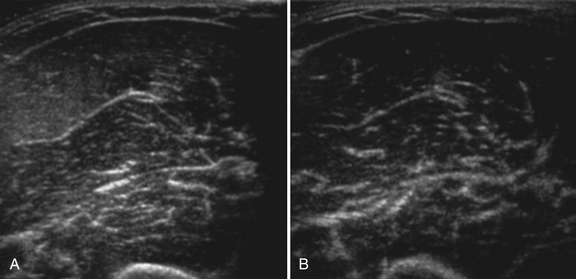
Myogenic pathology has features on ultrasound that distinguish it from neuropathy. Myopathic muscle parenchyma has grainy-appearing increased echoes. The muscle appears as if it has been smudged with a pencil eraser, rather than the normal dark muscle fibers interspersed with crisp, bright echoes from the fibroadipose tissue. The echoes in myopathies are most often homogeneously increased throughout the muscle (Fig. 10.8).11,12,15 In contrast, neuropathic changes appear as heterogeneous involvement within the muscle, with areas of affected and spared regions (Fig. 10.9).12,15,33 Neuropathic changes in muscle result in increased echoes in a streaky, linear pattern against a more normal, dark background. Rather than appearing smudged, as in myopathy, the increased echoes in neuropathic muscle look like streaks on a glass window.
Related posts:
Stay updated, free articles. Join our Telegram channel

Full access? Get Clinical Tree


