Abstract
In women at high risk for development or recurrence of breast cancer, annual MRI screening is recommended. The current screening protocol relies heavily on information obtained from dynamic contrast-enhanced MRI, utilizing gadolinium-based contrast media (GBCM) which carry some risk. Currently, screening participation in the high-risk population can be as low as 50%, and a significant percentage of women quote use of intravenous GBCM as the main concern. Thus, development of a non-contrast enhanced breast cancer screening MRI protocol would be a significant advancement in breast cancer prevention. We discuss four non-contrast enhanced MRI techniques which hold potential for forming the basis of a screening breast MRI protocol: diffusion weighted imaging (DWI) which provides information on movement of water molecules within tissue; high spectral and spatial resolution (HiSS) MRI which provides information on the spectral structure of the water resonance in small voxels; arterial spin labeling (ASL) which can be used to quantify perfusion; and electrical properties tomography (EPT) which provides information on conductivity and permittivity of tissue. These techniques have been studied in the context of breast lesion characterization, with promising results. They provide lesion information that can be complementary to that obtained from contrast enhanced screening MRI examinations, often improving accuracy, and further technical development may also increase their utility in breast lesion detection. An effective non-contrast screening MRI protocol could be offered in non-hospital setting, lowering the barriers of cost, risk, and inconvenience.
11 Advanced Breast MRI Techniques
11.1 Non–Contrast-Enhanced Breast MRI
In this chapter, we discuss four non–contrast-enhanced breast magnetic resonance imaging (MRI) techniques: diffusion-weighted imaging (DWI), high spectral and spatial resolution (HiSS) MRI, arterial spin labeling (ASL), and electrical properties tomography (EPT). Although none are currently included in the Breast Imaging Reporting and Data System (BIRADS), these techniques have been studied as auxiliary tools for breast lesion characterization, with promising results. They have the potential to provide complementary information on lesions identified on contrast-enhanced screening MRI examinations, which can be used to rule out malignancy and thus increase the accuracy of the examinations. There are additional challenges in breast imaging that these sequences could potentially address. A major advancement would be the development of a non–contrast-enhanced breast cancer screening MRI protocol. Thus, the techniques discussed here should also be evaluated in the context of lesion detection. The current breast cancer screening MRI protocols are based on dynamic contrast-enhanced MRI (DCE-MRI), which requires the use of gadolinium-based contrast media (GBCM). The use of GBCM comes with established clinical risks and introduces barriers to uptake of MRI screening examinations in the high-risk population. These will be discussed briefly here.
11.2 Risks Inherent to Use of Gadolinium-Based Contrast Media
The rates of immediate adverse reactions to GBCM have been shown to be low, but non-negligible. 1 The adverse reaction rate is variable depending on the contrast agent used, and is generally below 1%. 2 However, it was observed to be as high as 2.4% for gadopentetate dimeglumine (Magnevist®, Bayer Healthcare). 3 The most frequent adverse reactions were nausea and headaches at the time of injection. 2 , 4 , 5 , 6 Less frequently, extravasation of intravenous (IV) contrast can occur during power injection of contrast media, with a reported incidence of 0.1 to 0.9%, 7 , 8 , 9 and can cause severe tissue damage, such as compartment syndrome, skin necrosis and ulceration. In addition, serious allergic reactions sometimes occur as a consequence of GBCM administration, including anaphylactic shock 10 , 11 , 12 , 13 , 14 , 15 , 16 , 17 , 18 which can result in death. 17 The occurrence of such allergic reactions to GBCM is unpredictable. However, it is known that individuals with a history of allergies, such as food or other medication allergies, and those with features of atopy, such as asthma, dermatitis, and urticaria, are at higher risk. 15 , 19
Nephrogenic systemic fibrosis (NSF) is a rare but serious adverse reaction to GBCM that typically occurs within days to months following administration. 20 , 21 Early symptoms and signs include skin discoloration, swelling, and pain. Later, skin and subcutaneous sclerosis, induration, inflexibility, hair loss, shiny skin surface, brownish discoloration, and skin thickening can occur. The skin thickening can lead to reduced joint movement and flexion contractures of the limbs, resulting in significant disability. 21 Although initially introduced to clinical practice as a safer alternative to iodine-based contrast agents for patients with compromised kidney function, in 2006 GBCMs were recognized as a trigger for NSF in this population. 20 , 21 Consequently, guidelines for administration of GBCM were introduced by the Food and Drug Administration (FDA), the European Society of Urogenital Radiology, and the American College of Radiology, with all three organizations recommending patient screening for chronic kidney disease and acute renal failure, as well as transition to low-risk GBCM. 22 Published studies from several academic medical centers indicated that no new NSF cases have been reported following the implementation of these guidelines. 20 However, as the risk cannot be absolutely excluded, NSF is still a deterrent to some women who would otherwise have considered a screening breast MRI. 23
Beginning in 2014, anecdotal evidence of long-term gadolinium (Gd) accumulation in the dentate nucleus (DN) and globus pallidus (GP) in patients with normal renal function began to be reported in literature. 24 , 25 Retrospective studies conducted since continued to demonstrate this effect, 26 , 27 , 28 and have included histological confirmation. 29 The Gd deposition can be evidenced as hyperintensity of the DN or GP on unenhanced T1-weighted MRI images (Fig. 11‑1). 22 The dependence of Gd deposition on the type of GBCM is established and consistent with known data on GBCM stability. 26 , 27 , 28 An in vitro study established that after a 15-day incubation period, the release rate of linear nonionic GBCMs was 20 to 21%, in contrast to 1.1 to 1.9% for linear ionic GBCMs, and under 0.1% for macrocyclic GBCMs. 30 To put these findings in perspective, there have been no unequivocal reports of clinical symptomatology due to Gd deposition in the brain or elsewhere in the body. However, caution is warranted. The U.S. FDA currently recommends that the need for GBCM be assessed and the minimum effective dose be used, and that use of a macrocyclic GBCM, rather than a linear agent be considered. 31 As of May 2018, the FDA additionally requires that all MRI centers provide a Medication Guide the first time an outpatient is administered any GBCM. 32 The European Medicines Agency has restricted the use or suspended the authorization of most linear GBCM since July 2017. 33

11.3 Underutilization of Screening Breast MRI in High-Risk Women
The American Cancer Society currently recommends that women who are at high risk for breast cancer (20–25% lifetime risk or higher) undergo annual breast MRI exams in addition to annual screening mammograms. 34 While the use of breast MRI has increased approximately 18-fold between 2000 and 2011—to 105 per 10,000 women 35 —in a sample of women enrolled in two non-profit health insurance plans, several studies have found that utilization among women at high risk is low. 35 , 36 , 37 In a study by Stout et al that quantified this utilization, it was found to be as low as 50%, 35 and in a study by Berg et al, only 58% of high-risk women who were offered an MRI screening examination agreed to participate. 23 Berg et al examined the data acquired as part of the MRI sub-study of the ACRIN 6666 trial on screening breast ultrasound in women with high breast cancer risk, and compiled a list of primary reasons why these women declined to undergo screening MRI examinations (Table 11‑1). 23 While the most frequent reason for screening MRI refusal was claustrophobia, a significant percentage of women (7.1%) quoted use of intra-venous (IV) GBCM as the main concern. In addition, the 7.6% of women who had contraindications for an MRI exam included women who were contraindicated for GBCM use because of lack of IV access and/or impaired kidney function. A further 24.5% cited time, scheduling, and travel constraints—basically, inconvenience—as the primary reason. Other issues, such as concern about unnecessary follow-up procedures for lesions that will ultimately be found to be benign and inaccurate perception of risk 38 were also recorded.
Primary reason for screening MRI refusal | |
Claustrophobia | 25.4% |
Time constraints and/or other priorities | 18.2% |
Physician would not provide referral or did not believe MR was indicated | 9.2% |
Patient not interested or did not want to participate | 7.8% |
Patient had contraindications for MRI examinations | 7.6% |
Patient did not want to undergo IV injection | 5.7% |
Patient concerned about additional biopsies and testing that MRI may indicate | 5.3% |
MRI scheduling constraints | 4.1% |
Travel-related concerns | 2.2% |
Gadolinium intolerance or fear of reaction, including nephrogenic systemic fibrosis | 1.4% |
Unknown | 1.2% |
If the low MRI screening participation rate in the high-risk group increased, this group would reap great benefits via reduction in mortality and morbidity. Obviously, women who cited GBCM use as their primary concern would benefit immediately from a non–contrast-enhanced screening MRI protocol. In addition, such a protocol would also reduce the barriers of cost and inconvenience. By forgoing the use of a contrast agent, several current components of the breast MRI examinations would be eliminated: establishing IV access, administration of GBCM, kidney function screening and testing, need for medical supervision, and need for access to emergency procedures in case of a serious reaction. These changes would significantly lower the cost and allow screening breast MRI examinations to be offered in a nonmedical setting. Today, screening X-ray mammography is often offered in shopping malls. By utilizing noncontrast protocol and teleradiology, a similar approach could be applied to screening breast MRIs. This would go a long way toward overcoming the inconvenience barrier to access by reducing travel times and allowing easier scheduling. The lower cost would also figure in more general cost-benefit analyses, possibly enlarging the pool of women who would be offered and could benefit from MRI screening.
11.4 Diffusion-Weighted Imaging
11.4.1 Introduction to Diffusion-Weighted Imaging
The first applications of diffusion-weighted imaging (DWI) came in the 1990s, in the differential diagnosis of ischemic versus hemorrhagic acute stroke. It has since been used for a variety of brain disorders, primarily white matter disorders, as well as for monitoring therapy response in brain tumors. The first applications in cancer imaging outside the brain came in the early 2000s, 39 , 40 , 41 , 42 and included early breast cancer imaging. 43 , 44 , 45 , 46 , 47 , 48 Today, DWI is well established as a breast MR imaging technique, particularly as a lesion diagnostic tool, but also for cancer imaging in general. 49
Diffusion is displacement due to random brownian motion of a particle within a volume, such as a water molecule within an imaging voxel. In tissue, diffusion occurs within and across various water compartments, such as intra- and extracellular compartments. In the intracellular compartment, diffusion is restricted, as water molecules diffuse across cell membranes into the extracellular compartment relatively slowly and are thus effectively trapped within cells on the timescales relevant to DWI. In the extracellular compartment, diffusion is hindered—not restricted, but still slower than free diffusion—as water molecules navigate proteins and other macromolecules present in this compartment, as well as boundaries of cells that reduce the available volume and give it an irregular shape. Thus, DWI can yield information on properties and relative volume of different water compartments.
Although there is no undisputed consensus on the appropriate biophysical interpretation of in vivo quantitative measures of water diffusion, an intuitive model describing restricted intracellular diffusion coupled with hindered extracellular diffusion is often accepted. 49 Because the restricted-diffusion intracellular signal contributes little to the overall diffusion-induced signal loss, DWI is primarily sensitive to extracellular diffusion. A reduced rate of extracellular diffusion is generally interpreted as a sign of a reduced extracellular volume, which may be due to higher cellularity—a hallmark of cancerous lesions, as illustrated in Fig. 11‑2. The diffusion rate has an inverse relationship with cellularity, and thus with tumor grade, and DWI has emerged as a useful tool for cancer detection or lesion characterization.

DWI Pulse Sequence
Today, DWI is most frequently implemented as a spin-echo echo-planar imaging (SE-EPI) sequence. We will review here the elements of the SE sequence, the adaptation of the SE sequence for diffusion weighting, and finally the inclusion of the EPI component for acceleration of imaging. The SE sequence (Fig. 11‑3, top) excites spins into the transverse plane using a 90° pulse and, after spins have dephased due to local gradients over time TE/2, an 180° pulse is applied. The 180° pulse causes spins to regain phase coherence under unchanged local gradients, until an echo is formed at TE. In DWI, an additional strong linear diffusion-encoding gradient G diff is used to additionally dephase the spins during the time to TE/2 (Fig. 11‑3, middle). After the 180° RF pulse, a second diffusion gradient pulse G diff is applied, matched in intensity and polarity to the first. The net phase change due to application of the two diffusion-encoding gradients is zero for spins that have not changed position along the diffusion-encoding direction. For spins that have drifted over time Δ, the net phase change is non-zero and is dependent on the displacement along the diffusion-encoding direction. This results in a residual dephasing due to the random diffusive motion of the water molecules and a reduction in the measured signal (Fig. 11‑3, bottom). The amount of diffusion encoding is quantified via parameter b, which is proportional to G d 2δ2(Δ- δ/3) and expressed in s/mm2. Stronger diffusion encoding b and higher diffusion rate (D) lead to higher residual dephasing at TE and thus lower DWI signal. In the simplest model, DWI signal decays exponentially with b, with a decay constant D:
where S DWI is the MRI signal of the diffusion-weighted sequence, S SE is the signal of the spin-echo sequence on which the diffusion-weighted sequence is based, T1 and T2 are the longitudinal and transverse relaxation constants in the given voxel, and TR and TE are the sequence repetition and echo times. As evidenced in equation (1), in addition to the exponential decay with b, S DWI also decays exponentially with TE. In clinical DWI, the shortest possible TE is typically selected to maximize signal-to-noise ratio (SNR). However, there is evidence that the observed diffusion decay constant can vary with TE, with longer TE values yielding better diagnostic performance. 50

To allow fast DWI, the SE sequence is modified so that an EPI echo train, centered around TE, is acquired. The use of the SE-EPI sequence makes DWI susceptible to artifacts generally associated with EPI, such as blurring and spatial distortion. Decreasing effective interecho spacing by increasing bandwidth results in less chemical shift artifact and less image distortion. 51 Parallel imaging can achieve a similar effect and shorten the echo train to reduce artifacts and spatial distortion, but there is an increase in noise that is nonlinear and spatially inhomogeneous. 51 , 52 Partial Fourier imaging is commonly applied to shorten the EPI echo train, though with an SNR penalty. Shortening the echo train using alternative k-space filling trajectories, such as in segmented EPI, results in lower artifact level but increased acquisition times. 52 Thus, imaging parameters should be optimized to achieve balance between artifact levels, SNR, and imaging times. Partridge and McDonald provide an excellent review of protocol optimization considerations. 53 Table 11‑2 shows DWI sequence parameters currently used for breast MRI at the University of Chicago Medical Center, at 1.5 and 3 T.
1.5T | 3.0T | |
Pulse sequence | SE-EPI | SE-EPI |
orientation | Axial | Axial |
Field of view | 300 × 300 × 200 mm3 | 300 × 300 × 200 mm3 |
Spatial resolution | 2.5 × 2.5 × 2.5 mm3 | 2 × 2 × 2.5 mm3 |
Rest slab | No | Over heart |
TR / TE | 15000 / 63 ms | 13000 / 64 ms |
EPI echo train length | 43, single shot | 53, single shot |
Fat suppression / inversion delay | SPAIR / 90 ms | SPAIR / 70 ms |
Fat-water separation / Bandwidth | 6.4 pix / 34.1 Hz | 15.8 pix / 27 Hz |
Partial Fourier factor | 0.62 | 0.62 |
b values (number of acquisitions) | 0 (1), 50 (1), 800 (2) | 0 (1), 50 (1), 800 (2) |
Number of averages | 2 | 2 |
Coil | 16 channel | 16 channel |
SENSE | 3 in RL direction | 3 in RL direction |
Acquisition Time | 5′14″ | 4′33″ |
Technical Considerations
The diagnostic value of high b-value images (b > ~500 s/mm2) is derived from the fact that cancer lesions appear very bright due to hindered diffusion in the tissue. However, voxels with high T2 values have intrinsically high signal compared to the background, which propagates to the high b-value DW image and mimics the appearance of cancer (Fig. 11‑4). This effect is called “T2 shine-through” and can lower the diagnostic value of the DW images. In order to differentiate high T2 tissue from cancer, DW signal dependence on b is modeled quantitatively to eliminate T2 contrast—i.e., D is calculated (see equation 1). As “D” is commonly used to represent free water diffusivity, in tissue this constant is instead termed apparent diffusion coefficient, or ADC. ADC is a quantitative measure of overall diffusive motion in the tissue and is lower in regions with higher cellularity, such as cancer. 54 In principle, ADC can be calculated from signal intensity acquired at b = 0 s/mm2 and one higher b value, typically in the 800 to 1500 s/mm2 range:
where S b =0 and S b >0 represent DWI signal measured at b = 0 s/mm2 and at some higher b value, respectively.

With equation (2), the question of choosing the optimum b > 0 s/mm2 value is introduced. When a single high b value DW image is acquired, there is an obvious tradeoff between SNR of the image, and accuracy of the ADC calculation—higher b values improve estimation of ADC, but the resulting SNR penalty degrades it. Additionally, there is a tradeoff between SNR (higher at low b values) and contrast-to-noise ratio (CNR, higher at high b values) in b > 0 s/mm2 images, because accurate outlining of the lesion is necessary for accurate measurement of ADC. To improve SNR, manufacturers often provide options to acquire high b value images with a higher number of averages than those at b = 0 s/mm2.
Additionally, the decay of the DWI signal with b is often not mono-exponential, and thus ADC, as calculated from equation (2), can be dependent on the choice of the high b value (Fig. 11‑5). Microperfusion is well accepted as a source of incoherent motion and hence of signal loss at very low b values (up to ~100 s/mm2). In fact, the fast decay of DWI signal at low b values has been studied as a method for noncontrast quantification of tissue perfusion via intra-voxel incoherent motion (IVIM) modeling. 55 , 56 , 57 Microperfusion is thought to be negligible in breast parenchyma 58 , 59 but is obviously of significance in tumors. 60 To exclude perfusion effects and eliminate the dependence of ADC on the single high b value selection, DWI is now commonly acquired with multiple b values, and only b values larger than about 50 to 100 s/mm2 are used to calculate ADC via an exponential fit.

Uniform fat suppression is crucial for reduction of artifacts, and modern scanners with dual and multiple transmit coils can achieve high-quality fat suppression. Fat suppression implementation in DWI varies by manufacturer, but generally relies on a spectrally selective fat suppression (90°) or inversion (180°) RF pulse. Spectrally selective excitation performs better at 3 T, due to the better spectral separation of water and fat peaks, and thus better fat suppression can be achieved at 3 T. Proper positioning of breast MRI patients to avoid tissue folds can minimize local susceptibility differences and B0 gradients that degrade fat suppression and is thus very important.
Gd-based contrast agents act to shorten the T2 to some extent in the extracellular space, but not in the intracellular space, potentially compromising ADC measurements. Currently, DWI is typically acquired after the DCE-MRI sequence, to avoid patient fatigue and resulting motion artifacts in the DCE-MRI sequence. However, the differences in dose and timing of the contrast relative to the DWI acquisition introduce variability that is difficult to control or predict. To achieve standardization and improve quantitative interpretation of DWI, precontrast imaging is preferable.
A recent study introduced the concept of synthetic DWI, which uses ADC and T2 maps to eliminate T2 shine-through and extrapolate signal from a lower b (e.g., b ≤ 800 s/mm2) DW image to generate a higher b (e.g., b = 1,000 s/mm2) DW image. 61 This approach seems intuitively beneficial: it uses high SNR images to generate high CNR images with presumably higher diagnostic utility. However, image contrast at very high b values can be intrinsically different from that at lower b values. Even after perfusion effects are taken into account, the pure diffusion signal decay is itself not monoexponential, due to the presence of multiple water compartments in the tissue. Thus, synthetic DW images obtained via extrapolation from lower b values should be clearly identified and distinguished from DW images that were truly acquired at a very high b value. The authors of the study do stress this point in the discussion and use short extrapolation ranges where contrast is unlikely to change significantly. However, as this technique gains acceptance and surely becomes used for ever farther extrapolation, it is important to keep this distinction in mind.
Currently, the main limitation of DWI is the low resolution necessary to achieve clinically realistic imaging times. This is relevant when non-mass lesions suffer from partial volume ADC dilution, and higher resolution DWI would allow their better characterization. In addition, calculating an ADC map from a fixed optimal TE value and fixed optimal b ≥ 100 s/mm2 values, as well as precontrast acquisition of DW images, would allow for standardization of ADC measurement and a more confident use of ADC values for lesion diagnostics. This would aid ongoing work on DWI standardization in acquisition and postprocessing methods. 62 , 63 , 64 , 65 As of today, BIRADS mainly relies on the description of T1-weighted, contrast-enhanced MR images. Standardization would allow future inclusion of DWI characteristics in BIRADS description of breast lesions.
Characteristics of Normal Fibroglandular Tissue
Fig. 11‑6 shows DWI images and ADC maps of two patients with negative findings, acquired at 1.5 and 3.0 T. Several studies have attempted to describe the range of ADC values of normal parenchymal tissue and the variations due to physiological factors. 66 , 67 , 68 , 69 , 70 , 71 Of most importance is the variation during the menstrual cycle, though variation due to lactation and menopausal status were also examined. There is a nonsignificant trend toward lower values and thus presumably lower contrast with cancerous lesions during week 2 of the menstrual cycle, 71 but these changes are likely too small to affect the utility of DWI. 69 , 72 Although large variations are observed with age or menopausal status, 68 , 73 and lactation, 74 where DWI may improve clinical utility over DCE-MRI alone, overall, the range of ADC values in normal parenchyma remains above that of cancerous lesions. Therefore, DWI can be expected to be diagnostically useful at any age or time during the menstrual cycle. 72 Reported mean ADC values in normal breast parenchyma range from 1.51 to 2.09 × 10– 3 mm2/s. 53

Characterization of Breast Lesions
The clinical utility of DWI is derived from the fact that ADC values in cancerous lesions are lower than those in benign lesions and normal fibroglandular tissue. Fig. 11‑7 and Fig. 11‑8 show examples of a benign (fibroadenoma) and a cancerous (IDC grade III) lesion, in DW images and ADC maps. Similarly, Fig. 11‑9 illustrates DWI of multiple metastatic axillary lymph nodes. A 2010 meta-analysis, which included 13 studies and 964 total lesions, demonstrated pooled sensitivity of 84% (95% confidence interval [CI] 0.82, 0.87) and specificity of 79% (95% CI 0.75, 0.82) for DWI. 75 In reports included in this study, the mean ADC of malignant lesions ranged from 0.87 to 1.36 103mm2/s, with the recommended cutoffs ranging from 0.90 to 1.76 × 103 mm2/s. 75 A different meta-analysis study, which included 12 publications, recommended a threshold for malignancy of 1.23 × 10– 3 mm2/s. 76 While the diagnostic utility of DWI is high in each individual study, the wide ranges of cancer ADC and recommended cutoff values illustrate the significant variability of ADC measurements with sequence parameters and physiologic changes. This variability underscores the need for standardization of breast DWI, including prescribing fixed optimal b values to acquire DW images. For greater reproducibility, care must be taken to ensure that areas of necrosis or hemorrhage are avoided. Normalization of lesion ADC to that of ipsilateral normal parenchyma can be helpful. 77


While the ADC of cancer is in general lower than that of benign lesions, there are numerous exceptions to this rule. For example, due to the presence of mucin, which has low cellularity, mucinous carcinoma displays ADC values that can be higher than those of benign lesions. 78 On the other hand, benign papillomas 79 as well as high risk lesions 80 can present with ADC values as low or lower than those found in cancer. In addition, ADC values of ductal carcinoma in situ (DCIS) are intermediate and have significant overlap with both benign and malignant ADC value ranges. 79 , 81 Thus, despite generally high diagnostic performance, DWI does suffer to a degree from low specificity for cancer and low sensitivity to DCIS. Other MRI-derived information and physical examination findings should be considered when diagnosing a breast lesion. For an excellent review of practices and pitfalls in clinical application of DWI of the breast, see Woodhams et al. 51
Other Applications
The cytotoxic effects of chemotherapeutic agents include cell apoptosis, necrosis, and cell lysis. As cell membranes deteriorate and become increasingly more permeable during the course of the treatment, the rate of exchange across cell membranes increases and hence water mobility increases. These changes precede tumor shrinkage and are directly observable by DWI, leading to the hypothesis that DWI can be used as a tool for evaluating early treatment response to neoadjuvant chemotherapy. Specifically, several studies have explored the hypothesis that an early increase in ADC value will predict favorable treatment response, with promising results. 82 , 83 , 84 , 85 In addition, low ADC values were explored as a pretreatment predictive marker of positive response, also with promising results. 84 , 86 , 87 , 88
A study that included 70 excised cancerous lesions assessed breast DWI as a tool for detection of residual tumors and found that it demonstrated the same accuracy as DCE-MRI. 89 As DWI detected residual cancers that DCE-MRI did not, DWI could potentially be used to increase diagnostic accuracy of MRI for residual tumor evaluation.
Given the recent concerns about Gd deposition in tissues and its unclear clinical effect, 26 , 27 , 28 there is an increasing interest in effective noncontrast breast cancer screening protocols. Multiple studies have assessed DWI as a noncontrast MR screening tool, usually in combination with a T2-weighted sequence. 90 , 91 , 92 , 93 , 94 , 95 Compared to mammography, such protocols perform better, though not as well as DCE-MRI-based protocols. 95 However, in combination with mammography, excellent cancer detection rates can be achieved, with receiver operating characteristic area under the curve (ROC AUC) values as high as 0.96. 92
11.5 High Spectral and Spatial Resolution MRI
11.5.1 Introduction to High Spectral and Spatial Resolution MRI
A number of MR spectroscopic imaging methods were originally used for measurement of low concentrations of metabolites, 96 , 97 , 98 , 99 , 100 , 101 , 102 but in the early 1990s these methods were adapted for high spectral and spatial resolution (HiSS) anatomic and functional imaging, 103 and new methods for analyzing and interpreting water and fat spectra were developed. 104 , 105 , 106 , 107 , 108 Initially tested for neuroimaging, 109 it was first applied to breast in the early 2000s, and has since advanced to producing images of high diagnostic utility. 110 , 111 , 112 , 113 In conventional spectroscopic imaging, spectral peaks of metabolites are of primary interest and voxel sizes on the order of 1 cm3 are used to achieve practical SNRs. In HiSS MRI, on the other hand, the water proton resonance and its structure are of primary interest, and fat resonance can be characterized as well. Voxel size in HiSS MRI of the human breast is generally on the order of ~1mm3, although higher spatial resolution has been demonstrated.
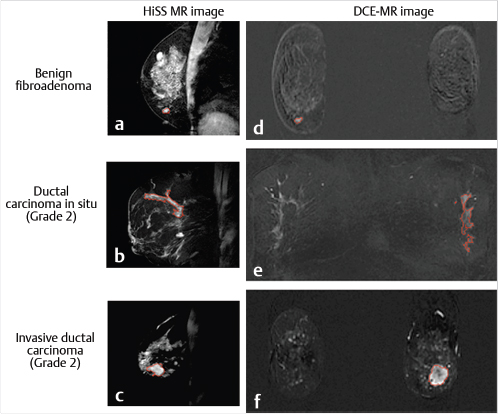
Even in small tissue voxels (~1 mm3), where macroscopic B0 gradients can be assumed to be weak and linear, the water resonance can present as non-Lorentzian. This can be a result of the presence of multiple water compartments within the voxel, as well as of line broadening due to susceptibility gradients caused by the presence of deoxyhemoglobin or hemosiderin, microcalcifications, local microanatomy, or tissue boundaries. As cancerous lesions show greater inhomogeneity than normal breast tissue, it can be hypothesized that non-Lorentzian line shapes will be more pronounced there, and this has been observed. 111 , 112 , 114 , 115 , 116 Often, multiple spectral components can be clearly and reproducibly resolved, yielding information on subvoxel compartments. 114 Signals from these compartments were demonstrated to respond differently to injected contrast agents 104 , 108 , 117 (Fig. 11‑10) or changes in blood oxygenation levels. 117 Such sub-voxel information cannot be obtained via conventional imaging, and thus HiSS can be considered a form of functional MR imaging. The spectral information in HiSS datasets can be used to provide a wide array of images carrying different physiological information, 104 , 108 , 114 , 115 , 118 , 119 and postprocessing methods are an ongoing area of research.

11.5.2 Acquisition and Postprocessing
HiSS imaging is usually implemented as a high spatial resolution 2D multislice echo-planar spectroscopic imaging (EPSI) 96 , 97 sequence, though a multiple gradient echo sequence can also be used. In either case, slices are acquired sequentially, and for each slice a series of MR images are acquired over a number of distinct time points, or echo times. This means that for a given slice, each k-space line is acquired at all echo times in a single RF excitation. A variable phase-encoding gradient determines the k-space line to be acquired at each RF excitation. At the end of a single-slice acquisition, a 3D k-space matrix is populated as a time series of 2D k-space matrices, each corresponding to a specific echo time. Although multiecho gradient echo and sometimes EPSI sequences are commercially available, at this time they are not implemented adequately for HiSS imaging. Instead, HiSS MRI has been implemented as a patch on Philips, GE, and Siemens scanner consoles. It is reasonable to expect that in the future clinically available sequences may be adequate for HiSS MRI applications.
Performing a Fourier transform in 2D k-spaces corresponding to each echo time, time-dependent MR images of a slice are reconstructed, and the evolution over time of the MR signal in each voxel can be observed. This initial 2D reconstruction can be combined with accelerated imaging (e.g., sensitivity encoding, or SENSE) 120 and is handled by the imaging console at the time of the scan. In MR imaging, both the k-space and the reconstructed images are matrices of complex values, but conventionally only magnitude MR images are shown and stored. When full complex information is retained, a further Fourier transform in the temporal direction can be applied, with some corrections, to yield the proton spectrum in each voxel. This and subsequent postprocessing described below are not currently performed on the scanner console, though research options allow installation of custom postprocessing algorithms on consoles.
Further postprocessing steps that are used to extract information from the proton spectra and produce a varied array of HiSS-derived images are detailed in multiple publications. 104 , 105 , 108 , 114 , 115 , 119 , 121 In the first step, water and fat peaks are identified based on their spectral location and separation 119 and modeled as Lorentzian peaks (i.e., fit with modulus Lorentzian functions). This allows removal of the baseline and fat signal and isolation of the water resonance signal. From such “pure” water signal, the structure of the water resonance can be explored, and a large variety of HiSS-derived images can be generated. Most frequently used is the HiSS water peak height image, for anatomical imaging. Other types used for morphological imaging include water peak integral and fat peak height and integral images. Fig. 11‑11 displays axial water peak height and integral images showing a cancerous lesion and compares them on SNR and internal contrast within the lesion. Additional HiSS-derived images can be generated to capture a variety of functional information. These include T2* and B0, 118 as well as water peak asymmetry, 122 Fourier component (FC) images (maps of water resonance amplitude at multiple frequency bins), 114 , 115 main off-peak component (OPC) frequency offset and amplitude, 111 , 112 and other measures of water resonance broadening, such as those derived from dispersion/absorption analysis. 116

Advantages
In HiSS MRI, almost complete removal of the fat signal can be achieved in postprocessing, without use of additional RF pulses. This produces effective fat suppression that is often superior to that of conventional imaging (Fig. 11‑12), 119 , 123 as well as images that can be interpreted more quantitatively, e.g., for breast density measurement. The advantage of HiSS MRI over conventional fat suppression methods is two-fold. First, additional RF fat saturation or inversion pulses can partially suppress the water resonance, and magnetization transfer effects can further reduce the water signal. Such effects are variable and difficult to model, which presents challenges for quantitative image analysis, but are avoided in HiSS MRI. Second, spectrally selective RF pulses used for fat suppression are sensitive to B0 inhomogeneities, leading to variation in the degree of fat suppression across the breast, whereas HiSS spectral postprocessing takes B0 variation into account. Finally, current advanced methods such as Dixon, 124 , 125 and therefrom derived IDEAL, 126 use spectral modeling of one or multiple lipid peaks with fixed T2* values, which can produce inaccuracies in fat and water separation. This can potentially pose problems for quantitative imaging. In HiSS imaging, full spectral information is used, and T2* of both water and fat are taken into account, while neither is treated as a fixed parameter. In addition, HiSS MR imaging retains the full fat signal with spectroscopic information, whose distribution and spectral characteristics can be analyzed and potentially augment the diagnostic information or breast cancer risk assessment. 127 , 128

In conventional imaging, the integral of the broadened water resonance is used to generate images, which can cause the signal to partially bleed into neighboring pixels and cause blurring. Thus the ability to resolve individual FCs (frequencies) within the water resonance results in sharper images. For example, when the amplitude of the water peak frequency is resolved and selectively displayed, there is less blurring at tissue boundaries and image quality is improved. 119 Further, the high spectral resolution allows description of new types of MRI contrast based on the water resonance structure, which constitute forms of functional imaging. B0, 118 peak asymmetry, 122 FC amplitudes, 114 , 115 frequency offset and amplitude of the strongest off-peak (different from main) component, 111 , 112 and measures of water resonance broadening derived from dispersion/absorption analysis 116 have been explored for enhancing diagnostic performance. Additionally, spectral information allows advanced lesion and parenchymal texture analysis, resulting in lesion discrimination performance that is comparable or higher than that of DCE-MRI, even in non–contrast-enhanced HiSS MRI. 113 HiSS images are also very sensitive to the local magnetic field and allow accurate B0 mapping, which can accentuate morphology of the lesion margin, as illustrated in Fig. 11‑13. 118 Even when the structure of the water resonance is not directly examined, e.g., for lack of sufficient SNR or spectral resolution, there are benefits to using spectroscopic imaging to reduce blurring at tissue boundaries and improve image quality.

In general, non–contrast-enhanced imaging methods do not exhibit artifacts intrinsic to contrast-enhanced images, such as blurring due to contrast diffusion and/or convection, 110 , 129 or blurring due to the changing contrast concentration during data acquisition. Fig. 11‑14 shows an example of image degradation due to the use of contrast agent. Contrast agents can also introduce susceptibility gradients, further degrading image quality. Because of the recently discovered problems with Gd deposition 22 , 24 , 25 in a variety of tissues, noncontrast imaging is preferred when diagnostic performance can be preserved. HiSS MRI could be useful in achieving this goal.

Applications
Lesion Diagnostics
To date, the primary application of HiSS MRI is to produce images with intensity proportional to the peak amplitude of the isolated water resonance, which provide the best CNR in morphological HiSS images. These images are heavily T2*-weighted, and thus provide very high contrast, but without the distortion and loss of SNR generally associated with T2*-weighted gradient echo imaging. Multiple studies have compared non–contrast-enhanced HiSS water peak height images to conventional postcontrast T1-weighted MRI, which is traditionally used for lesion diagnostics, and have demonstrated improved image quality 119 , 121 , 130 and comparable diagnostic performance. 110 , 113
Of particular interest is the study by Bhooshan et al that used computer-aided diagnostics (CADx) with neural networks to analyze and compare 2D (single-slice, single time point) nonenhanced HiSS water peak height images to 4D (multislice, multiple time points) DCE-MRI T1-weighted images in the task of classification of benign and malignant breast lesions. 113 Thirty-four malignant and seven benign lesions were scanned and automatically segmented on both types of images using a fuzzy c-means method (Fig. 11‑15). For HiSS images, morphological features were generated, while for T1-weighted DCE-MRI, both morphological and kinetic features were generated. Area under the ROC curve (ROC AUC) was used as the performance metric, and ROC AUC values of 0.92 ± 0.06 (HiSS) and 0.90 ± 0.05 (DCE-MRI) were obtained, satisfying a non-inferiority condition for HiSS performance (Fig. 11‑16). Such high diagnostic performance of non-enhanced HiSS MRI could result from reduced blurring at edges—a benefit of spectroscopic and noncontrast imaging. Another reason could be that heavy T2* weighting produces internal contrast in the lesion that differs from that found in contrast-enhanced T1-weighted images. For DCE-MRI data, full 3D signal and its temporal dependence were included in the analysis; yet, the diagnostic performance of HiSS MRI was comparable or better than that of DCE-MRI. As new information on Gd deposition in tissues and the resulting risks becomes available, 22 , 123 this is an increasingly important result.

Additional studies have sought to further improve the diagnostic performance of noncontrast HiSS MRI by analyzing the full water resonance spectral information. The methods have ranged from assessing spatial variation in the water resonance structure, 114 , 115 to analyzing properties of the strongest water signal component other than the main peak, 111 , 112 to describing the overall deviation of the water resonance shape from a Lorentzian function. 116 The non-Lorentzian structure of the water resonances in cancerous lesions likely arises from local magnetic susceptibility gradients caused by deoxygenated tumor blood vessels and calcifications, and thus contains diagnostically useful information concerning the local tissue physiology. This information cannot be obtained using conventional MRI and is likely to complement other available metrics to increase diagnostic performance.
In FC imaging, maps of spectral intensity at given frequencies within the water resonance (FC images) are generated and analyzed for presence of clusters of voxels with marked irregularities in the water resonance shape. 114 , 115 Cluster analysis takes spatial correlation into account and is illustrated in Fig. 11‑17 for five IDC lesions. In a study including 23 malignant and 9 benign lesions, when the number of cluster voxels with marked irregularities was used as a classifier of benign versus cancerous lesions, ROC AUC of 0.83 was obtained. 115 Further, non-spatially correlated, voxel-by-voxel analysis of OPCs of the water resonance has also proven useful. 111 , 112 When the voxels with the top 10% main off-peak component (OPC) amplitude values were selected and the mean of the OPC amplitudes over this set was used as a classifier, the ROC AUC value in the task of separating benign (N = 8) from malignant (N = 15) lesions reached 0.86. 112 Analysis of the overall resonance shape (dispersion versus absorption analysis), yielded an ROC AUC value of 0.90 on the same dataset. 116 Similar analysis of the main OPC frequency offset yielded an ROC AUC of 0.83. 111 While the sample sizes of these studies are limited, they do clearly demonstrate the potential for high diagnostic utility of non–contrast-enhanced HiSS MRI.

Lesion Detection and Other Applications
Recently, it was shown that full bilateral HiSS MRI of the breast can be achieved in 6 to 7 minutes with some reduction of the spectral resolution. 121 The ability to perform full bilateral breast examinations opens HiSS MRI to new applications such as lesion detection and breast density measurement. Several examples of maximum intensity projections of HiSS water peak height images are shown in Fig. 11‑18. The use of HiSS MRI as a screening tool is of great interest due to its ability to visualize and reliably characterize breast lesions without the administration of contrast agent. After recent reports of Gd deposition in tissue, including deep brain structures, with repeated exposure to GBCM, 22 , 131 any population-wide breast screening programs will almost certainly require imaging without contrast media injection. DWI has been studied for this purpose, 90 , 91 , 92 , 93 , 94 , 95 and HiSS MRI could provide complementary information that could improve diagnostic performance.

Such screening MRI examinations could also be used to stratify women according to breast density and thus allow individualized breast cancer risk management. Currently, mammography is used to stratify women into four BIRADS-defined breast density groups, but this method is reader-dependent and often results in significant overlap between the categories. 132 , 133 Most importantly, the stratifying is coarse and thus provides little quantitative information. Breast MRI can provide quantitative 3D measurements of breast density and glandular tissue volume, which would be of greater value in cancer risk management. HiSS MRI is well suited for this purpose, as it is sensitive in voxels with low water content, and able to selectively visualize the parenchymal tissue without the use of fat-suppressing RF pulses that may affect water signal as well.
Related posts:
Stay updated, free articles. Join our Telegram channel

Full access? Get Clinical Tree


