Abstract
Effective cancer diagnosis and treatment rely on the integration of information from multiple patient tests involving clinical, molecular, imaging, and genomic data. Adapting the Precision Medicine Initiative into imaging includes studies in both discovery and translation in order to enable the conversion of current radiological interpretation from that of the “average patient” to the precise interpretation and patient-care management decisions specific to the individual patient. Over the past few decades, various investigators have been developing image analysis methods for computer-aided diagnosis (CAD) and the quantitative characterization of breast lesions on clinical images. Radiomics, an expansion of computer-aided diagnosis, is a growing effort that involves these computerized image analyses in attempt to further relate quantitative image data to other “-omic” data such as clinical, pathologic, and genomic data. Also, the integration of imaging data (radiomics) with genomic data, referred to as “imaging-genomics” or “radiogenomics”, allows for the study of associations between the radiomic tumor phenotypes and the genomic measurements of the same tumors. This chapter discusses the translation of radiomics to clinical practice, which requires, beyond the actual development of the quantitative radiomic features, a multi-stage process of discovery and translation.
13 Future Applications: Radiomics and Deep Learning on Breast MRI
13.1 Introduction
Effective cancer diagnosis and treatment rely on the integration of information from multiple patient tests involving clinical, molecular, imaging, and genomic data. Such integrations are expected to facilitate patient-specific research for precision medicine. Adapting the Precision Medicine Initiative into imaging research includes studies in both discovery and translation in order to enable the conversion of current radiological interpretation from that of the “average patient” to the precise interpretation and patient-care management decisions specific to the individual patient.
Over the past few decades, various investigators have been developing image analysis methods for computer-aided diagnosis (CAD) and the quantitative characterization of breast lesions on clinical images. 1 Radiomics, an expansion of CAD, is a growing effort that involves these computerized image analyses in attempt to further relate quantitative image data to other “-omic” data such as clinical, pathologic, and genomic data. 2 The integration of imaging data (radiomics) with genomic data, referred to as “imaging-genomics” or “radiogenomics,” allows for the study of associations between the radiomic tumor phenotypes and the genomic measurements of the same tumors. 3 , 64 Radiomic phenotypes (i.e., features) that are highly correlated with important clinical, molecular, or genomic biomarkers can potentially serve as diagnostic or prognostic tools for patient monitoring and assessing therapeutic response, and thus augment the utility of medical imaging as a noninvasive technology for cancer care, like a “virtual digital biopsy.”
It is useful to review the goals of CAD, which are to reduce search errors, reduce interpretation errors, reduce variation between and within observers, and/or improve the efficiency of the breast imaging interpretation process. 6 These goals can be achieved if the computer’s output is presented in an effective and efficient manner and if the computer output is used appropriately by the radiologist. However, the potential of various developments in CAD goes beyond the radiologist’s interpretation process to future roles in radiomics such as image-based biomarkers (phenotypes) for assessing prognosis and estimating response to therapy as well as in imaging genomics and cancer (disease) discovery. Note that CADe is computer-aided detection and CADx is computer-aided diagnosis; both of these approaches require radiologists to use the computer output as an aid in their interpretation.
It is important to note that with CAD as well as radiomics, the extraction of features from digital medical images without the association with disease characteristics is basically only extracted information. Through investigations into the applications of these computer vision techniques, within CAD and beyond, knowledge is gained in the management of the (cancer) patient 1 and in the understanding of the disease. 2 As will be discussed throughout this chapter, the translation of radiomics to clinical practice requires, beyond the actual development of the quantitative radiomic features, a multistage process of discovery and translation.
In the discovery stage, one attempts to find relationships between images (through quantitative radiomics) and clinical data, molecular data, genomic data, and outcome data. Discovery is a multidisciplinary data mining effort involving researchers such as radiologists, medical physicists, statisticians, oncologists, computer scientists, engineers, and computational geneticists. Similar to how the genomics community approached the big biology of the Cancer Genome project, the radiological community needs to continue to conduct robust collection, annotation, analysis, and evaluation of images of large populations.
In the application stage, one aims to develop predictive models for use in risk assessment, screening, detection, diagnosis, prognosis, therapeutic response, risk of recurrence, and other clinical tasks, as discussed later in this chapter. Here, radiomics serve as contributions to “virtual digital biopsies” for use when actual biopsies are not practical such as in screening and repeated assessments of treatment response (Fig. 13‑1).

13.2 Quantitative Radiomics of Tumors and Their Microenvironment
In the general definition of “radiomics,” that of converting images to minable data, one could potentially have radiologists interpret images and assign numerical ratings to different characteristics, such as degree of circularity for lesion shape or amount of uptake for kinetic enhancement. However, assessment of image-based tumor characteristics by radiologists is usually qualitative with interradiologist’s variation as well as time consuming. Thus, it is beneficial to use computer analysis methods and machine learning methods to quantitatively, objectively, and automatically extract characteristics from images, i.e., quantitative radiomics. Such features could be descriptive of a tumor with or without its microenvironment or a normal region. The remainder of this chapter will mainly focus on quantitative radiomics.
Given the rise in the application of deep learning to the general task of image interpretation, it is beneficial to explore radiomics in terms of lesion segmentation–based methods as well as deep learning–based methods, and then look for opportunities to merge such techniques into advanced predictors (Fig. 13‑2).

13.3 Segmentation-Based CAD/Radiomics
In the computer characterization of a segmented tumor or region, multiple steps are available for automation along the radiomics pipeline (chain). These include tumor (or region) segmentation, feature extraction, and merging of features into a tumor signature (relevant to a specific clinical question).
Since with radiomics, we are interested in image-based phenotypes of the tumor or region, we can use examples from CADx, and not CADe, since detection is not the task. Table 13‑1 lists various radiomic features along with their general phenotypic category and potential clinical application. References are given; however, many examples can be found in the literature over the past multiple decades.
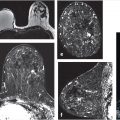
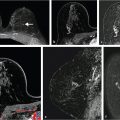
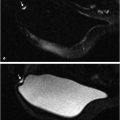
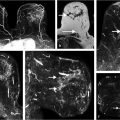
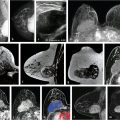
For example, quantitative tumor radiomics, i.e., tumor phenotypes, can be automatically extracted from dynamic contrast-enhanced magnetic resonance (DCE-MR) images of the breast using methods and algorithms that automatically segment the tumor (Fig. 13‑3) from the surrounding parenchymal background within the DCE-MR images and extract lesion characteristics in six phenotypic categories (Fig. 13‑4): (1) size (measuring tumor dimensions), (2) shape (quantifying the 3D geometry), (3) morphology (margin characteristics), (4) enhancement texture (describing the heterogeneity within the texture of the contrast uptake in the tumor on the first postcontrast MRIs), (5) kinetic curve assessment (describing the shape of the kinetic curve and assessing the physiologic process of the uptake and washout of the contrast agent in the tumor during the dynamic imaging series, and (6) enhancement-variance kinetics (characterizing the time course of the spatial variance of the enhancement within the tumor).


Note that multiple mathematical descriptors can be used to calculate these phenotypes, with many being highly correlated within a specific phenotypic category. Uses of these features for specific clinical tasks will be discussed later in this chapter.
Related features such as shape, margin, and texture can also be extracted using computer analysis from T2-weighted (T2w) and other common as well as exploratory MRI techniques, as listed in Table 13‑1. 7 , 8 , 9 , 10 , 11 , 12
For other tasks, radiomic features can be extracted from regions within images of normal tissue to characterize the density and texture of parenchyma for potential uses in breast cancer risk assessment. Texture-based phenotypes have been used extensively over the past decades, with the use rapidly increasing as a means to describe heterogeneity within tumors or regions. 13 , 14 , 15 While texture analysis on mammographic parenchyma has shown that women at high risk tend to have dense breast with coarse and low contrast patterns (Fig. 13‑5), 16 , 17 , 18 such analyses are also being conducted on breast MRI. 19 , 20

13.3.1 Deep Learning in the Classification of Tumors and Normal Tissue
An alternative to having the computer extract specific lesion features (e.g., using mathematical descriptors to calculate margin sharpness) from the lesion image is to input the image data to the computer and have the computer learn directly from the image data. Learning directly from the image data has led to deep learning methods for content-based retrieval, CAD, and data mining. 21 Note that the use of deep learning can contribute along the decision-making pipeline at multiple stages including filtering, segmentation, feature extraction, and/or classification.
In the early 1990s, convolutional neural networks (CNNs) were initially introduced to mammographic imaging for CAD using regions of interest (ROIs) from which to learn without explicit manual intervention. 22 Zhang et al used CNNs as a means to filter the image prior to subsequent feature extraction (Fig. 13‑6). 23 Others started using CNNs for classification of ROIs as either tumor or normal tissue. 24

Although CNNs typically rely on massive datasets for training, it has been shown that transfer learning techniques such as fine-tuning or feature extraction based on ImageNet or other trained CNNs can be used to reduce the need for larger datasets. 25 , 26 In this scenario, deep learning techniques are being implemented for feature extraction and are exhibiting strong predictive performances on CADx tasks without requiring data-intensive computing. 27 , 28
Specifically, for radiomics using CNN features, the computer analysis involves the extraction of one or more network layers, which subsequently serve as “features,” from a pretrained CNN. These CNN features are then further used to train classifiers. Examples are given for pretrained AlexNet and VFF19 net, each of which has been trained on the ImageNet dataset of “everyday” images. The architecture of VGG19 model includes five stacks—with each stack containing two or four convolutional layers and a max-pooling layer—followed by three fully connected layers. The VGG19 architecture and CNN feature-extraction pipeline is illustrated in Fig. 13‑7. It should be noted that many of the elements in each layer that serve as the initial features may exhibit zero variance across the dataset, and thus can be eliminated as useful features.

In a study of CNNs in the classification of malignant and benign breast tumors, a VGG19 model was used across three imaging modalities—mammography, ultrasound, and DCE-MRI. 29 The VGG19 model has three “RGB color” channels for input, which is conducive to inputting, for example, three MR images across different contrast uptake points or three MR images across three neoadjuvant treatment points. Note that when using different images within the three channels, caution is needed in order to ensure proper registration of the input images. The output layers, i.e., the features, were then subsequently merged using a support vector machine (SVM) to develop classifiers for specific clinical questions.
As databases of breast MRIs increase, deep learning in which CNNs are trained from scratch will be possible; however, potentially millions of MRIs may be necessary.
Comparison of Conventional CADx to Deep Learning
Comparison of segmentation-based, hand-crafted radiomic features (as in conventional CADx) and CNN-based radiomic features (as in transfer learning) is expected to yield further understanding of the nonintuitive CNN-based features. Fig. 13‑8 shows the comparison of diagnostic decision making from using segmentation-based features and CNN-based features on various modalities of breast imaging. While both conventional hand-crafted CADx features and CNN-based features perform relatively well in estimating the likelihood of malignancy, they each do not yield correct estimates for the same breast lesions, thus allowing for improved performance when combined, similar to consensus reads from two expert radiologists.


Thus, fusion methods can be employed in which the classifier outputs from segmentation-based methods and the CNN-based methods are combined, such as by averaging the separate output to yield a combined output related to the likelihood of being cancerous.
Robustness of Radiomic Features
Despite computerized image interpretation having potential in aiding radiologists, it also faces many challenges. Variation in scanning protocols, MR system manufactures, and magnet strengths may lead to variability in the image data. With sufficient training and experience, human readers may adjust their interpretation, while computational radiomic analysis results may be dependent on the differences in acquisitions. Therefore, for computerized image analysis to be clinically useful, radiomic systems need to generate consistent results when they analyze images acquired at different conditions. The harmonization of feature values may be achieved by standardization of image data during acquisition and prior to feature extraction or through the harmonization of feature computing methods. Various investigators have studied different approaches to robustness with much of the literature in assessing the robustness of radiomic features of the lung. 30 Robustness of quantitative imaging is also a major focus of the National Cancer Institute’s (NCI) Quantitative Imaging Network (QIN) 31 and the RSNA’s Quantitative Imaging Biomarker Alliance (QIBA). 32 Recently, new metrics of robustness have been demonstrated to assess differences in radiomic features between different manufacturers’ imaging systems. 33
To ensure robustness of radiomic analysis, variation in current features must be investigated to allow further exploration of data harmonization. Limited literature is available on evaluation of feature variability across MR scanners and imaging protocols. 34 In one study in which breast DCE-MR images had been acquired with scanners from two different manufacturers, the equivalence of MRI radiomic features (phenotypes) and their performance in distinguishing breast cancers in terms of lymph node status and molecular classification were investigated. 34
In that study, the analysis was performed on two databases, which included cases imaged using GE and Philips scanners. 34 Each case was subject to computerized feature extraction with a breast MRI radiomics workstation. Superiority testing was used to evaluate the differences in feature performance in the prognostic tasks of distinguishing lymph node and hormone receptor statuses, with area under the receiver operating characteristic curve (AUC) serving as a figure of merit. The features that failed to show statistically significant differences in performance were further evaluated with noninferiority testing. Finally, classification models were built for assessment of clinical tasks. Leave-one-out cross-validation and independent testing were conducted to assess performance robustness. In prognostic tasks, features showed varying levels of robustness. The best agreement in performance was seen in a lymph node classification for two features—tumor morphology and tumor heterogeneity—with absolute value of the lower bound of the 90% confidence interval for ∆AUC < 0.05.
Quantitative breast radiomic features show varying robustness in their average values and in performance across MRI scanners. Noninferiority testing can reveal radiomic features with robust performance in the classification tasks. In practice, features showing different performance levels need to be tuned based on the MRI scanner used during imaging procedure.
13.4 Computerized Image–Based Cancer Risk
Association of mammographic density with breast cancer risk has led to DCE-MRI being recommended for screening of high-risk women. Radiomic features related to risk include breast density and parenchyma texture pattern, as discussed earlier in this chapter. However, most of such developments are conducted on digital mammograms. 35 More studies are needed to understand how breast background parenchymal enhancement (BPE) on DCE-MRI is associated with breast density and breast cancer risk. 36 , 37 , 38 The characterization of normal breast tissue on DCE-MRI has become more important in assessing the breast cancer risk. 39 , 40
In one study on a high-risk population of 92 asymptomatic women, breast BPE on DCE-MRI was compared to parenchymal density and texture on full-field digital mammograms (FFDMs). 41 Breast volume on MRI was computed using a volume-growing algorithm and classified into fibroglandular and fatty regions. Kinetic curves within breast fibroglandular regions were extracted and categorized using fuzzy c-means (FCM) clustering yielding BPE. On corresponding FFDM images, mammographic density and textures were calculated. Correlation analysis between the two-modality density measures yielded a correlation coefficient of 0.80 (p < 0.0001). From kinetic analyses, 70% of the most enhancing curves showed persistent curve type and reached peak parenchymal intensity at the last postcontrast time point, with 89% of most enhancing curves reaching peak intensity at the fourth or fifth postcontrast time points. Dense breasts were found to have a higher peak enhancement with an average of 116.5%, while fatty breasts demonstrated an average peak enhancement of 66.0%. Dense breasts, with coarser, low-contrast mammographic patterns tended to have more BPE at peak time point. Thus, BPE may be potentially useful in assessing breast cancer risk.
13.4.1 High-Throughput MRI Phenotyping of Breast Tumors for Diagnosis and Prognosis Relative to Molecular Subtyping
Use of quantitative radiomics in big data analysis requires that there is an effective and efficient pipeline to convert acquired breast MR images into a set of quantitative phenotypic descriptors as described earlier in the chapter, as shown earlier in Fig. 13‑4, which is a schematic of a breast MRI workstation that takes as input the 4D DCE-MR images and outputs radiomic features.
It is useful to emphasize that radiomic feature chosen for one clinical task may not be that useful for another clinical task. However, if one’s “big data” dataset is sufficiently large, one can assess the features across different tasks. Examples of such are demonstrated in the next sections that highlight the MRI phenotyping research conducted on The Cancer Genome Atlas/The Cancer Imaging Archive (TCGA/TCIA) datasets. 42 , 43 , 44
While imaging is used in the clinical staging of a breast cancer to initially manage the patient, it is the biopsy-determined “pathologic” stage that drives further decision making. In order to augment the TNM staging system, investigators are developing radiomic biomarkers, e.g., on breast MRI, to help predict pathologic stage and thus inform patient management and appropriate treatment, such as neoadjuvant chemotherapy, surgery, and/or radiation therapy.
Using the collected de-identified datasets of invasive breast carcinomas from TCGA and TCIA, cancer research resources supported by the NCI of the U.S. National Institutes of Health, 42 , 43 the TCGA Breast Phenotype Group 44 investigated relationships between computer-extracted quantitative radiomic MRI lesion features and various clinical, molecular, and genomics markers of prognosis and risk of recurrence, including gene expression profiles. At the time of analysis, 91 biopsy-proven invasive breast cancers from the TCGA had DCE-MR images were available and underwent analysis, as schematically shown in Fig. 13‑9. On these cases, the predictive ability of the quantitative radiomic MRI features was assessed relative to the tasks of pathologic stage and cancer subtypes.

Tumors were characterized according to: (1) radiologist-measured size and (2) computer-extracted quantitative radiomic features. Then, models were built to predict tumor pathologic stage and lymph node involvement. It was found that tumor size was the most powerful predictor of pathologic stage, but radiomic features that captured biologic behavior also emerged as predictive (e.g., stage I and II vs. stage III yielded an AUC of 0.83). 45 It was concluded that computer-extracted MRI phenotypes have promise for predicting breast cancer pathologic stage and lymph node status.
On the basis of receptor status (estrogen receptor [ER], progesterone receptor [PR], and human epidermal growth factor receptor 2 [HER2]), breast cancer can be classified into different subtypes. By considering gene expression profiles, breast cancer can be also categorized into molecular subtypes, such as normal-like, luminal A, luminal B, HER2-enriched, and basal-like. 46 , 47 Cancers of different subtypes have different prognoses and respond differently to different therapies. Thus, the correlation between the quantitative MRI radiomic features and various cancer subtypes was studied. 14 MRI-based tumor phenotypes were able to distinguish between molecular prognostic indicators through tasks of distinguishing between ER+ versus ER–, PR+ versus PR–, HER2+ versus HER2–, and triple-negative cancers versus all others, respectively. Statistically significant associations between tumor phenotypes and receptor status were observed. More aggressive cancers were found to more likely be larger in size with more heterogeneity demonstrated quantitatively in their contrast enhancement texture. Even after controlling for tumor size, statistically significant trends were observed between enhancement texture (entropy) and molecular subtypes (normal-like, luminal A, luminal B, HER2-enriched, basal-like) (Fig. 13‑10). In conclusion, computer-extracted MRI phenotypes show promise for high-throughput discrimination of breast cancer subtypes and may yield a quantitative predictive signature for assessing prognosis.

Related posts:
Stay updated, free articles. Join our Telegram channel

Full access? Get Clinical Tree


