Computed Tomography
Radionuclide Imaging
Dual Energy X-ray Absorptiometry (DEXA)
Myelography
Discography
Digital X-Ray Imaging
Positron Emission Tomography
Magnetic Resonance Imaging
HISTORY
Contemporary magnetic resonance imaging (MRI) developed from the nuclear magnetic resonance (NMR) technology that chemists use to evaluate the composition of laboratory samples. Laboratory use of NMR began in 1946, when Felix Bloch proposed that nuclei could behave as small magnets in the presence of a strong magnetic field. 1 Nearly three decades later, Raymond Damadien used this technology as an imaging tool when he produced a crude image of a rat tumor in 1974. 2 Damadien produced a successful image of a full body in July 3, 1977 with his MRI equipment, Indomitable, which is now housed in the Smithsonian.
MRI offers advantages over other diagnostic imaging modalities. In particular, MRI provides superior tissue contrast when compared with computed tomography (CT) and conventional radiography. The image contrast achieved in CT scanning is based on x-ray attenuation properties. Instead, MRI spatially analyzes the magnetic spin properties of tissue nuclei, principally hydrogen. Analysis of this information results in greater sensitivity to subtle differences among tissue types than is possible with imaging systems based on x-ray attenuation.
Notably MRI does not use ionizing radiation in the process of obtaining an image; therefore its use is not associated with the potential harmful effects of ionizing radiation. MRI uses high magnetic fields and radiofrequencies to analyze the magnetic spin properties of hydrogen nuclei. During the past century, the potential ill effects of magnetic or radiofrequency fields have been the focus of hundreds of papers. The specific concerns of past investigations have focused on changes in enzyme kinetics, nerve conductivity, effect on macromolecules and subcellular components, cardiac function, magnetohydrodynamic effects, membrane transportation, blood sedimentation, genetic effects, and other bioeffects. Reviews of this literature are available for the interested reader.34 and 5 In general the parameters of MRI are without significant health risks, although the research is not conclusive enough to assume that MRI is absolutely safe.
EQUIPMENT
Principal components of the MRI scanner include a large homogeneous magnetic field, gradient magnetic coils, radiofrequency coils, and computer systems. On casual observation, the MRI scanner appears similar to a CT unit. Each is composed of a gantry, a couch for the patient, and a computer. The gantry of an MRI unit is longer than that of a CT scanner. The MRI gantry contains a large primary magnet to create a net magnetization of the hydrogen nuclei within the patient. Three principal types of magnets are used to generate the magnetic fields needed for MRI. 6
1. Superconducting magnets. Superconducting magnets (Fig. 2-1) consist of primary magnetic coils supercooled by cryogens such as liquid helium or liquid nitrogen (Fig. 2-2). Supercooling the system dramatically decreases electrical resistance by allowing infinite conductivity. At infinite conductivity the primary magnet no longer requires a power supply, which means that the magnetic field can be interrupted only by ramping down the magnet by expelling (quenching) the cryogens. Further, the cryogens must be periodically replenished, which represents an ongoing financial cost. Superconducting magnet systems may be the most popular because they achieve good signal-to-noise ratio. They also tend to have a large peripheral (fringe) field, which can be a safety issue, especially for such medical devices as cardiac pacemakers.
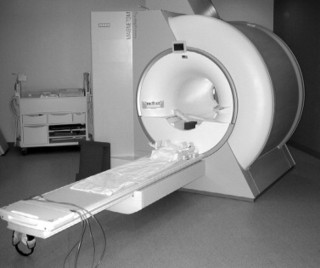 |
| FIG. 2-1 Closed magnetic resonance imaging system using a supercooled magnet. |
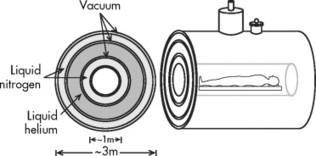 |
| FIG. 2-2 Cross-section of a superconducting magnet. |
2. Permanent magnets. Permanent magnets (Fig. 2-3) are constructed from individual bricks of ferromagnetic material. As a result, these scanners can be constructed with the popular open design (open MRI), which are less claustrophobic. Generally, these systems are not able to obtain the high magnetic fields of superconductive systems and present with field strength on the order of approximately 0.2 tesla (T) or less. Besides the lessened potential claustrophobia, other advantages include a minimal peripheral (fringe) magnetic field, minimal power consumption, and no need for relatively expensive cryogens.
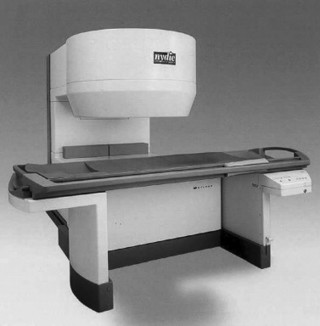 |
| FIG. 2-3 Open magnetic resonance imaging system using a permanent magnet. |
3. Resistive electromagnets. This MRI system is based on the classical electromagnet in which large amounts of power are conducted through solenoidal loops of wire. These systems tend to have magnetic field strengths of 0.3 tesla or less. Although these systems may be of lower initial cost than superconducting magnets and of lower weight than permanent magnets, the power consumption is high. These scanners can be “turned off.” Generally, however, these tend to be the least popular of the MRI designs.
MRI equipment with varying field strengths is widely available. Generally, low-field MRI is represented by equipment that has a magnetic field strength under 0.2 tesla. Midfield MRI is between 0.2 and 0.6 tesla. High-field MRI is 1 tesla and above. Considerable discussion can be found in the literature as to which magnet system (low-field versus high-field) is “better.” High-field MRI equipment does allow for high-resolution images and improved signal-to-noise ratio; however, advances in computer technology and imaging sequences have made mid- and low-field MRI very competitive, especially in musculoskeletal imaging. Further, high-field systems may be more prone to motion artifact and chemical shift artifact. Popular “open MRI” facilities generally are of the low-field variety because the open architecture of these systems is most compatible with permanent magnet designs (see Fig. 2-3).
Gradient magnetic coils are located within the gantry and allow “slicing” of the patient’s anatomy along sagittal, coronal, or transverse planes (Fig. 2-4). These coils switch on and off very rapidly during the examination, which produces the characteristic, sometimes quite loud, tapping noise associated with an MRI scan.
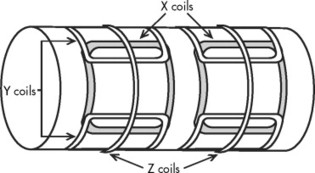 |
| FIG. 2-4 The location of the three sets of gradient coils relative to the primary magnet. Gradient coils produce inhomogeneities of the magnet field that permit selection of slice thickness and pixel location within a slice. |
Radiofrequency (RF) coils are placed on or near the area of the patient’s anatomy being investigated. They are used to transmit and receive RF information pertaining to the location of the hydrogen nuclei. These RF coils or probes come in various designs adapted to most appropriately image the region of anatomy in question (Fig. 2-5).
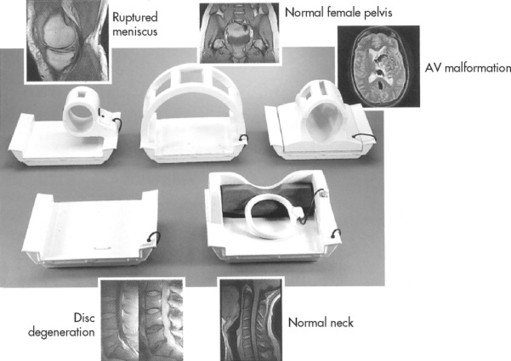 |
| FIG. 2-5 Radiofrequency coils are used to excite and localize the hydrogen nuclei magnetic fields. (Courtesy Picker International, Inc., Cleveland, OH.) |
IMAGE PRODUCTION
MR image production is based on the system’s ability to spatially localize hydrogen atoms within body tissues. Within the body, the nuclei of hydrogen atoms are charged particles that generate small magnetic fields, similar to tiny bar magnets. Normally the hydrogen atoms are randomly oriented, their magnetic vectors cancel out, and no net magnetism of the tissue is produced. Hydrogen is particularly useful because it is plentiful, representing 80% of all atoms found in the body.
The MRI unit creates a strong magnetic field. Magnetic field strengths are measured in units of gauss (G) and T. One tesla is equal to 10,000 gauss. In comparison, the earth’s magnetic field is approximately 0.5 gauss. Consequently, a 1.5-T MRI magnet is about 30,000 times the strength of the earth’s magnetic field. The strength of electromagnets used to pick up cars in junkyards (1.5 to 2 T) generally is the same field strength of an MRI magnet.
When the patient is placed in the MRI scanner, each of the small magnetic fields of the patient’s hydrogen atoms tends to orient with, or less often against, the stronger external magnetic field of the MRI unit. The hydrogen atoms are not statically polarized by the strong external magnetic force of the MRI unit; rather, they wobble like a child’s top (Figs. 2-6 and 2-7).
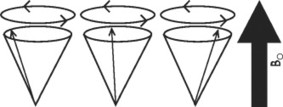 |
| FIG. 2-6 When a patient is placed in the strong magnet field (Bo) of the magnetic resonance imaging unit, some of the patient’s hydrogen atoms align themselves with the strong magnetic field as they precess or spin about a central axis. The individual spins of the hydrogen atoms are synchronized but are out of phase, until a radiofrequency pulse occurs. |
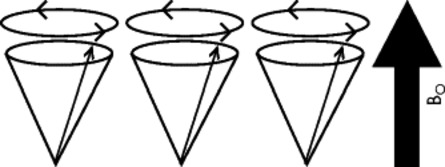 |
| FIG. 2-7 After the application of a radiofrequency pulse identical to the Larmor frequency, the hydrogen atoms precess in phase. |
Hydrogen wobbling is a phenomenon known as precession. In MRI, the rate of precession is intimately dependent on the element (in this case hydrogen) and the strength of the external magnetic field created by the MRI. A linear relationship exists between the frequency of precession and the strength of an external magnetic field, known as the gyromagnetic ratio, and is measured in megahertz/tesla (MHz/T). For instance, when hydrogen is placed in a magnet of 1T, it assumes a characteristic precession frequency of 42.6 MHz. The relationship between the gyromagnetic ratio and magnetic field strength is described by the Larmor equation and forms the basis for MRI. The following is the Larmor equation:


To obtain images, an RF identical to the Larmor frequency of precession is pulsed into the patient. For instance, if the hydrogen nuclei have precession frequency of 40 MHz, then these nuclei can be “excited” only by a 40-MHz radiofrequency pulse. This is the concept of resonance. A similar but more easily understood phenomenon occurs if an appropriately keyed tuning fork (e.g., D) is placed next to a guitar. The vibration from the tuning fork is propagated through air to cause selective vibration of just the D string of the six strings (Fig. 2-8).
 |
| FIG. 2-8 Hydrogen nuclear resonance is the core phenomena of magnetic resonance imaging. The central idea is that a radiofrequency of the same energy wavelength as the magnetized hydrogen atoms will cause the hydrogen atoms to resonate. This is analogous to a tuning fork selectively vibrating a similarly tuned guitar string. |
With the pulses transmitted by the RF coils the hydrogen proton magnetic fields deviate from the plane of the main magnetic field and begin to precess with the same phase (see Figs. 2-6 and 2-7). When the RF pulse is turned off, the excited nuclei undergo longitudinal relaxation back to the equilibrium “parallel” plane of magnetism and transverse relaxation back to the equilibrium “out-of-phase” precession. During relaxation the accumulated energy is released in the form of RF, which is detected by the surface coil acting as an antenna system for the MRI equipment. The MRI signal received from the tissues is used to reconstruct an image; 7 therefore the dynamics of MRI can be summarized in four steps: resting, magnetism, excitation, and relaxation (Fig. 2-9).
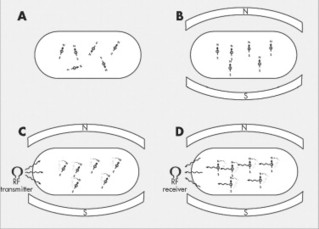 |
| FIG. 2-9 Magnetic resonance imaging (MRI) phases. Because hydrogen atoms have a positive charge and move, they produce a tiny electrical current, and axiomatically associated magnetic currents, behaving as tiny bar magnets. In the resting state, A, the patient’s hydrogen atoms (tiny bar magnets) are randomly oriented, so there is no net magnetism to the body. However, when the patient is placed in the strong magnetic field of the MRI unit, B, some (only about 7 per million) of the patient’s freely moving hydrogen atoms align with (or less commonly against) the strong external polarity of the MRI unit. At this time, the addition of a prescribed radiofrequency, C, causes excitation of the aligned hydrogen atoms. As the hydrogen atoms absorb the applied radiofrequency pulse, they deflect from their parallel orientation. Once the applied radiofrequency pulse is turned off, D, the hydrogen atoms return to their equilibrium state, thereby emitting the radiofrequency energy they absorbed during excitation, C. The emitted signal, D, is collected and used to construct the MRI image. |
IMAGING TECHNIQUES
As presented in the previous chapter, the production of a radiographic image is dependent on two principal controls that cover technique selection. These controls are kVp (peak kilovoltage) and mAs (milliampere-seconds). By carefully selecting kVp and mAs selections, radiographers can optimize the appearance of an image.
In MRI, image appearance is manipulated by controlling the timing of RF pulses sent into the patient (repetition time, TR) and the echo of the signal from the patient (echo time, TE). The most commonly used MRI technique is called a spin-echo sequence. RF pulses are transmitted into the patient during this process. Typically the RF pulses are designed to “flip” or reorient the hydrogen magnetic field vectors to 90 or 180 degrees such that the associated emitted radiofrequencies can be detected by the antenna system within the RF coils.
As described, the RF pulses are discontinued after nuclear excitation and the hydrogen nuclei relax. RF is emitted from the tissue as they relax. This emitted MRI signal is received by the surface coil and used to reconstruct an image of the tissues being studied. The appearance of the image reflects the intensity of the emitted signal from the examined body tissues. High signal intensity appears bright on the image; a low signal intensity appears dark.
Signal intensity is dependent on the population of hydrogen atoms and the environment in which the hydrogen are found. How hydrogen is “bound” also influences the MRI signal. Hydrogen that is tightly bound (e.g., within ligament) emanates minimal signal. Hydrogen that is loosely bound (e.g., within fluid) has the potential to exhibit a very bright signal with the appropriate MRI technique. The ability to evaluate hydrogen within varying by chemical and structural environments is accomplished by evaluating T1 and T2 relaxation times.
This is accomplished by manipulating the repetition of RF pulses (TR) and varying the collection time of the emitted signal (TE), which can dramatically influence which relaxation times are emphasized in the image. In other words, the resultant image can be based on the population of hydrogen (proton density) or emphasized to either the T1- or T2-weighted properties of the tissue (Figs. 2-10 and 2-11; Table 2-1).
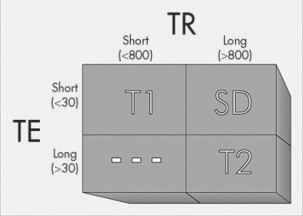 |
| FIG. 2-10 Relationship of TR and TE to image weighting (T1-, T2-, and spin density). Hydrogens in fat yield high signal intensity (appear white) on T1-weighted images. Hydrogens in water yield high signal intensity (appear white) on T2-weighted images. The population of hydrogen in both fat and water yield high signal intensity (appear white) on spin-density images. |
 |
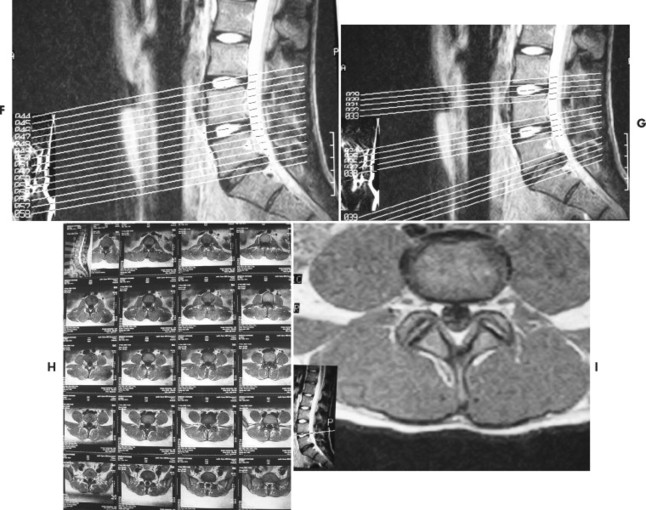 |
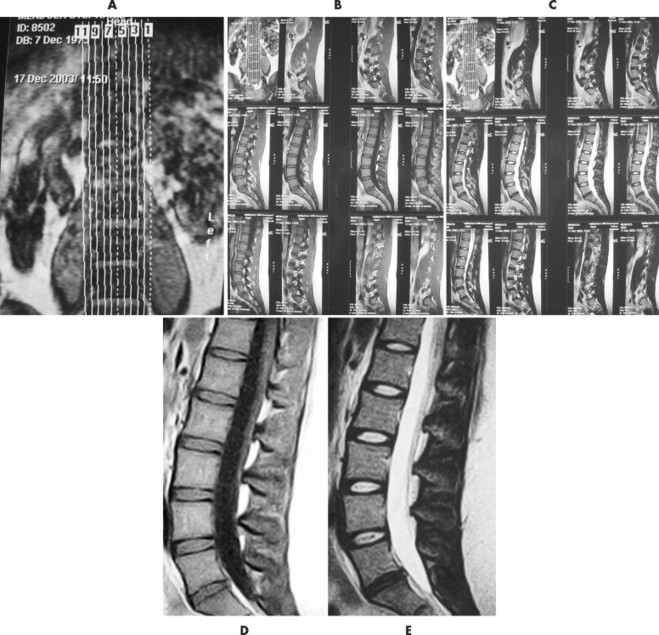
| FIG. 2-11 The plan scans of a magnetic resonance imaging examination are used to orient the interpretation of images done in other plans. For instance, A, the coronal image, has vertical lines marked 1 to 11 denoting the 11 sagittal slices done in the sagittal plane. The sagittal images are displayed in groups, B and C, on 14 × 17 film where, D, individual T1-weighted spin density, or, E, T2-weighted images can be viewed. Axial images can be accomplished with, F, contiguous slices or, G, slices angled to the disc plane. As with the sagittal images, the axial images, H, are printed on 14 × 17 film in groups so, I, each image can be interpreted. |
| Signal | TI-weighting | T2-weighting |
|---|---|---|
| Bright | Fat Yellow bone marrow Subacute hemorrhage White matter of brain | Cerebrospinal fluid-water Cysts Edema Normal nucleus pulposus Tumor |
| Medium | Fluid Intravenous pyelogram Muscle Red bone marrow Spinal cord Tumor | Dehydrated nucleus pulposus Fat Gray matter of brain Muscle Spleen |
| Dark | Air Calcification Cerebrospinal fluid Cortical bone Fast-moving blood Fibrous tissue Ligaments, tendons | Air Calcification Cortical bone Fast-moving blood Fibrous tissue Ligaments, tendons |
For illustration purposes, a long TR is one that approximates 800 to 1000 milliseconds (msec) and a long TE exceeds 30 to 50 msec. Conversely, a short TR is often less than 800 msec and a short TE is often less than 30 msec. Alternative pulse sequences also are available and are used in certain clinical circumstances to enhance the delineation of pathologic processes. Among these are:
1. Gradient echo. A pulse sequence in which protons are “flipped” less than 90 degrees. As the flip angle tends toward 0 degrees the images create an increase in signal intensity from fluids, appearing with more T2-weighted emphasis. Because traditional spin-echo imaging requires a 90-degree pulse, these low flip angle sequences are considerably faster than conventional spin-echo sequences, especially when T2-weighted images are needed. Variations on the gradient echo sequences are also helpful in acquiring three-dimensional (3-D) data sets with subsequent multiplanar reformatting.
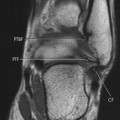
2. STIR (short tau inversion recovery). Pulse sequences used for fat suppression, in which a relatively short inversion time is used to null the fat signal while maintaining water and soft-tissue signal. These imaging sequences are particularly helpful in evaluating bone marrow pathology, including avascular necrosis (Fig. 2-12).
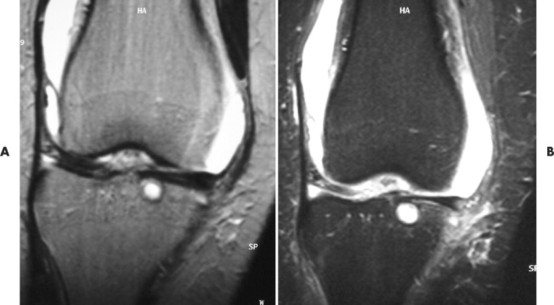 |
| FIG. 2-12 A and B, Magnetic resonance imaging coronal T2-weighted and STIR (short tau inversion recovery) sequences. The patient demonstrated joint effusion and a subchondral cyst in the tibia. |
A typical lumbar spine MRI protocol begins with a coronal preliminary image, termed scout, localizer or plan scan (see Fig. 2-11). On this image, localizer lines are superimposed, corresponding to the subsequent sagittal T1- and T2-weighted sequences. The sagittal sequences usually extend from the left to the right neuroforamina or, depending on the MR equipment and the radiologist’s preference. The direction of the sagittal slices always needs to be cross-checked before beginning interpretation. One of the middle sagittal sequences is used to “plan” the subsequent axial images. Axial images can be presented in two formats. One format is to have each slice parallel to each of the disc interspaces, most commonly for L3, L4, and L5, with the slices being angled to each disc plane line individually. The other format is to have a contiguous set of sequences extending from approximately L3 through S1. As depicted in the enclosed examples, the T1 sequences are noncontiguous, whereas the T2 sequences are contiguous. However, this is dependent on the inclination of the radiologist. The number of slices obtained is time dependent; therefore usually it is not common to evaluate the upper lumbar discs unless there is a probability of pathology specific to these regions. Similar protocols are used to evaluate other regions of the body, including the shoulder and knee.
The length of the total MRI examination can vary from 30 to 90 minutes, with an average examination taking 45 minutes. The length of the examination depends on the imaging sequences, which are gathered over 2- to 10-minute periods. Because of these prolonged examination times, it is critical that patients lie absolutely still for the duration of each imaging sequence. Referring physicians may find it beneficial to visit the MRI facility so that they can adequately explain the procedure to their patients. A well-informed patient is not likely to be overly anxious about the examination.
Patients should be asked to dress in comfortable clothing (e.g., a sweat suit) and without metal artifacts (e.g., jewelry, watches, and keys). These objects can result in suboptimal image quality because they can disturb the quality of the magnetic field. Credit cards should not be brought into the MRI facility because the large magnetic field erases the magnetic codes.
The patient is placed on the MRI table at the beginning of the examination. Surface coils, which transmit and receive radiofrequency data, are placed on the patient in the region to be examined at this juncture. Once this is accomplished the patient is glided into the MRI gantry. The technologists indicate to the patient when each of the examination sequences is to begin. The patient recognizes that the examination is ongoing by hearing a knocking noise coming from the MRI equipment. The typical rhythmic beating noise emanating from the MRI scanner comes from the gradient coils, which are intermittently energized to create cross-sectional images. Many MRI facilities also provide earphones with a choice of music. Noise suppression systems may be available as well.
Claustrophobia is the most common complication of an MRI examination; it is estimated to occur in up to 5% of patients. Although reassurance and positive interaction with the technologist works for most patients, a mild tranquilizer can be effective in alleviating high anxiety. Sometimes placing the patient within the scanner in a prone rather than supine position also reduces claustrophobia.
CONTRAINDICATIONS
A thorough history must be obtained from the patient before the MRI examination commences, with particular attention to a history of surgical intervention or industrial exposure to metals (Box 2-1). Generally, patients with pacemakers or other implanted electronic devices (including certain ear implants) cannot be examined. Many intracranial aneurysm clips are ferromagnetic, and torque or twist in a magnetic field; therefore MRI examinations are contraindicated in patients with vascular clips within the brain.
BOX 2-1
Selected Implants and Metal Artifacts That May Preclude or Interfere with a Magnetic Resonance Imaging Examination
Pacemakers
Implanted electromagnetic devices
Aneurysm clips (especially brain)
Vascular coils and filters
Heart valves
Porta-Cath device
Cochlear implants
Ocular implants
Surgical staples
Shrapnel
Contraceptive diaphragms or coils
Penile implants
Implanted insulin pumps
Bone or joint replacements
Tattoos or permanent eyeliner (contain metallic pigments)
Some types of heart valves are affected also; however, this torque is usually less than the stress that normally occurs as a result of blood flow. Hence the presence of heart valves is not necessarily an absolute contraindication for an MRI examination. Orthopedic devices, although not usually contraindications to an MRI examination, can lead to considerable image degradation by causing significant alteration to the magnetic field homogeneity. In all circumstances, the presence of surgical devices should be made known to the MRI facility staff and radiologist. Especially in musculoskeletal MRI, patients should be encouraged to supply radiographs of the region to be examined, because correlation of the MRI examined with the x-rays can be extremely helpful to exclude metallic foreign bodies and aid in image interpretation.
Another potential hazard relating to MRI examination is ferromagnetic projectiles. This has received attention in the popular press by discussing circumstances in which ferromagnetic objects, including oxygen tanks, have been attracted to the MRI magnet. These objects may be able to reach lethal speeds by the time they intercept the magnet. Reports include cleaning crews inadvertently entering the MRI suite with floor polishers that were dramatically wrested from the operator and pulled into the magnet bore. This represents an expensive situation in a high-field scanner.
MAGNETIC RESONANCE IMAGING CONTRAST AGENTS
MRI can obtain most anatomic information by relying on the inherent contrast of the body’s tissues; however, under certain clinical circumstances an artificial contrast medium may be necessary. The first and most popular MRI contrast agent is gadopentetate dimeglumine (sold under the trade name Magnevist), a stable chelate made from the heavy metal gadolinium. Gadolinium is a paramagnetic substance that produces strong relaxation on the adjacent hydrogen nuclei; 8 therefore gadolinium acts as a T1-shortening agent that causes tissues containing this element to appear bright on T1-weighted images.
Gadolinium is not an iodinated contrast medium such as is used in CT examinations and angiography; subsequent adverse reactions are quite rare. Gadolinium chelates have been used safely as intravenous and intraarticular MRI contrast agents. 9 Gadolinium is especially useful in the detection of various central nervous system pathologies such as tumors and multiple sclerosis. Most commonly chiropractic patients with failed low back surgery require gadolinium to help differentiate recurrent disc herniation from scar formation.
MAGNETIC RESONANCE ANGIOGRAPHY
Magnetic resonance angiography (MRA) is a developing alternative to conventional angiography for the evaluation of vascular disease. This examination has the specific advantage of being totally noninvasive because no contrast medium is used. However, the spatial resolution of MRA is lower than routine angiographic examinations. Presently this examination is primarily used to study large vessels (Fig. 2-13).
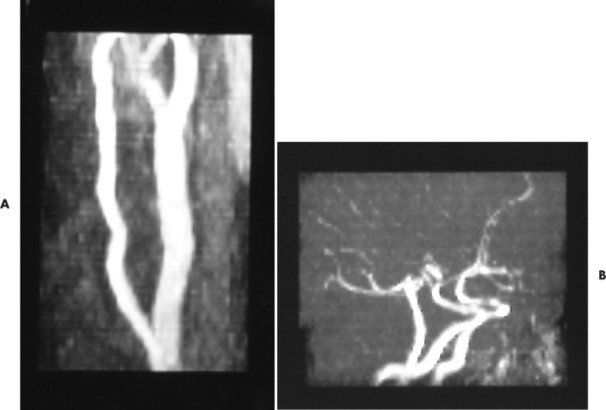 |
| FIG. 2-13 A and B, Magnetic resonance angiography of the carotid and intracranial circulation. |
Computed Tomography
BACKGROUND
CT is a diagnostic imaging procedure that constructs a cross-sectional image through the combination of x-ray physics and computer technology. Although early attempts to construct computed tomographic equipment occurred during the late 1950s, the first practical working model of a CT system was developed by Godfrey Hounsfield in 1972. 10 Hounsfield, a computer engineer, worked at the Central Research Laboratory for Electric and Music Industry (EMI) in England, the company also notable for producing the works of the Beatles. Hounsfield won the Nobel Prize for Medicine and Physiology in 1979 for his work leading to the development of computed tomography. Hounsfield’s original CT scan took hours to acquire a single slice of image data and more than 24 hours of computer time to reconstruct these data into a single image. By contrast, today’s CT systems can acquire a single image in less than 1 second and reconstruct the image almost instantly.
IMAGE PRODUCTION
The CT scanner uses a radiographic tube contained within a gantry that emits a thin x-ray beam as it rotates about the patient (Figs. 2-14 and 2-15). An array of detectors on the opposite side of the tube intercepts those x-rays transmitted through the patient. The information from the attenuated x-ray beam is evaluated by a computer system that constructs the cross-sectional data directly in the axial plane line, with the ability to reformat the information into an indirect 3-D image. This overcomes a significant disadvantage of conventional x-ray in which three-dimensional (3-D) anatomy is superimposed on a two-dimensional (2-D) radiographic surface, representing a summation of superimposed densities.
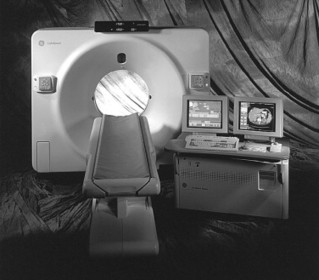 |
| FIG. 2-14 Operator’s console and spiral computed tomography imaging system. (From Bushong S: Radiologic science for technologists physics, biology, and protection, ed 7. St Louis, 2001, Mosby.) |
Stay updated, free articles. Join our Telegram channel

Full access? Get Clinical Tree


